Abstract
Purpose
Methods
Results
References
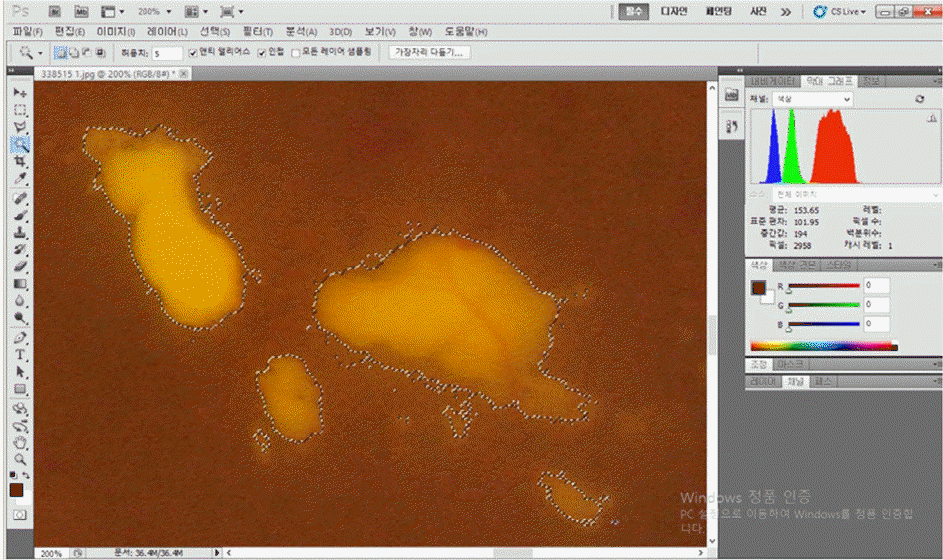
 | Figure 1.Measuring the amount of hard exudates with color fundus photography and the Photoshop program. The selected area by the magic wand tool is expressed in pixels by the histogram option. |
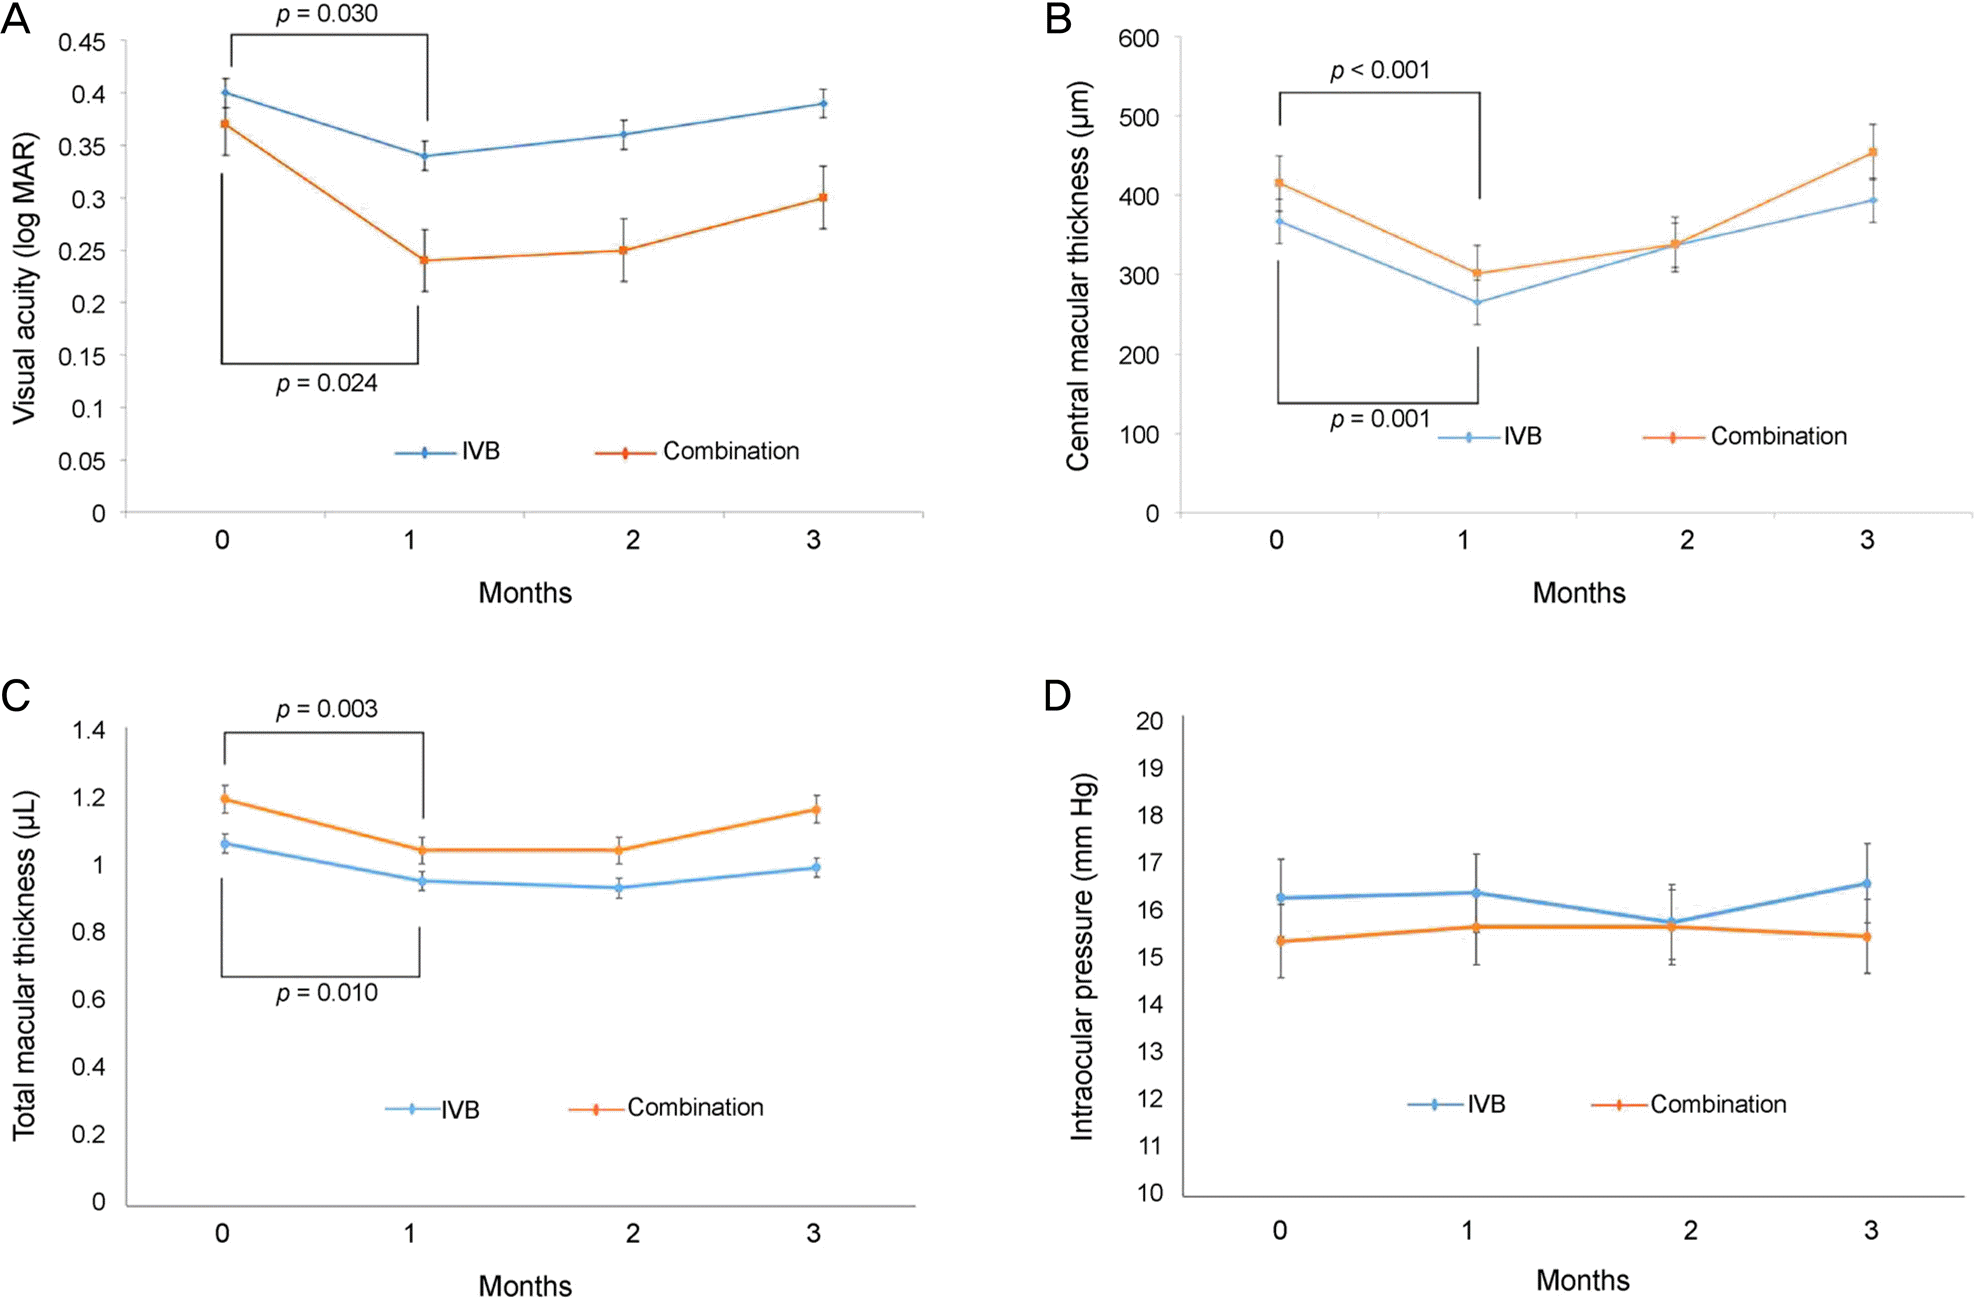
 | Figure 2.Changes in parameters of both groups during the follow-up after injection. (A) Visual acuity. (B) Spectral domain optical coherence tomography (SD-OCT) measurements of central macular thickness. (C) SD-OCT measurements of total macular volume. (D) Intraocular pressure. IVB = intravitreal bevacizumab. |
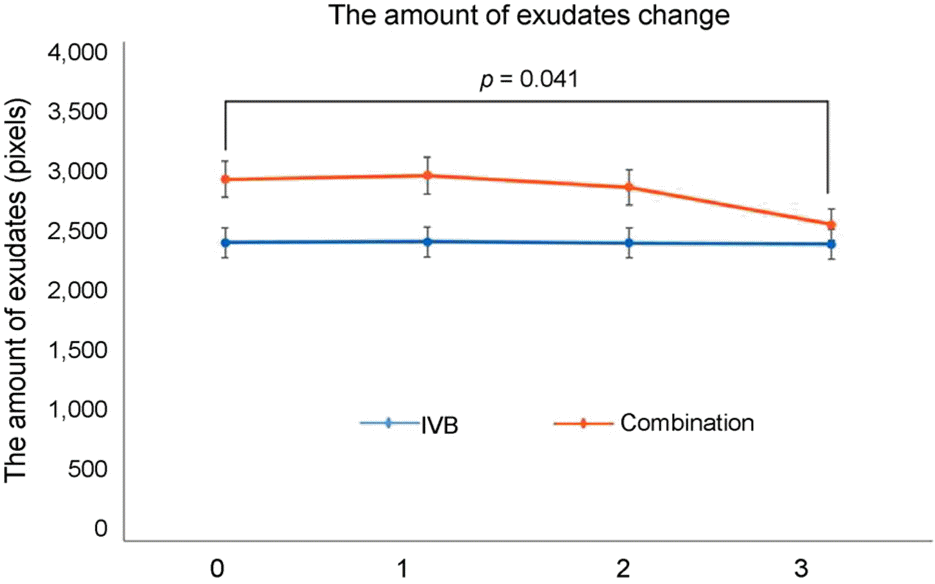
 | Figure 3.Changes in amount of hard exudates (in pixels) detected by fundus photography and the Photoshop program of both groups during the follow-up after injection. IVB = intravitreal bevacizumab. |
Table 1.
| IVB group | Combination group | p-value | |
|---|---|---|---|
| Eyes | 35 | 31 | |
| Age (years) | 53.9 ± 9.1 | 51.7 ± 7.9 | 0.275* |
| Male:Female | 27:8 | 18:13 | 0.058† |
| Right:Left | 17:18 | 14:17 | 0.807† |
| Duration of diabetes (years) | 9.3 ± 7.2 | 7.11 ± 6.2 | 0.316* |
| Hypertension (yes:no) | 18:17 | 10:21 | 0.082* |
| Visual acuity (log MAR) | 0.40 ± 0.27 | 0.37 ± 0.19 | 0.091* |
| Intraocular pressure (mm Hg) | 17.5 ± 3.6 | 15.7 ± 3.7 | 0.124* |
| Central macular thickness (μ m) | 367.0 ± 113.6 | 415.9 ± 157.8 | 0.262* |
| Total macular volume (mm3) | 1.06 ± 0.08 | 1.19 ± 0.04 | 0.165* |
| Amount of hard exudates (pixels) | 2,394 ± 1,989 | 2899 ± 2,314 | 0.235* |
Values are presented as mean ± SD unless otherwise indicated. IVB group = intravitreal bevacizumab injections in diabetic macular edema; Combination group = combined therapy with intravitreal bevacizumab and subtenon triamcinolone acetonide injection in diabetic macular edema.
Table 2.
|
IVB grou |
Combination group |
|||||
|---|---|---|---|---|---|---|
| Mean ± SD | p-value* | Mean ± SD | p-value† | p-value‡ | ||
| Visual acuity (log MAR) | At baseline | 0.40 ± 0.27 | 0.37 ± 0.19 | 0.291 | ||
| 1 month | 0.34 ± 0.22 | 0.030 | 0.24 ± 0.22 | 0.024 | 0.124 | |
| 2 months | 0.36 ± 0.23 | 0.916 | 0.25 ± 0.19 | 0.306 | 0.077 | |
| 3 months | 0.39 ± 0.28 | 0.854 | 0.30 ± 0.21 | 0.285 | 0.153 | |
| Central macular thickness (μm) | At baseline | 367.0 ± 113 | 415.9 ± 157 | 0.262 | ||
| 1 month | 265 ± 104 | <0.001 | 302 ± 144 | 0.001 | 0.223 | |
| 2 months | 337 ± 129 | 0.196 | 338 ± 194 | 0.066 | 0.982 | |
| 3 months | 394 ± 130 | 0.410 | 454 ± 221 | 0.953 | 0.344 | |
| Total macular volume (mm3) | At baseline | 1.06 ± 0.08 | 1.19 ± 0.04 | 0.165 | ||
| 1 month | 0.95 ± 0.09 | 0.003 | 1.04 ± 0.10 | 0.010 | 0.211 | |
| 2 months | 0.93 ± 0.10 | 0.059 | 1.04 ± 0.12 | 0.068 | 0.351 | |
| 3 months | 0.99 ± 0.14 | 0.790 | 1.15 ± 0.09 | 0.590 | 0.245 | |
| Amount of hard exudates (pixels) | At baseline | 2,394 ± 1,989 | 2,899 ± 2,314 | 0.235 | ||
| 1 month | 2,400 ± 1,998 | 0.871 | 2,930 ± 2,015 | 0.865 | 0.278 | |
| 2 months | 2,389 ± 1,994 | 0.899 | 2,837 ± 2,020 | 0.217 | 0.343 | |
| 3 months | 2,379 ± 2,030 | 0.968 | 2,536 ± 1,981 | 0.041 | 0.608 | |
| Intraocular pressure (mm Hg) | At baseline | 16.2 ± 3.5 | 15.3 ± 2.8 | 0.164 | ||
| 1 month | 16.3 ± 4.1 | 0.879 | 15.6 ± 3.2 | 0.812 | 0.491 | |
| 2 months | 15.7 ± 3.9 | 0.535 | 15.6 ± 2.9 | 0.815 | 0.172 | |
| 3 months | 16.5 ± 4.4 | 0.689 | 15.4 ± 3.3 | 0.977 | 0.173 | |
Values are presented as mean ± SD unless otherwise indicated. IVB group = intravitreal bevacizumab injections in diabetic macular edema; Combination group = combined therapy with intravitreal bevacizumab and subtenon triamcinolone acetonide injection in diabetic macular edema.
* p-value of values at each follow-up period comparing to baseline values in intravitreal bevacizumab injection group, Wilcoxon matched-pairs signed ranks test


 PDF
PDF ePub
ePub Citation
 Print
Print


 XML Download