Abstract
Purpose
Methods
Results
Conclusions
References
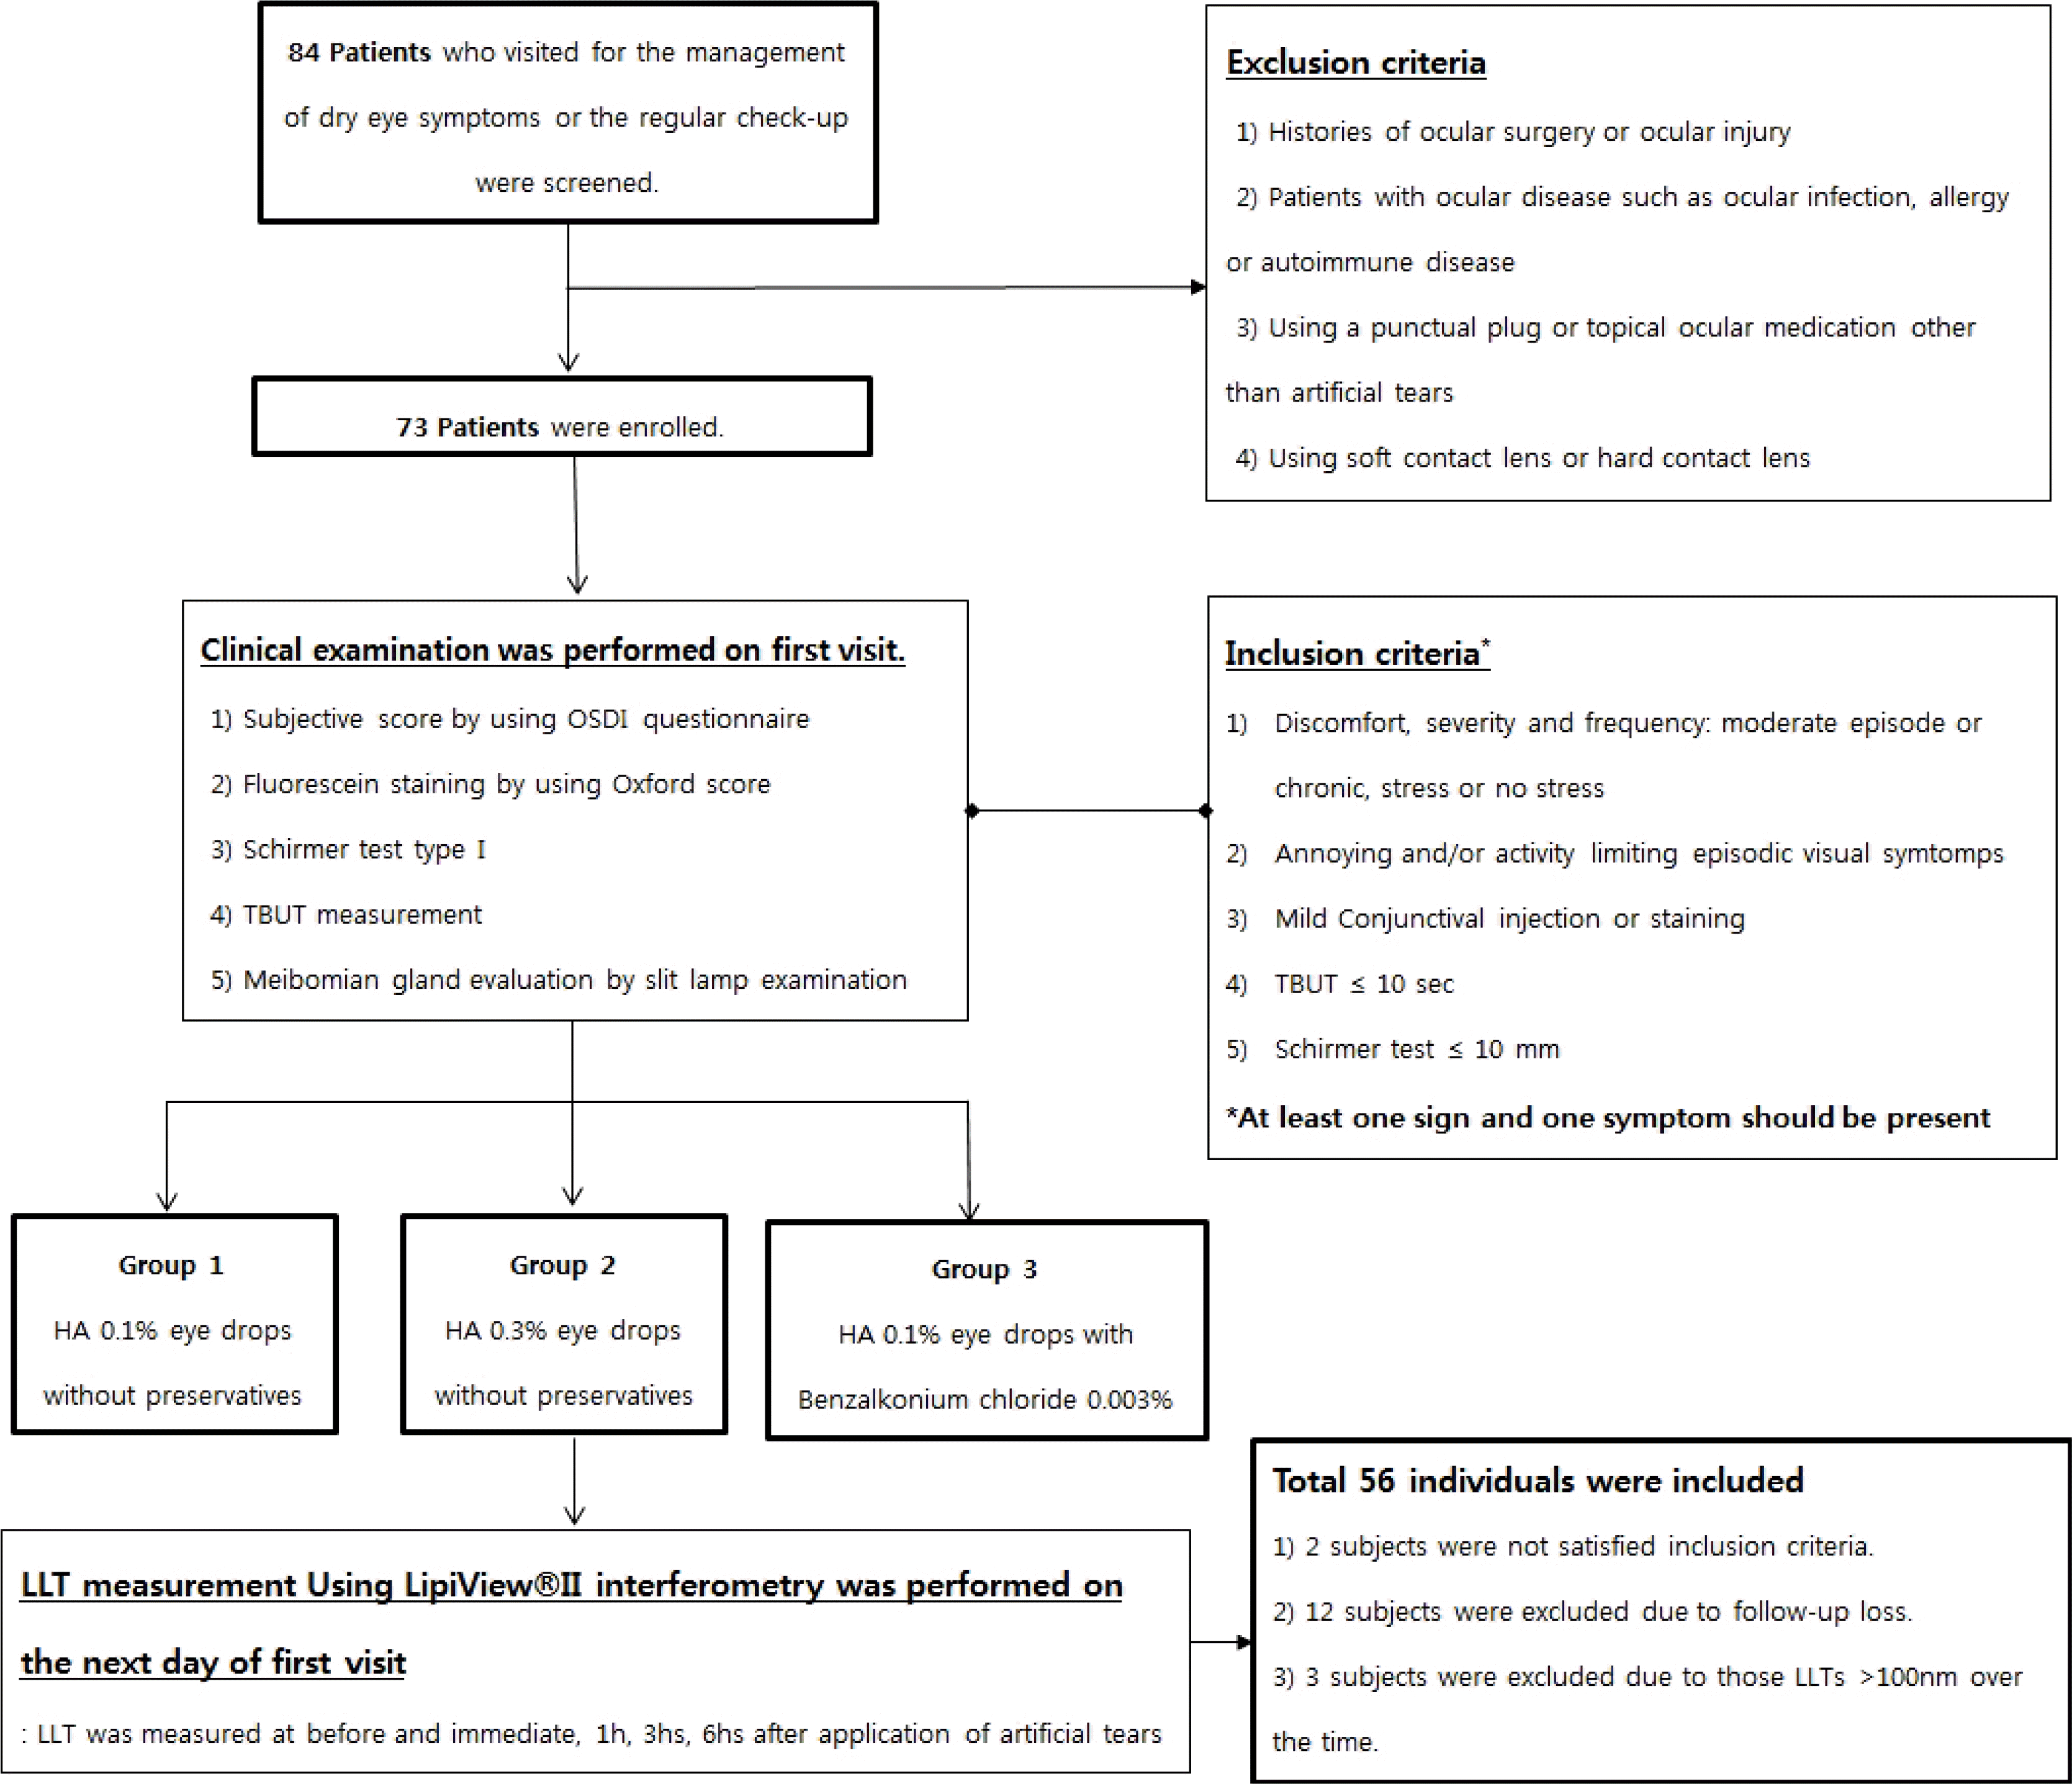
 | Figure 1.Schematic diagram of the study protocol. 84 patient were screened and total 56 patients were included. All subjects underwent measurement of tear film break-up time (TBUT), Schirmer test, ocular surface staining, meibomian gland evaluation, and subjective score assessment using Ocular Surface Disease Index (OSDI). Patients were randomly assigned to 1 of 3 groups using table of random numbers. Lipid layer thickness (LLT) was measured before, immediately after and 1 hr, 3 hrs, and 6 hrs after artificial tears application. HA = sodium hyaluronate; h(s) = hour(s). |
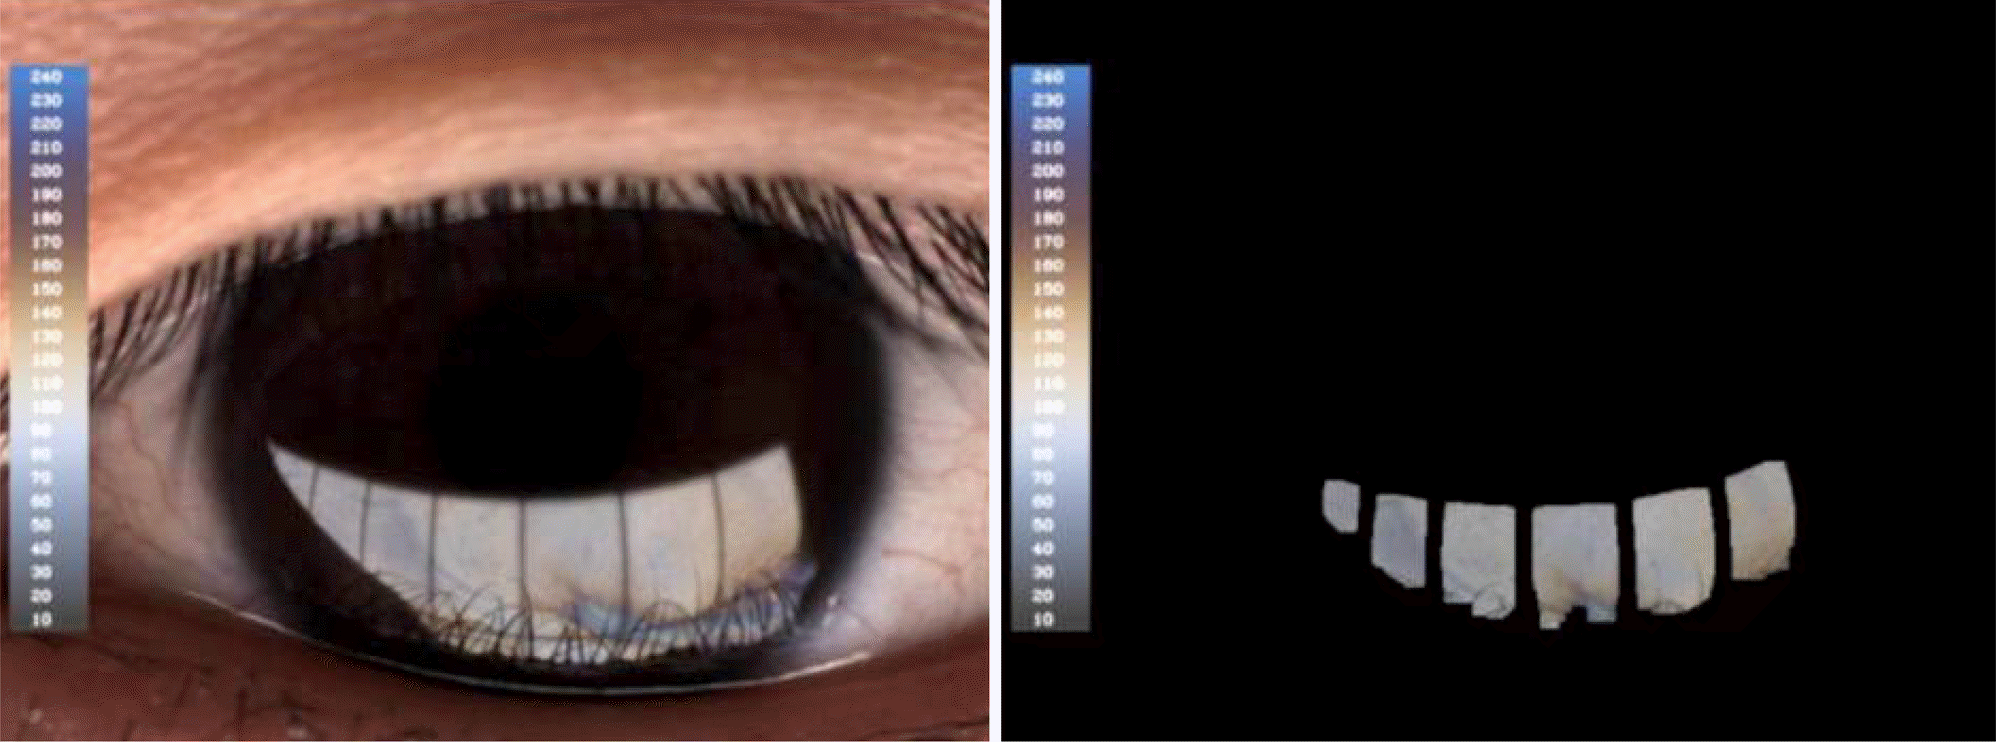
 | Figure 2.The analyzed image by Lipiview®II interferometer. The values are given in interferometric color units (ICUs) where in 1 ICU approximately reflects 1nm of the tear lipid layer thickness (LLT). The average LLT of this patient was 99 ICUs. |
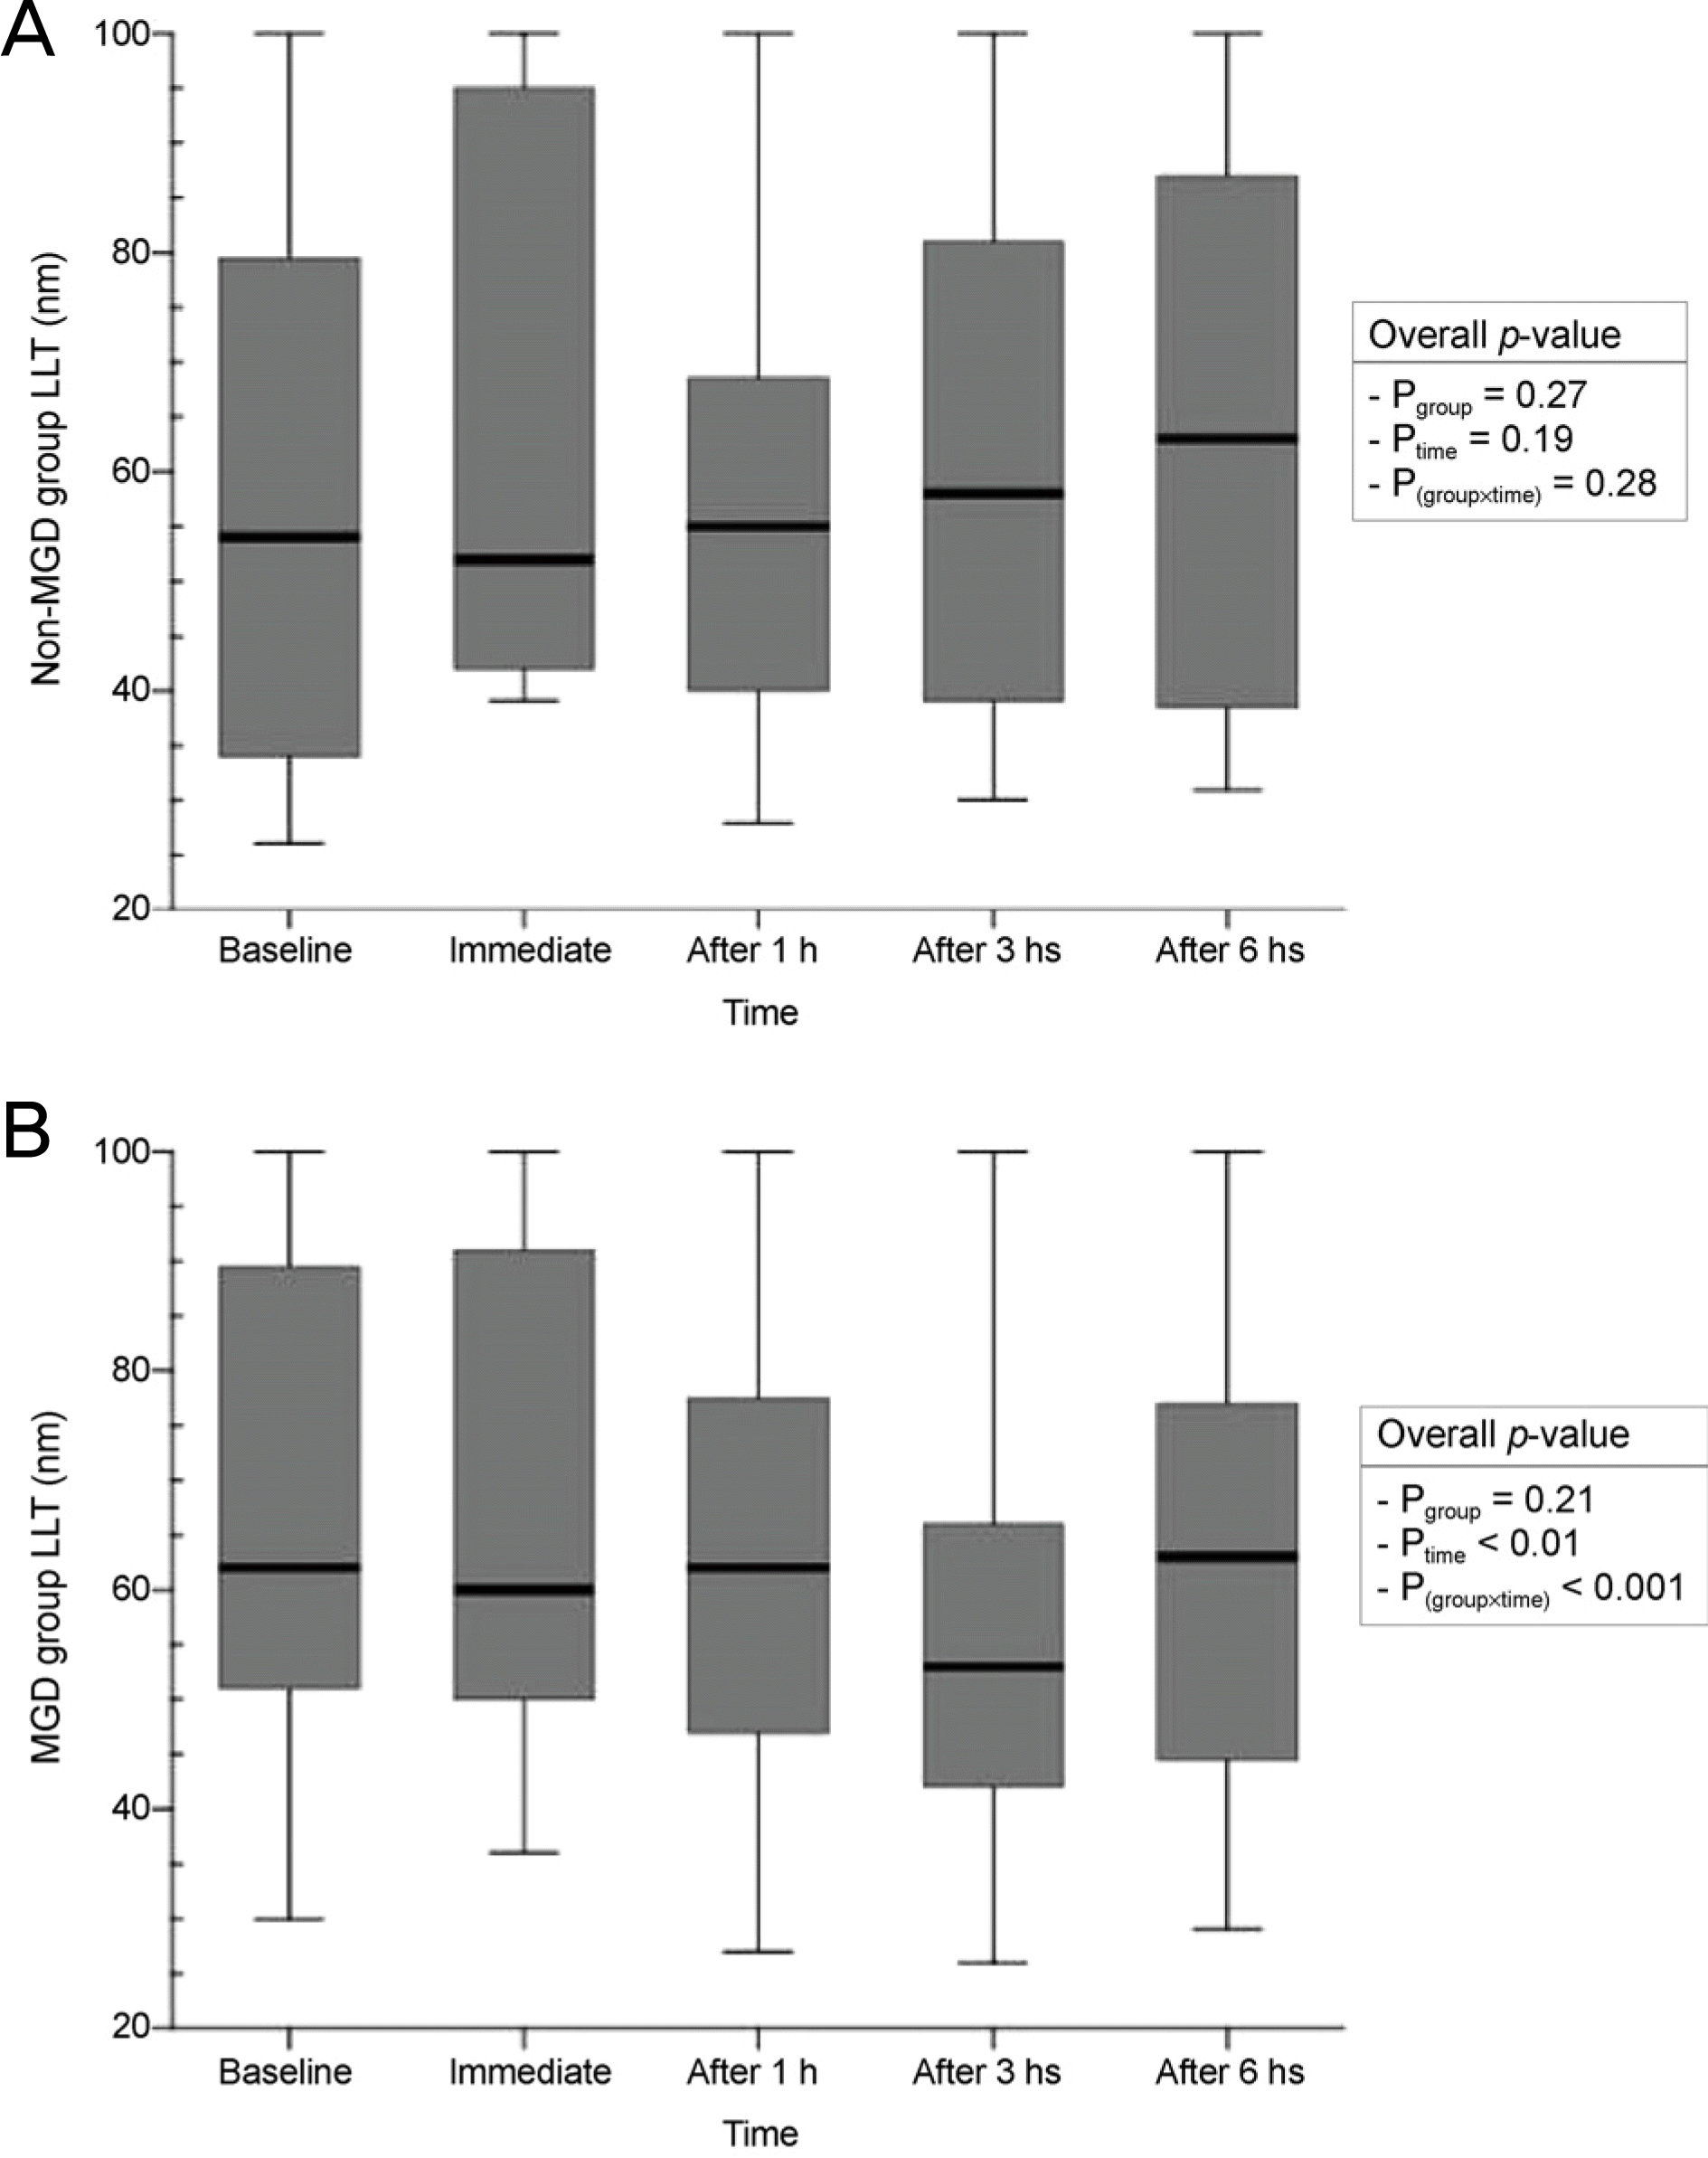
 | Figure 3.Box plot of lipid layer thickness (LLT) stratified by (A) non-Meibomian gland dysfunction (MGD) group and (B) MGD group. Horizontal lines in the boxes indicate the median; box limits show third quartile and first quartile. Maximum and minimum values are indicated by the top and the bottom whisker ends, respectively. Overall p-values were calculatedby linear mixed model. h(s) = hour(s). |
 | Figure 4.Box plots of lipid layer thickness (LLT) for comparison between two groups of Meibomian gland dysfunction patients. Figure (A) shows comparision between Group 1 and 2 and figure (B) shows Comparision berween Group 1 and 3. Horizontal lines in the boxes indicate the median; box limits show third quartile and first quartile. Outliers (1.5 × 3 interquartile ranges) are indicated as circles. Maximum and minimum values are indicated by the top and the bottom whisker ends, respectively. p-values were calculated by Linear mixed model. h(s) = hour(s). |
Table 1.
| Variables | Group 1 | Group 2 | Group 3 | p-value* |
|---|---|---|---|---|
| N (eyes) | 18 | 20 | 18 | |
| Age (years) | 26.56 ± 1.85 | 27.62 ± 3.67 | 27.11 ± 2.90 | 0.54 |
| (24–29) | (23–41) | (24–32) | ||
| BUT (sec) | 6.56 ± 1.65 | 5.33 ±1.56 | 6.00 ± 2.26 | 0.13 |
| (4–11) | (3–9) | (3–11) | ||
| Schirmer test (mm) | 14.11 ± 3.05 | 12.00 ± 2.17 | 13.11 ± 3.09 | 0.07 |
| (10–20) | (8–16) | (8–18) | ||
| Corneal staining score | 0.89 ± 0.90 | 0.52 ± 0.60 | 0.58 ± 0.51 | 0.22 |
| (0–3) | (0–2) | (0–1) | ||
| Subjective score (OSDI) | 17.67 ± 16.57 | 16.93 ± 15.77 | 14.75 ± 16.29 | 0.85 |
| (8–70) | (4.2–60) | (4.2–60) | ||
| MGD grade | 0.94 ± 0.73 | 1.10 ± 0.94 | 1.11 ± 0.99 | 0.83 |
| (0–2) | (0–2) | (0–2) | ||
| Baseline LLT | 64.76 ± 25.56 | 67.71 ± 23.72 | 61.15 ± 24.88 | 0.70 |
| (26–100) | (30–100) | (31–100) |
Values are presented as mean ± SD (range) unless otherwise indicated. ‘Group 1’ is ‘Sodium hyaluronate (HA) 0.1% eye drops without preservatives’, ‘Group 2’ is ‘HA 0.3% eye drops without preservatives’, and ‘Group 3’ is ‘HA 0.1% with Benzalkonium chloride 0.003%’. BUT = tear film break-up time; OSDI = ocular surface disease index; MGD = Meibomian gland dysfunction; LLT=Lipid layer thickness.
Table 2.
| Time |
LLT (nm) |
Overall P* Post | t-hoc p-value* for time | ||
|---|---|---|---|---|---|
| Group 1 | Group 2 | Group 3 | |||
| Baseline | 64.76 ± 25.56 | 67.71 ± 23.72 | 61.15 ± 24.88 | P group = 0.09 | Reference† |
| (26–100) | (30–100) | (31–100) | |||
| Immediate | 65.11 ± 21.95 | 79.14 ± 25.03 | 58.53 ± 15.17 | 0.29 | |
| (39–100) | (39–100) | (36–95) | |||
| After 1 h | 51.35 ± 15.51 | 73.76 ± 23.60 | 58.89 ± 18.09 | P time = 0.02 | 0.35 |
| (31–80) | (28–100) | (38–100) | |||
| After 3 hs | 52.41 ± 17.57 | 65.00 ± 25.09 | 55.57± 15.26 | P(group × time) < 0.01 | 0.03 |
| (26–100) | (29–100) | (33–100) | |||
| After 6 hs | 64.82 ± 22.94 | 60.57 ± 23.95 | 62.42 ± 19.83 | 0.52 | |
| (31–100) | (26–100) | (30–100) | |||
| p-value | <0.01 | <0.01 | 0.71 | ||
Values are presented as mean ± SD (range) unless otherwise indicated. ‘Group 1’ is ‘Sodium hyaluronate (HA) 0.1% eye drops without preservatives’, ‘Group 2’ is ‘HA 0.3% eye drops without preservatives’, and ‘Group 3’ is ‘HA 0.1% with Benzalkonium chloride 0.003%’. LLT = lipid layer thickness; h(s) = hour(s).
Table 3.
| Variables |
Non-MGD group (n = 19) |
MGD group (n = 39) |
||||||
|---|---|---|---|---|---|---|---|---|
| Group 1 | Group 2 | Group 3 | p-value* | Group 1 | Group 2 | Group 3 | p-value* | |
| N (eyes) | 5 | 8 | 6 | 13 | 12 | 12 | ||
| Age (years) | 27.08 ± 0.84 | 29.00 ± 4.96 | 25.67 ± 1.37 | 0.22 | 26.08 ± 1.93 | 26.77 ± 2.46 | 27.77 ± 3.22 | 0.26 |
| (27–29) | (26–41) | (24–27) | (24–29) | (23–29) | (24–32) | |||
| BUT (sec) | 5.60 ± 1.82 | 5.50 ± 1.77 | 5.67 ± 2.66 | 0.99 | 6.92 ± 1.50 | 5.23 ± 1.48 | 6.15 ± 2.15 | 0.06 |
| (4–8) | (4–9) | (3–9) | (5–11) | (3–8) | (3–11) | |||
| Schirmer test (mm) | 13.60 ± 2.30 | 12.13 ± 2.10 | 14.33 ± 2.81 | 0.24 | 14.31 ± 3.35 | 11.92 ± 2.29 | 12.54 ± 3.15 | 0.12 |
| (10–16) | (10–16) | (11–18) | (10–20) | (8–15) | (8–17) | |||
| Corneal staining score | 1.20 ± 0.84 | 0.75 ± 0.71 | 0.50 ± 0.55 | 0.28 | 0.77 ± 0.93 | 0.38 ± 0.56 | 0.62 ± 0.51 | 0.36 |
| (0–2) | (0–2) | (0–1) | (0–3) | (0–1) | (0–1) | |||
| Subjective score (OSDI) | 24.11 ± 25.73 | 11.72 ± 10.0 | 10.03 ± 2.26 | 0.25 | 15.20 ± 12.02 | 20.15 ± 18.07 | 16.93 ± 19.49 | 0.75 |
| (10–70) | (4.2–27.0) | (7.3–60) | (8–54.16) | (6.3–60) | (4.2–60) | |||
| Baseline LLT (nm) | 43.60 ± 22.12 | 72.13 ± 23.96 | 52.50 ± 28.49 | 0.14 | 64.76 ± 25.56 | 67.71 ± 23.72 | 61.15 ± 24.88 | 0.65 |
| (26–81) | (30–100) | (31–100) | (26–100) | (30–100) | (31–100) | |||
| MGD grade | 0 | 0 | 0 | 1.31 ± 0.48 | 1.77 ± 0.44 | 1.62 ± 0.77 | 0.13 | |
| (1–2) | (1–2) | (1–2) | ||||||
Values are presented as mean ± SD (range) unless otherwise indicated. ‘Group 1’ is ‘Sodium hyaluronate (HA) 0.1% eye drops without preservatives’, ‘Group 2’ is ‘HA 0.3% eye drops without preservatives’, and ‘Group 3’ is ‘HA 0.1% with Benzalkonium chloride 0.003%’. BUT = tear film break-up time; OSDI = ocular surface disease index; LLT = lipid layer thickness; MGD = Meibomian gland dysfunction.
Table 4.
| Time | Baseline | Immediate | After 1 h | After 3 hs | After 6 hs | p-value* | |
|---|---|---|---|---|---|---|---|
| Group 1 | LLT (nm) | 64.76 ± 25.56 | 65.11 ± 21.95 | 51.35 ± 15.51 | 52.41 ± 17.57 | 64.82 ± 22.94 | <0.01 |
| (26–100) | (39–100) | (31–80) | (26–100) | (31–100) | |||
| Post-hoc P | Reference† | 0.48 | <0.01 | <0.01 | 0.74 | ||
| Group 2 | LLT (nm) | 67.71 ± 23.72 | 79.14 ± 25.03 | 73.76 ± 23.60 | 65.00 ± 25.09 | 60.57 ± 23.95 | 0.01 |
| (30–100) | (39–100) | (28–100) | (29–100) | (26–100) | |||
| Post-hoc P | Reference† | 0.05 | 0.09 | 0.89 | 0.22 | ||
| Group 3 | LLT (nm) | 61.15 ± 24.88 | 58.53 ± 15.17 | 58.89 ± 18.09 | 55.57 ± 15.26 | 62.42 ± 19.83 | 0.45 |
| (31–100) | (36–95) | (38–100) | (33–100) | (30–100) |
Values are presented as mean ± SD (range) unless otherwise indicated. ‘Group 1’ is ‘Sodium hyaluronate (HA) 0.1% eye drops without preservatives’, ‘Group 2’ is ‘HA 0.3% eye drops without preservatives' and ‘Group 3’ is ‘HA 0.1% with Benzalkonium chloride 0.003%’. h(s) = hour(s); LLT = lipid layer thickness.


 PDF
PDF ePub
ePub Citation
 Print
Print


 XML Download