Abstract
Purpose
To investigate the outcomes of quantitative lens nuclear opalescence change after pars plana vitrectomy and intravitreal gas injection in patients with idiopathic epiretinal membrane and macular hole.
Methods
All patients were divided into two group according to the kinds of injected gases, either Group 1 (fluid/air exchange) or Group 2 (20% SF6 gas injection). Lens nuclear opalescence according to the classification of Lens Opacities Classification System (LOCS) III, mean nuclear density and maximal nuclear density of Pentacam® scheimpflug image changed by image J, besides refractive errors were evaluated before surgery and 1, 2, 4, 6, and 12 months after surgery.
Results
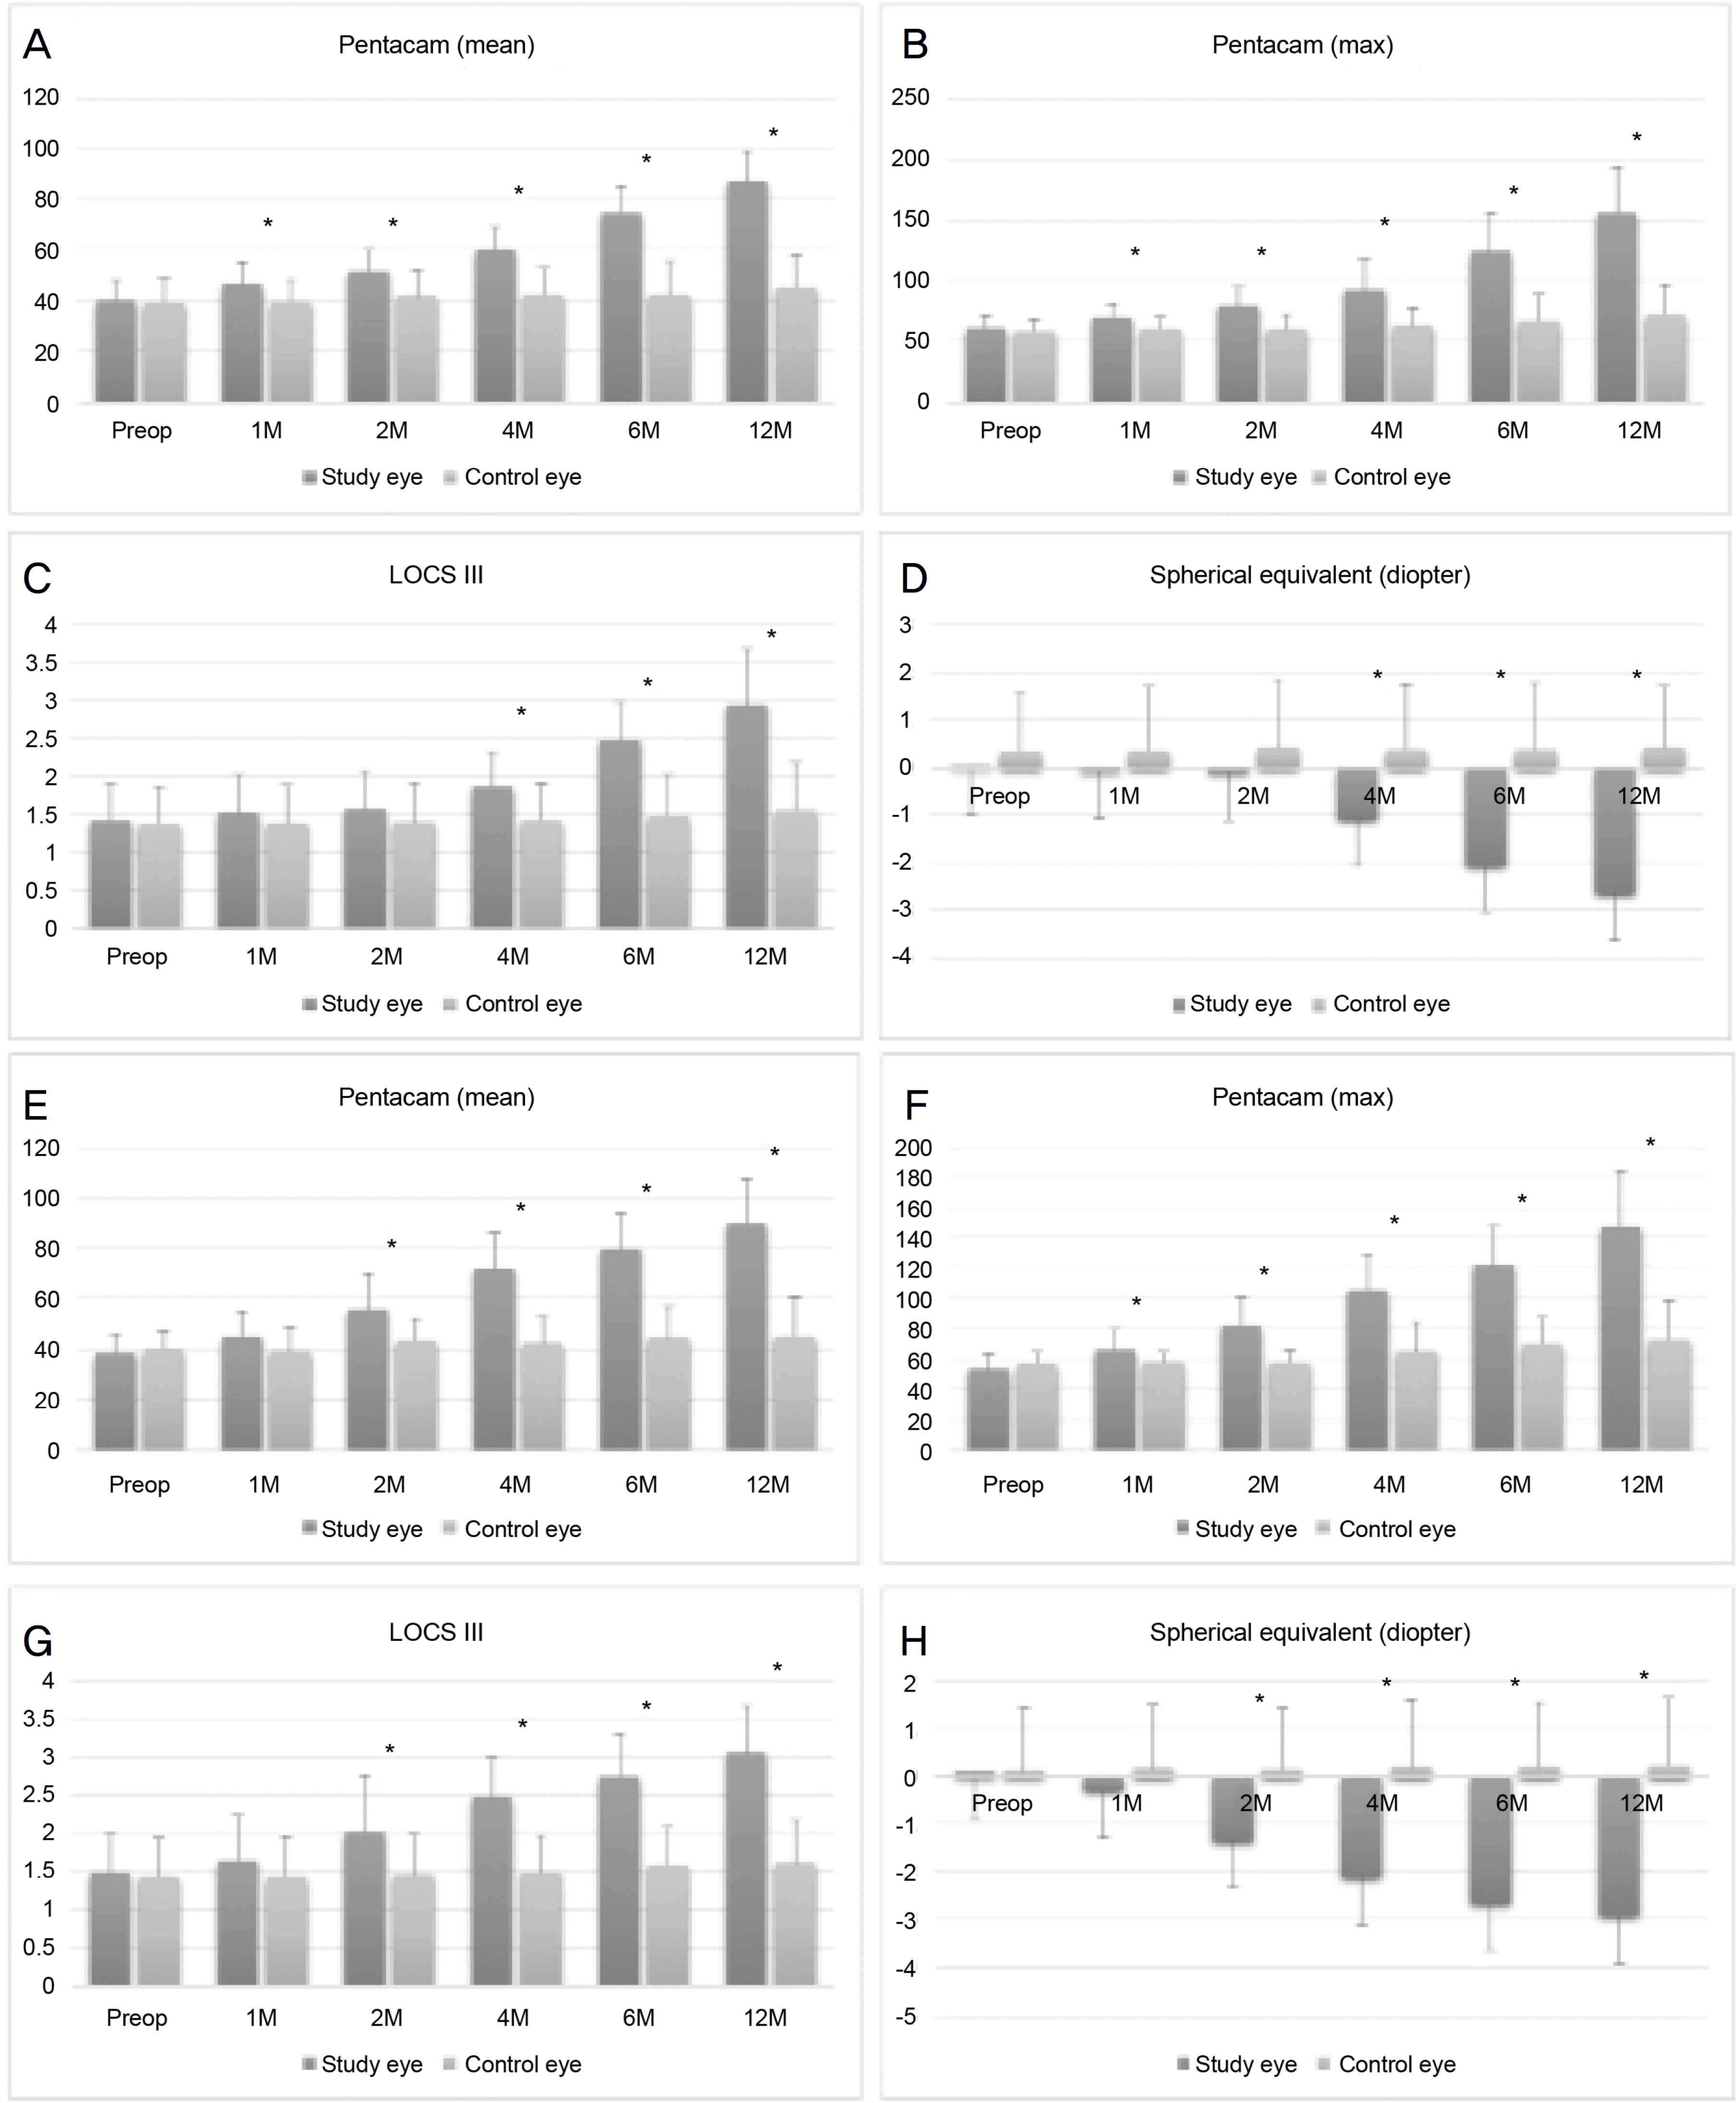
Out of 40 eyes of 40 patients included in the analysis, 21 received only fluid/air exchange (Group 1) and 19 received 20% SF6 gas injection (Group 2). There were significant changes in lens nuclear opalescence between the study and control (unaffected) eyes. In both groups, the study eyes experienced significant progression of cataract compared with the control eyes, in terms of mean nuclear density, maximal nuclear density and LOCS III. In comparison according to the kinds of injected gases, there was a significant difference in mean nuclear density after 4 months, maximal nuclear density after 2 months and 4 months, LOCS after 2 months and 4 months, and refractive error after 1, 2, 4, and 6 months between both groups (p = 0.003).
Conclusions
After vitrectomy and intravitreal gas injection, changes in postoperative lens nuclear opalescence of the study eyes progressed more rapidly compared with the control eyes. This study identified that lens nuclear opalescence of Group 2 progressed rapidly, but after 12 months there was no significant difference of lens opacity between the kinds of injected gases.
Go to : 
References
1. Chylack LT Jr, Wolfe JK, Singer DM, et al. The lens opacities abdominal system III. The longitudinal study of cataract study group. Arch Ophthalmol. 1993; 111:831–6.
2. Age-Related Eye Disease Study Research Group. The age-related eye disease study (AREDS) system for classifying cataracts from photographs: AREDS report no. 4. Am J Ophthalmol. 2001; 131:167–75.
3. Hall NF, Lempert P, Shier RP, et al. Grading nuclear cataract: abdominal and validity of a new method. Br J Ophthalmol. 1999; 83:1159–63.
4. Margherio RR, Cox MS Jr, Trese MT, et al. Removal of epimacular membranes. Ophthalmology. 1985; 92:1075–83.

5. Cherfan GM, Michels RG, de Bustros S, et al. Nuclear sclerotic cataract after vitrectomy for idiopathic epiretinal membranes abdominal macular pucker. Am J Ophthalmol. 1991; 111:434–8.
6. Ogura Y, Takanashi T, Ishigooka H, Ogino N. Quantitative analysis of lens changes after vitrectomy by fluorophotometry. Am J Ophthalmol. 1991; 111:179–83.

7. Melberg NS, Thomas MA. Nuclear sclerotic cataract after abdominal in patients younger than 50 years of age. Ophthalmology. 1995; 102:1466–71.
8. Hsuan JD, Brown NA, Bron AJ, et al. Posterior subcapsular and nuclear cataract after vitrectomy. J Cataract Refract Surg. 2001; 27:437–44.

9. Thompson JT. The role of patient age and intraocular gas use in abdominal progression after vitrectomy for macular holes and epiretinal membranes. Am J Ophthalmol. 2004; 137:250–7.
10. Michael R. Development and repair of cataract induced by abdominal radiation. Ophthalmic Res. 2000; 32(Suppl 1):ii–iii. 1–44.
11. Tranos PG, Peter NM, Nath R, et al. Macular hole surgery without prone positioning. Eye (Lond). 2007; 21:802–6.

12. de Bustros S, Thompson JT, Michels RG, et al. Nuclear sclerosis after vitrectomy for idiopathic epiretinal membranes. Am J Ophthalmol. 1988; 105:160–4.

13. Gupta D. Face-down posturing after macular hole surgery: a review. Retina. 2009; 29:430–43.
14. Hasegawa Y, Hata Y, Mochizuki Y, et al. Equivalent tamponade by room air as compared with SF(6) after macular hole surgery. Graefes Arch Clin Exp Ophthalmol. 2009; 247:1455–9.

15. Kim SS, Smiddy WE, Feuer WJ, Shi W. Outcomes of sulfur abdominal (SF6) versus perfluoropropane (C3F8) gas tamponade for macular hole surgery. Retina. 2008; 28:1408–15.
16. Kirwan JF, Venter L, Stulting AA, Murdoch IE. LOCS III examination at the slit lamp, do settings matter? Ophthalmic Epidemiol. 2003; 10:259–66.

17. Tan AC, Loon SC, Choi H, Thean L. Lens Opacities Classification System III: cataract grading variability between junior and senior staff at a Singapore hospital. J Cataract Refract Surg. 2008; 34:1948–52.

18. Grewal DS, Brar GS, Grewal SP. Correlation of nuclear cataract lens density using Scheimpflug images with Lens Opacities Classification System III and visual function. Ophthalmology. 2009; 116:1436–43.

19. Magalhães FP, Costa EF, Cariello AJ, et al. Comparative analysis of the nuclear lens opalescence by the Lens Opacities Classification System III with nuclear density values provided by Oculus Pentacam: a cross-section study using Pentacam Nucleus Staging software. Arq Bras Oftalmol. 2011; 74:110–3.

20. Briand S, Chalifoux E, Tourville E, et al. Prospective randomized trial: outcomes of SF₆ versus C₃ F₈ in macular hole surgery. Can J Ophthalmol. 2015; 50:95–100.
21. Petermeier K, Szurman P, Bartz-Schmidt UK, Gekeler F. Pathophysiology of cataract formation after vitrectomy. Klin Monbl Augenheilkd. 2010; 227:175–80.
Go to : 
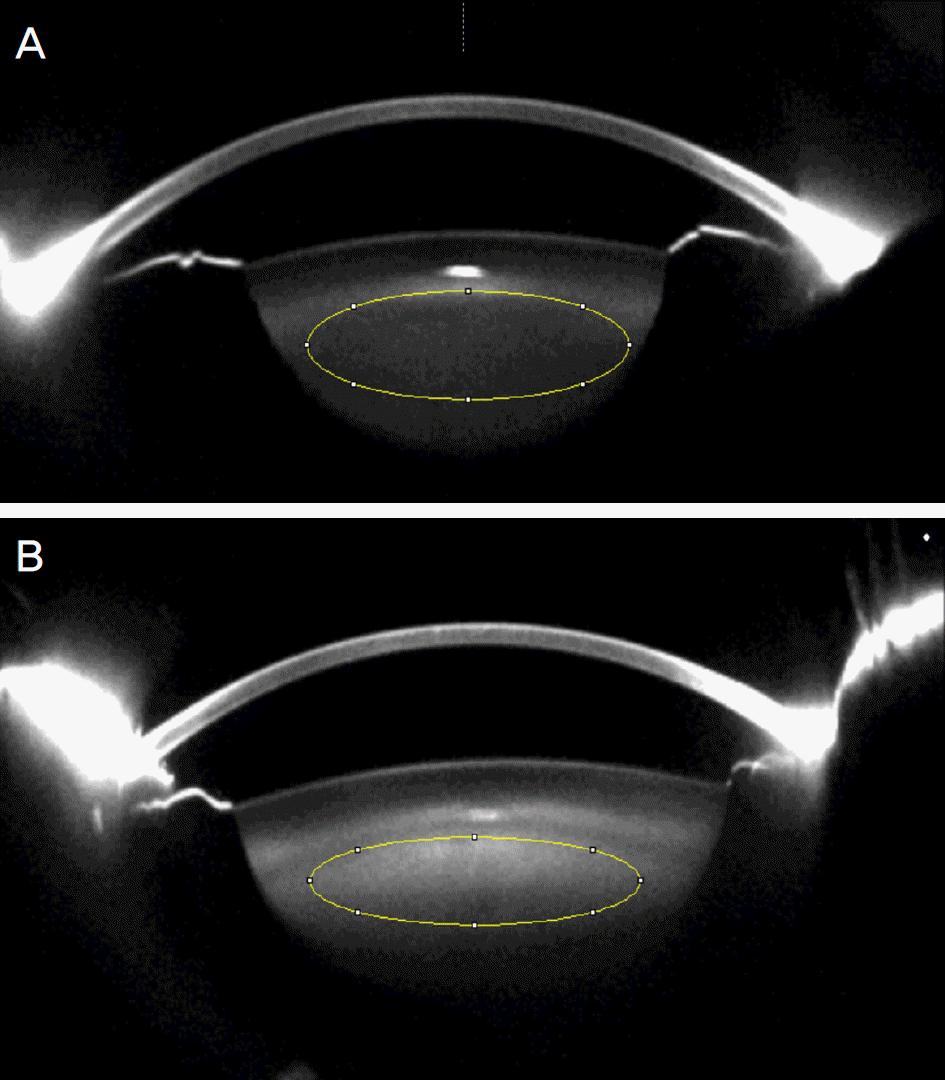
 | Figure 1.Scheimpflug image of lens exported to ImageJ software for measuring the nuclear density in the region of interest. (A) Scheimpflug image on pentacam of preoperative cataract. (B) Same patient Scheimpflug image on pentacam of 12 months postoperative cataract. |
 | Figure 2.Comparison of average cataract change between study eye and control eye over time. Figure (A-D) show average cataract change after vitrectomy of group 1. Figure (E-H) show average cataract change after vitrectomy of group 2. Cataract change was more rapid in study eyes than control eyes. Preop = preoperation; M = month(s). * p < 0.05 compared with fellow eye. |
Table 1.
Demographics
Table 2.
Comparisons of cataract progression rate according to the kinds of injected gases
| Group 1 | Group 2 | p-value | |
|---|---|---|---|
| Pentacam (mean) | |||
| 1 month | 6.4 ± 6.7 | 7.1 ± 4.9 | 0.700 |
| 2 months | 11.6 ± 6.2 | 17.5 ± 12.4 | 0.059 |
| 4 months | 20.0 ± 10.3 | 33.5 ± 14.0 | 0.001* |
| 6 months | 34.8 ± 12.9 | 41.5 ± 14.0 | 0.126 |
| 12 months | 47.0 ± 13.9 | 51.5 ± 16.7 | 0.355 |
| Pentacam (max) | |||
| 1 month | 8.1 ± 6.9 | 12.7 ± 8.2 | 0.059 |
| 2 months | 18.8 ± 9.9 | 28.1 ± 17.9 | 0.046* |
| 4 months | 31.7 ± 18.9 | 51.8 ± 23.7 | 0.005* |
| 6 months | 62.4 ± 27.3 | 68.2 ± 25.9 | 0.490 |
| 12 months | 94.5 ± 31.8 | 94.0 ± 34.8 | 0.961 |
| LOCS III | |||
| 1 month | 0.10 ± 0.30 | 0.16 ± 0.37 | 0.561 |
| 2 months | 0.14 ± 0.36 | 0.53 ± 0.61 | 0.019* |
| 4 months | 0.43 ± 0.60 | 1.00 ± 0.67 | 0.007* |
| 6 months | 1.05 ± 0.67 | 1.26 ± 0.73 | 0.337 |
| 12 months | 1.52 ± 0.81 | 1.58 ± 0.61 | 0.811 |
| SE | |||
| 1 month | –0.11 ± 0.29 | –0.38 ± 0.42 | 0.022* |
| 2 months | –0.13 ± 0.28 | –1.43 ± 0.85 | 0.000* |
| 4 months | –1.11 ± 0.62 | –2.19 ± 1.00 | 0.000* |
| 6 months | –2.07 ± 0.74 | –2.74 ± 0.97 | 0.019* |
| 12 months | –2.68 ± 0.98 | –3.00 ± 0.93 | 0.297 |


 PDF
PDF ePub
ePub Citation
 Print
Print


 XML Download