

 PDF
PDF ePub
ePub Citation
 Print
Print


Abstract
Purpose
To compare the orbital volume calculated from various slice thickness facial computed tomography scans using a semi-automated computer program.
Methods
Axial and coronal scans of 2, 2.5, 3 mm slice thickness facial computed tomography scans were used to measure the orbital volume. The cross-sectional area was determined from each slice using a semi-automated computer program (MATLAB 2009a®, MathWorks, Inc., Natick, MA, USA), and then the volume was calculated from serial reconstruction of the cross sections.
Results
The measured value in the 2 mm images was 33.14 ± 2.37 cm3 in the right orbit and 34.32 ± 2.60 cm3 in the left orbit for the axial scans, and 35.54 ± 3.58 cm3 in the right orbit and 34.96 ± 4.05 cm3 in the left orbit for the coronal scans. In the 2.5 mm images, the values were 33.28 ± 3.35 cm3 in the right orbit and 33.73 ± 4.10 cm3 in the left orbit for the axial scans, and 35.24 ±3.98 cm3 in the right orbit and 35.10 ± 3.93 cm3 in the left orbit for the coronal scans. In the 3 mm images, the values were 33.23 ± 2.70 cm3 in the right orbit and 33.39 ± 2.69 cm3 in the left orbit for the axial scans, and 33.20 ± 3.64 cm3 in the right orbit and 32.95 ± 3.45 cm3 in the left orbit for the coronal scans. In the 3 mm image, there was not a significant difference in the calculated volume between the axial and coronal scans (p3mm = 0.62).
Conclusions
Because there is no difference in the results of the orbital volumetric measurements between three other slice thicknesses in the axial scan, using axial scan images with a computer program that semi-automatically calculates orbital volume is useful. In addition, the volume measured by thick slice images has more reproducibility than the volume measured by thin slice images.
Go to : 
References
1. Phillips PH. The orbit. Ophthalmol Clin North Am. 2001; 14:109–27.
2. Cooper WC. A method for volume determination of the orbit and its contents by high resolution axial tomography and quantitative digital image analysis. Trans Am Ophthalmol Soc. 1985; 83:546–609.
3. Ellis E 3rd, Tan Y. Assessment of internal orbital reconstructions for pure blowout fractures: cranial bone grafts versus titanium mesh. J Oral Maxillofac Surg. 2003; 61:442–53.

4. Burres SA, Cohn AM, Mathog RH. Repair of orbital blowout abdominal with Marlex mesh and Gelfilm. Laryngoscope. 1981; 91:1881–6.
5. Gellrich NC, Schramm A, Hammer B, et al. Computer-assisted secondary reconstruction of unilateral posttraumatic orbital deformity. Plast Reconstr Surg. 2002; 110:1417–29.
6. Jansen J, Schreurs R, Dubois L, et al. Orbital volume analysis: abdominal of a semi-automatic software segmentation method. Int J Comput Assist Radiol Surg. 2016; 11:11–8.
7. Deveci M, Oztürk S, Sengezer M, Pabuş cu Y. Measurement of abdominal volume by a 3-dimensional software program: an Experimental Study. J Oral Maxillofac Surg. 2000; 58:645–8.
8. Koppel DA, Foy RH, McCaul JA, et al. The reliability of “Analyze” software in measuring orbital volume utilizing CT-de-rived data. J Craniomaxillofac Surg. 2003; 31:88–91.
9. Regensburg NI, Kok PH, Zonneveld FW, et al. A new and validated CT-based method for the calculation of orbital soft tissue volumes. Invest Ophthalmol Vis Sci. 2008; 49:1758–62.
10. Choi JH, Park IK, Choi SJ, Shin JH. Measurement of orbital abdominal from facial CT scans using a semi-automatic computer program. J Korean Ophthalmol Soc. 2015; 56:168–73.
11. Ye J, Kook KH, Lee SY. Evaluation of computer-based volume measurement and porous polyethylene channel implants in abdominal of large orbital wall fractures. Invest Ophthalmol Vis Sci. 2006; 47:509–13.
12. Forbes G, Gorman CA, Gehring D, Baker HL Jr. Computer abdominal of orbital fat and muscle volumes in Graves ophthalmopathy. AJNR Am J Neuroradiol. 1983; 4:737–40.
13. Trokel SL, Jakbiec FA. Correlation of CT scanning and pathologic features of ophthalmic Graves' disease. Ophthalmology. 1981; 88:553–64.
14. Xi W, Perdanasari AT, Ong Y, et al. Objective breast volume, shape and surface area assessment: a systematic review of breast abdominal methods. Aesthetic Plast Surg. 2014; 38:1116–30.
15. Kwon J, Barrera JE, Most SP. Comparative computation of orbital volume from axial and coronal CT using three-dimensional image analysis. Ophthal Plast Reconstr Surg. 2010; 26:26–9.
16. Bite U, Jackson IT, Forbes GS, Gehring DG. Orbital volume abdominals in enophthalmos using three-dimensional CT imaging. Plast Reconst Surg. 1985; 75:502–8.
17. Frericks BB, Caldarone FC, Nashan B, et al. 3D CT modeling of hepatic vessel architecture and volume calculation in living do-nated liver transplantation. Eur Radiol. 2004; 14:326–33.
18. Hori M, Suzuki K, Epstein ML, Baron RL. Computed tomography liver volumetry using 3-dimensional image data in living donor liver transplantation: effects of the slice thickness on the volume calculation. Liver Transpl. 2011; 17:1427–36.
19. Reiner CS, Karlo C, Petrowsky H, et al. Preoperative liver abdominal: how does the slice thickness influence the multidetector abdominal tomography- and magnetic resonance-liver volume abdominals? J Comput Assist Tomogr. 2009; 33:390–7.
20. Berthelet E, Liu M, Truong P, et al. CT slice index and thickness: impact on organ contouring in radiation treatment planning for prostate cancer. J Appl Clin Med Phys. 2003; 4:365–73.
21. Winer-Muram HT, Jennings SG, Meyer CA, et al. Effect of varying CT section width on volumetric measurement of lung tumors and application of compensatory equations. Radiology. 2003; 229:184–94.
22. Petrou M, Quint LE, Nan B, Baker LH. Pulmonary nodule abdominal measurement variability as a function of CT slice thickness and nodule morphology. AJR Am J Roentgenol. 2007; 188:306–12.
23. Jurij RB, Frederick AJ. Embryology and Anatomy of the Orbit and Lacrimal System. Tasman W, Jaeger EA, editors. Duane's Ophthalmology. Philadelphia: Lippincott Williams & Wilkins;2007. chap. 32.
24. Kim TH, Jun HS, Byun YJ. The normal value of adult Korean abdominal volume in three-dimensional computerized tomography. J Korean Ophthalmol Soc. 2001; 42:1011–5.
Go to :
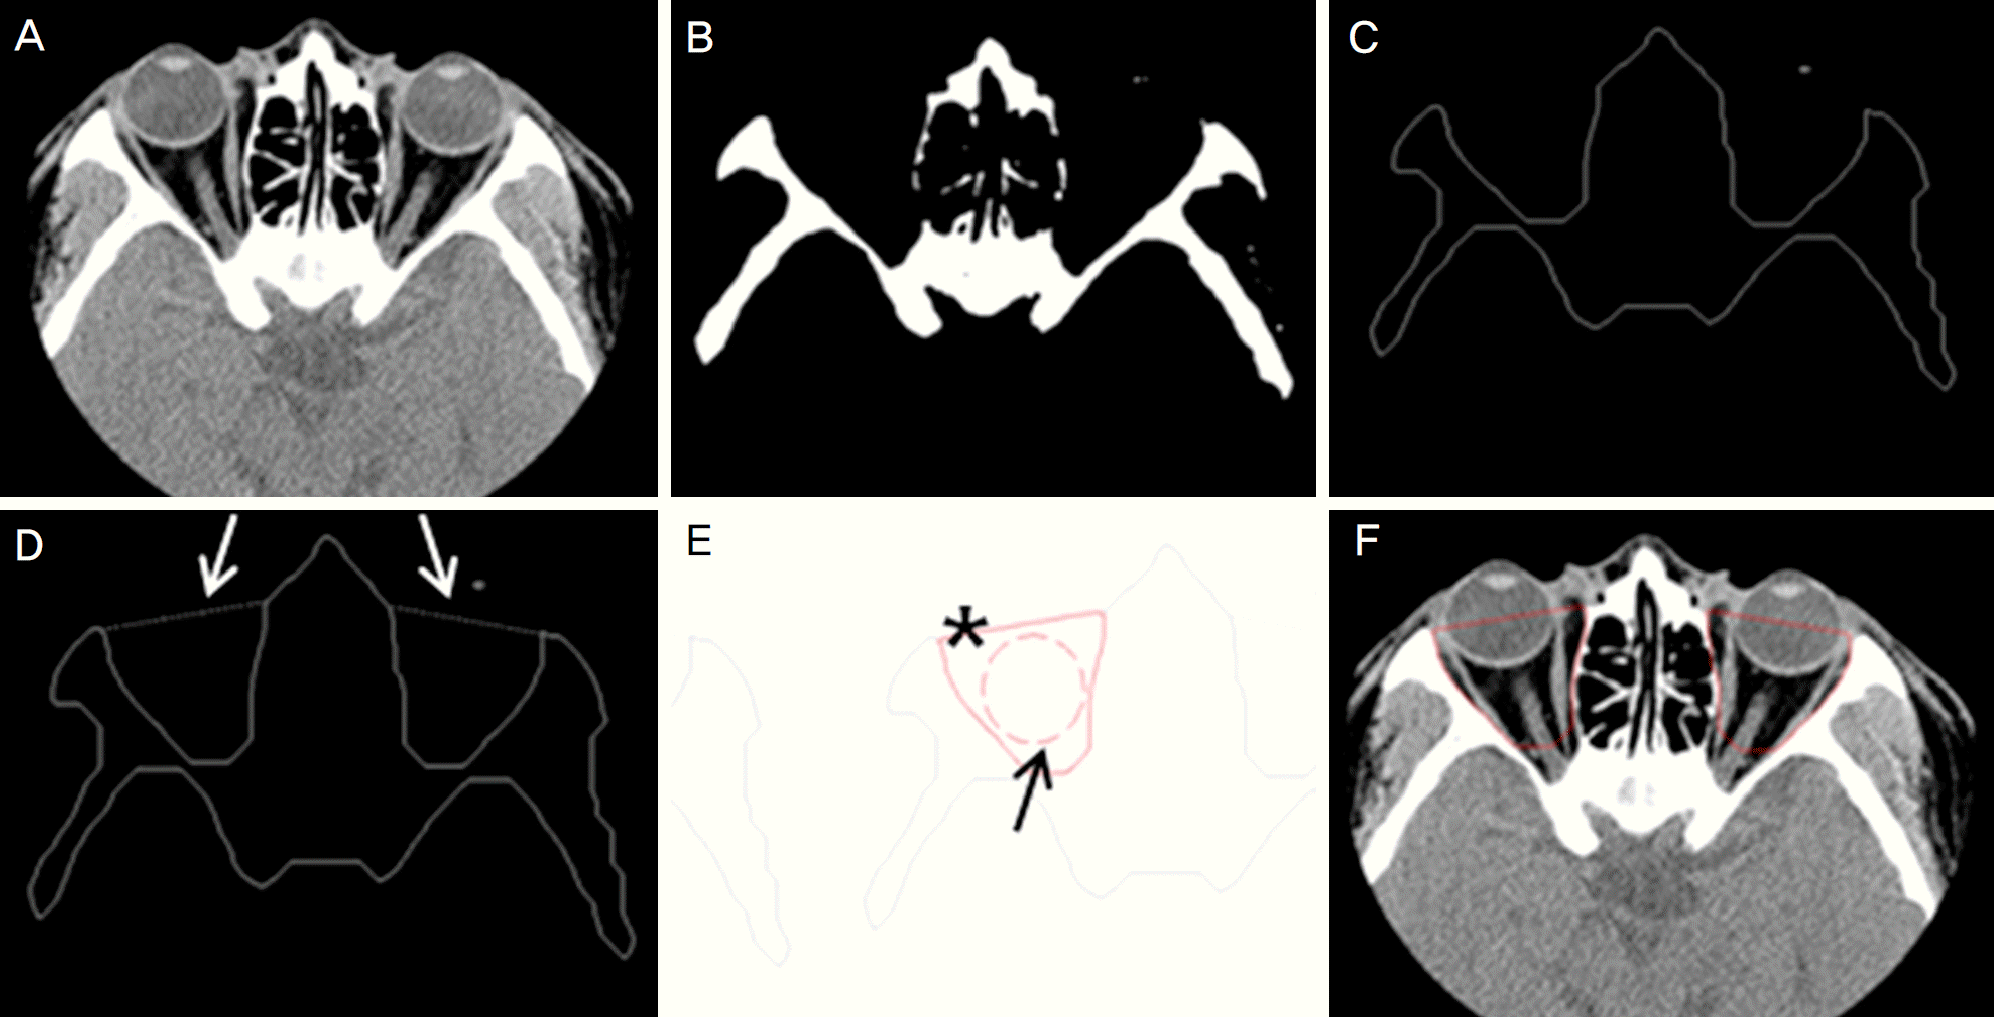 | Figure 1.Volume measurement process of the computer program from axial scans images. (A) The original computed tomography (CT) axial scan image. (B) Simplified the photograph by the algorithm of the computer program. (C) Automatic outlining the bony orbit. (D) The white arrows indicate the straight line drawn by examiner. (E) Black arrow mark the seed points and asterisks (*) indicate the automated outlining region. (F) Red solid line in the original CT image indicated the measured region. |
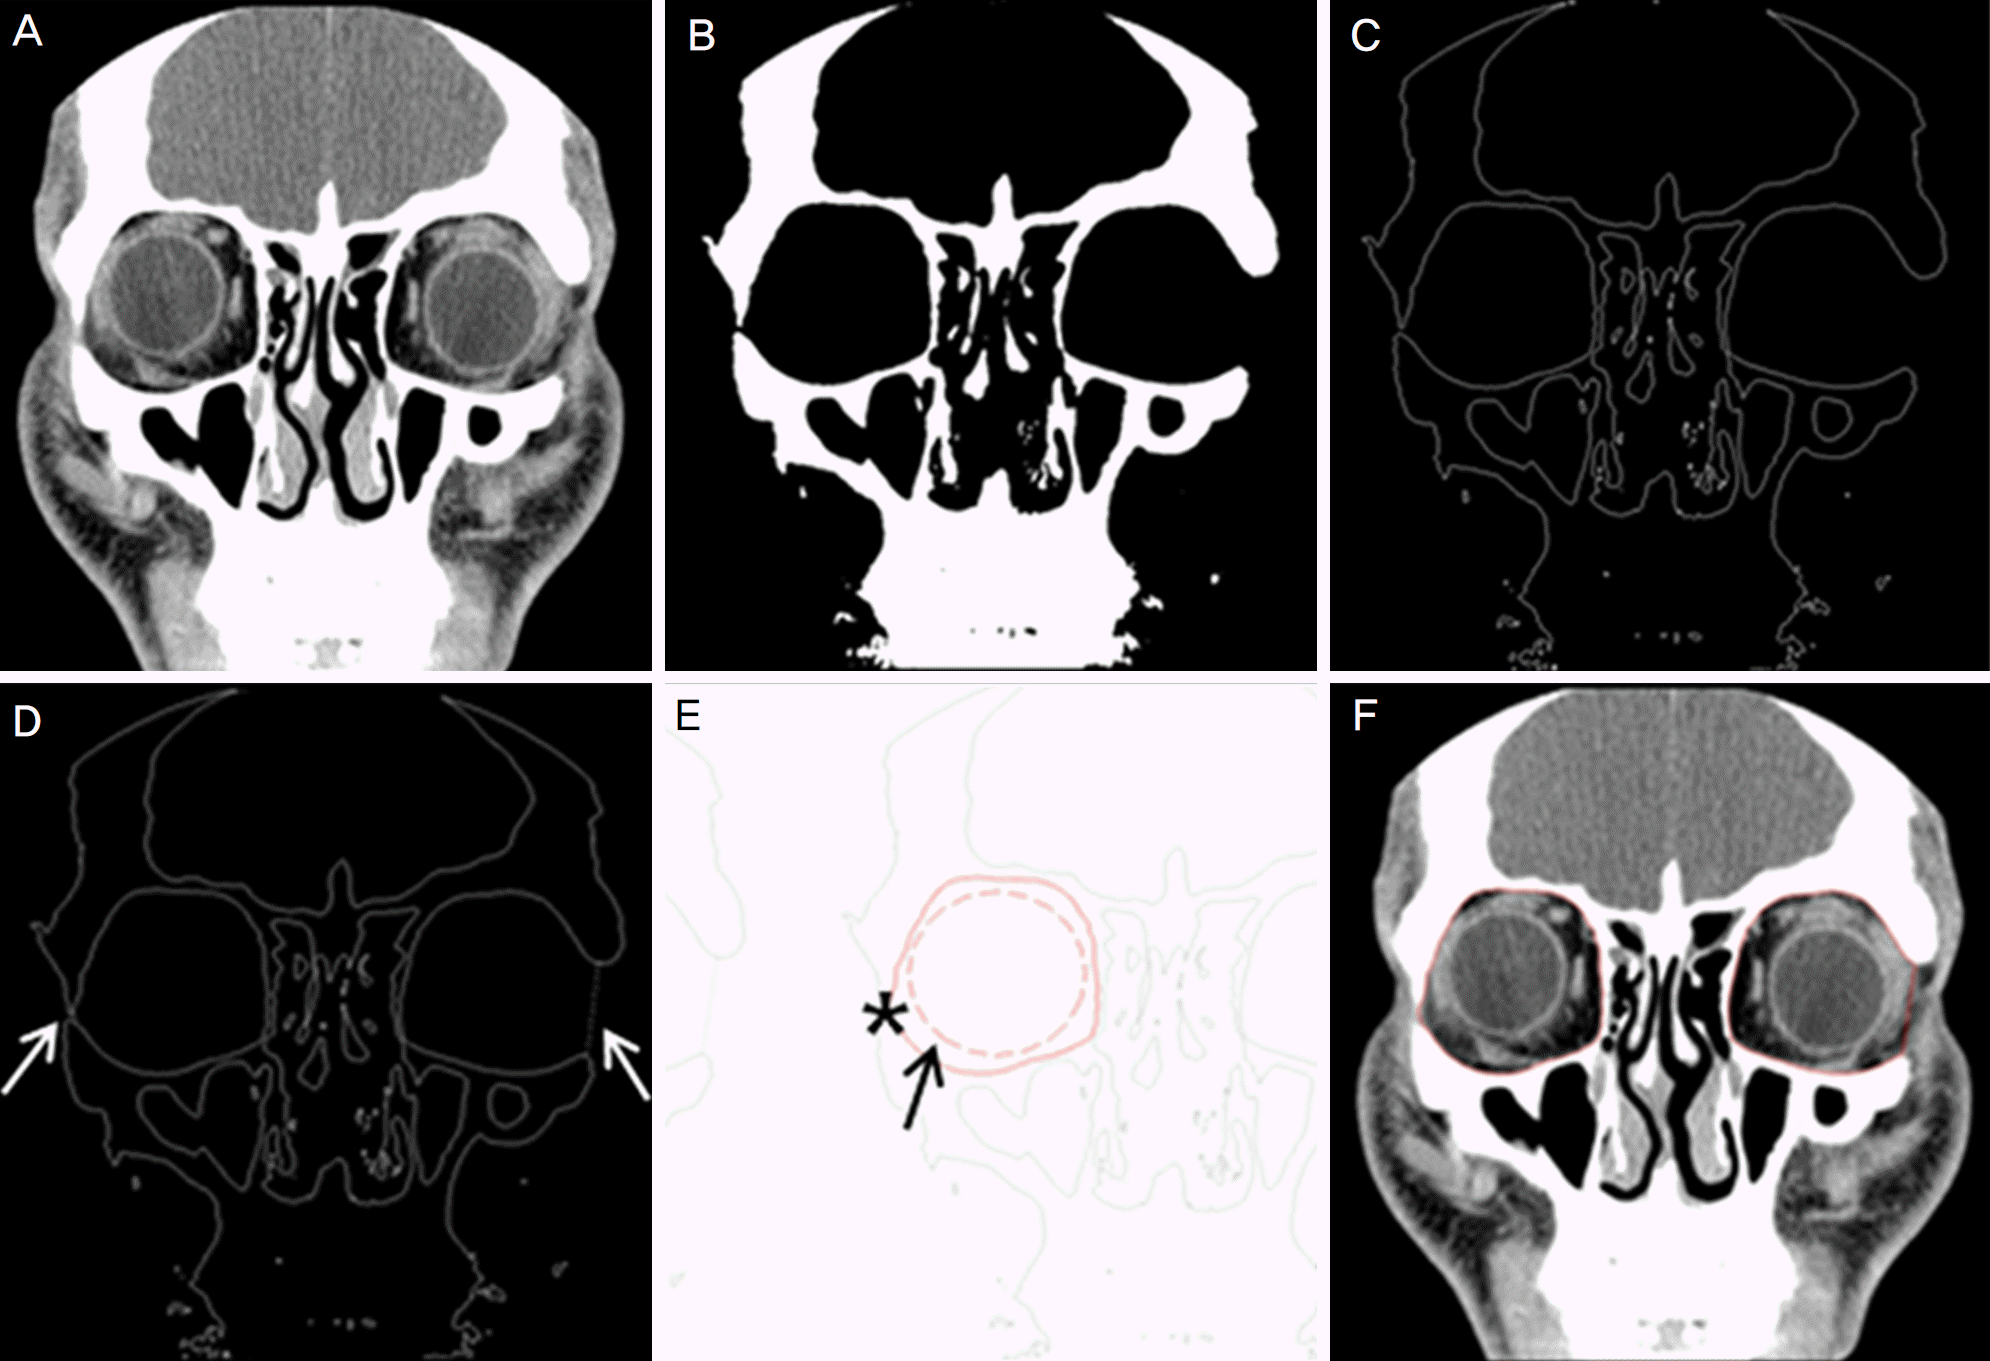 | Figure 2.Volume measurement process of the computer program from coronal scans images. (A) The original computed tomography (CT) coronal scan image. (B) Simplified the photograph by the algorithm of the computer program. (C) Automatic outlining the bony orbit. (D) The white arrows indicate the straight line drawn by examiner. (E) Black arrow mark the seed points and asterisks (*) indicate the automated outlining region. (F) Red solid line in the original CT image indicated the measured region. |
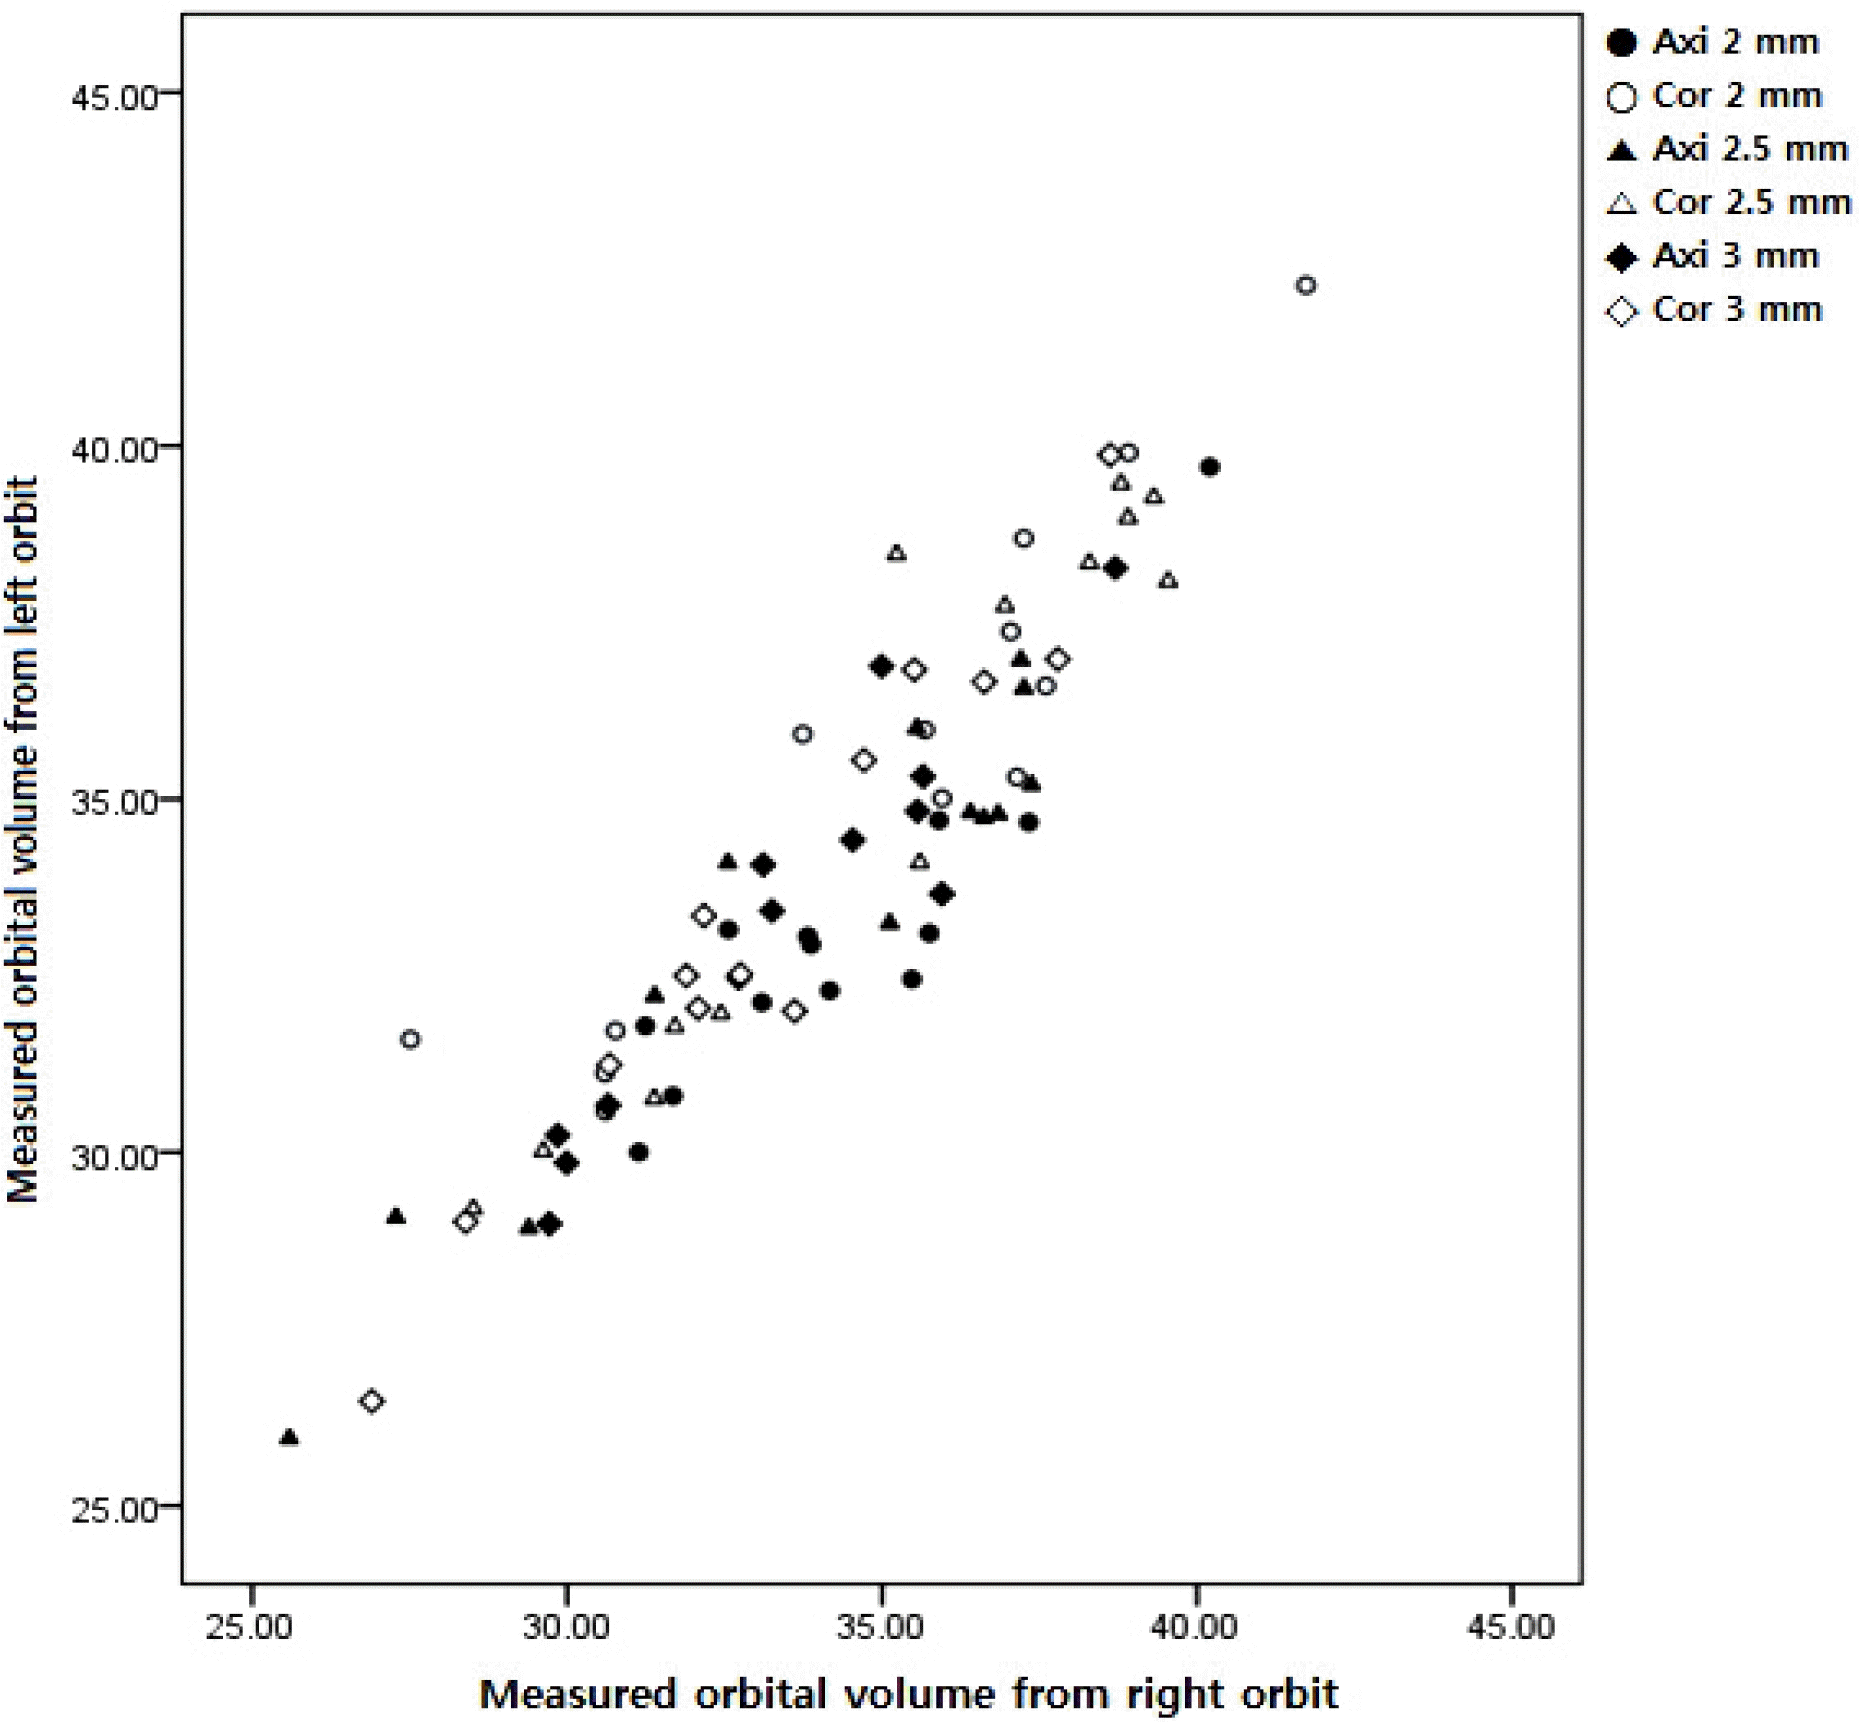 | Figure 3.The correlation of measured orbital volume from right orbit with from left orbit. There is a strong positive correlation between measured orbital volume from right orbit and left orbit. The correlation coefficients are +0.9. r Axi 2mm = 0.913, r Cor 2mm = 0.965, r Axi 2.5mm = 0.903, r Cor 2.5mm = 0.912, r Axi 3mm = 0.984, rCor 3mm = 0.943. |
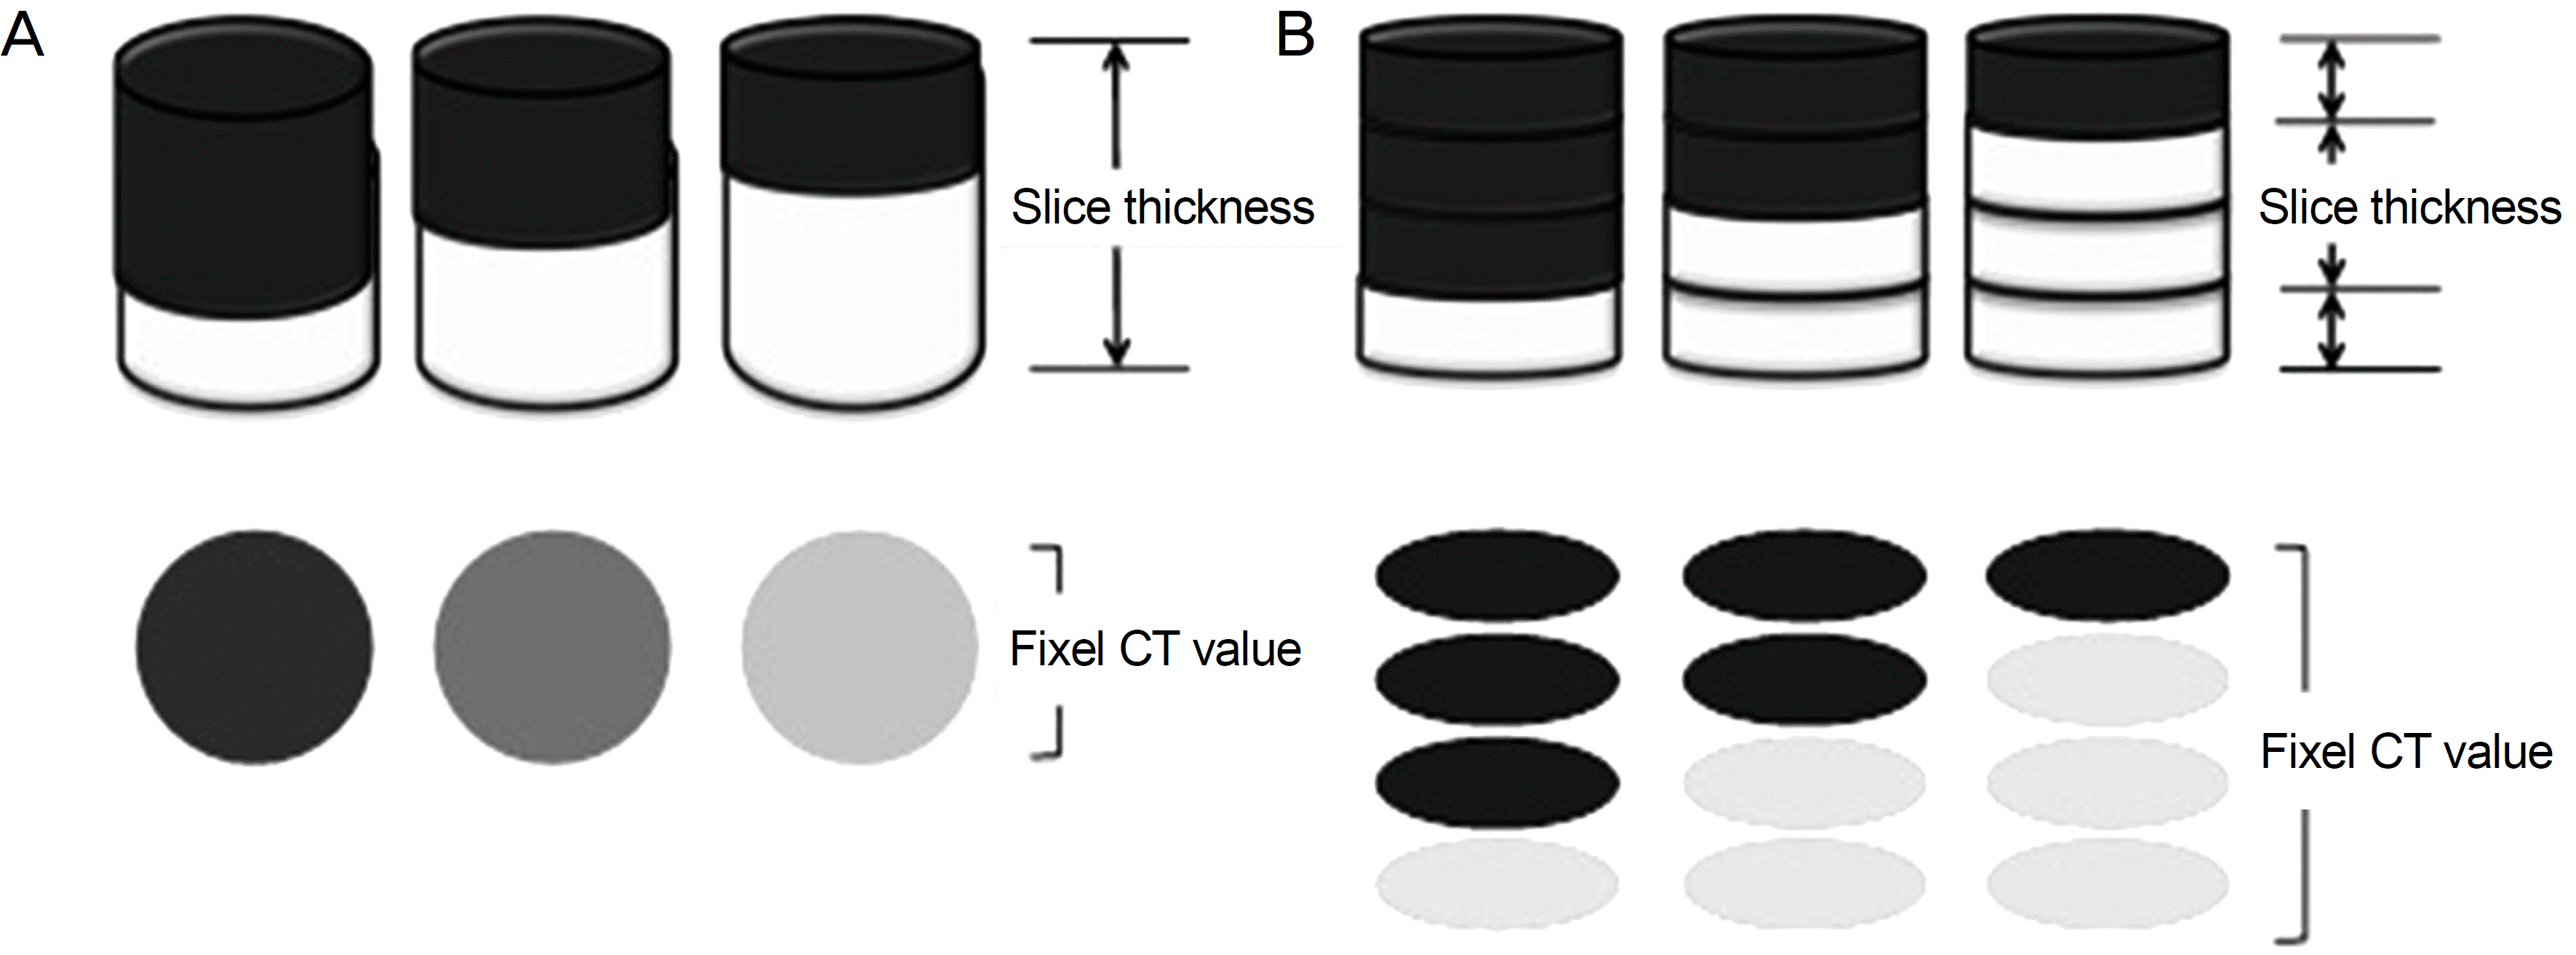 | Figure 4.Diagram of partial volume effect. (A) Pixel computed tomography (CT) value with thick slice. (B) Pixel CT value with thin slice. The partial volume effect can be defined as the loss of apparent activity in small objects or regions because of the limited resolution of the imaging system. |
Table 1.
Comparison of the right and left orbit volume (cm3)
|
2.0 mm thickness |
2.5 mm thickness |
3.0 mm thickness |
||||
|---|---|---|---|---|---|---|
| Axial | Coronal | Axial | Coronal | Axial | Coronal | |
| Right orbit | 33.14 ± 2.37 | 35.54 ± 3.58 | 33.28 ± 3.35 | 35.24 ± 3.98 | 33.23 ± 2.70 | 33.20 ± 3.64 |
| Left orbit | 34.32 ± 2.60 | 34.96 ± 4.05 | 33.73 ± 4.10 | 35.10 ± 3.93 | 33.39 ± 2.69 | 32.95 ± 3.45 |
| p-value* | 0.002 | 0.189 | 0.257 | 0.670 | 0.527 | 0.302 |
Table 2.
Difference in measured volume (cm3) between axial and coronal scan
| 2.0 mm thickness | 2.5 mm thickness | 3.0 mm thickness | p-value† | |
|---|---|---|---|---|
| Axial scan | 33.73 ± 2.51 | 33.50 ± 3.67 | 33.31 ± 2.65 | 0.87 |
| Coronal scan | 35.25 ± 3.76 | 35.17 ± 3.88 | 33.08 ± 3.48 | 0.05 |
| p-value* | 0.025 | 0.013 | 0.62 |
 XML Download