Abstract
Purpose
To compare the accuracy and clinical usefulness of different devices by measuring anterior chamber depth (ACD) with three devices and central corneal thickness (CCT) with four devices.
Methods
In 180 eyes of 90 healthy subjects, ACD was measured using A-scan, Lenstar LS900®, Pentacam®, and CCT was measured using ultrasound pachymetry (USP), Lenstar LS900®, Pentacam®, and anterior segment optical coherence tomography (OCT).
Results
The average ACT measurements using Lenstar LS900®, A-scan, and Pentacam® were 3.27 ± 0.35 mm, 3.26 ± 0.36 mm, and 3.25 ± 0.36 mm, respectively. The measurements were significantly correlated (p < 0.001) but without statistically significant difference (p = 0.017). The Bland-Altman plots showed a low degree of agreement. The average CCT measurements using Pentacam®, USP, Lenstar LS900®, and OCT were 553.31 ± 25.23 μ m, 547.26 ± 23.83 μ m, 541.38 ± 24.49 μ m, and 531.40 ± 22.33 μ m, respectively. The measurements were significantly correlated (p < 0.001) and statistically significantly different (p < 0.05). The Bland-Altman plots showed a low degree of agreement.
Go to : 
References
1. Reddy AR, Pande MV, Finn P, El-Gogary H. Comparative estimation of anterior chamber depth by ultrasonography, Orbscan II, and IOLMaster. J Cataract Refract Surg. 2004; 30:1268–71.

2. Vetrugno M, Cardascia N, Cardia L. Anterior chamber depth abdominal by two methods in myopic and hyperopic phakic IOL implant. Br J Ophthalmol. 2000; 84:1113–6.
3. Huang J, Pesudovs K, Wen D, et al. Comparison of anterior abdominal measurements with rotating Scheimpflug photography and partial coherence reflectometry. J Cataract Refract Surg. 2011; 37:341–8.
4. Oʼ Donnell C, Hartwig A, Radhakrishnan H. Comparison of central corneal thickness and anterior chamber depth measured using LenStar LS900, Pentacam, and Visante AS-OCT. Cornea. 2012; 31:983–8.
5. Uçakhan OÖ, Akbel V, Bı yı klı Z, Kanpolat A. Comparison of abdominal curvature and anterior chamber depth measurements using the manual keratometer, Lenstar LS 900 and the Pentacam. Middle East Afr J Ophthalmol. 2013; 20:201–6.
6. Elbaz U, Barkana Y, Gerber Y, et al. Comparison of different abdominals of anterior chamber depth and keratometric measurements. Am J Ophthalmol. 2007; 143:48–53.
7. Tappeiner C, Rohrer K, Frueh BE, et al. Clinical comparison of biometry using the non-contact optical low coherence reflectometer (Lenstar LS 900) and contact ultrasound biometer (Tomey AL-3000) in cataract eyes. Br J Ophthalmol. 2010; 94:666–7.

8. Gursoy H, Sahin A, Basmak H, et al. Lenstar versus ultrasound for ocular biometry in a pediatric population. Optom Vis Sci. 2011; 88:912–9.

9. Borrego-Sanz L, Sáenz-Francés F, Bermudez-Vallecilla M, et al. Agreement between central corneal thickness measured using Pentacam, ultrasound pachymetry, specular microscopy and optic biometer Lenstar LS 900 and the influence of intraocular pressure. Ophthalmologica. 2014; 231:226–35.

10. Tai LY, Khaw KW, Ng CM, Subrayan V. Central corneal thickness measurements with different imaging devices and ultrasound pachymetry. Cornea. 2013; 32:766–71.

11. Bechmann M, Thiel MJ, Neubauer AS, et al. Central corneal thickness measurement with a retinal optical coherence tomography device versus standard ultrasonic pachymetry. Cornea. 2001; 20:50–4.

12. Kim HY, Budenz DL, Lee PS, et al. Comparison of central corneal thickness using anterior segment optical coherence tomography vs ultrasound pachymetry. Am J Ophthalmol. 2008; 145:228–32.

13. Leung DY, Lam DK, Yeung BY, Lam DS. Comparison between central corneal thickness measurements by ultrasound pachymetry and optical coherence tomography. Clin Experiment Ophthalmol. 2006; 34:751–4.

14. Bland JM, Altman DG. Statistical methods for assessing abdominal between two methods of clinical measurement. Lancet. 1986; 1:307–10.
15. Bland JM, Altman DG. Measurement error. BMJ. 1996; 313:744.
16. Savini G, Carbonelli M, Barboni P, Hoffer KJ. Repeatability of automatic measurements performed by a dual Scheimpflug analyzer in unoperated and post-refractive surgery eyes. J Cataract Refract Surg. 2011; 37:302–9.

17. Jasvinder S, Khang TF, Sarinder KK, et al. Agreement analysis of LENSTAR with other techniques of biometry. Eye (Lond). 2011; 25:717–24.

18. Rodrigues EB, Johanson M, Penha FM. Anterior segment abdominal with the cirrus optical coherence tomography. J Ophthalmol. 2012; 2012:806989.
19. Amano S, Honda N, Amano Y, et al. Comparison of central corneal thickness measurements by rotating Scheimpflug camera, abdominal pachymetry, and scanning-slit corneal topography. Ophthalmology. 2006; 113:937–41.
20. Azen SP, Burg KA, Smith RE, Maguen E. A comparison of three methods for the measurement of corneal thickness. Invest Ophthalmol Vis Sci. 1979; 18:535–8.
Go to : 
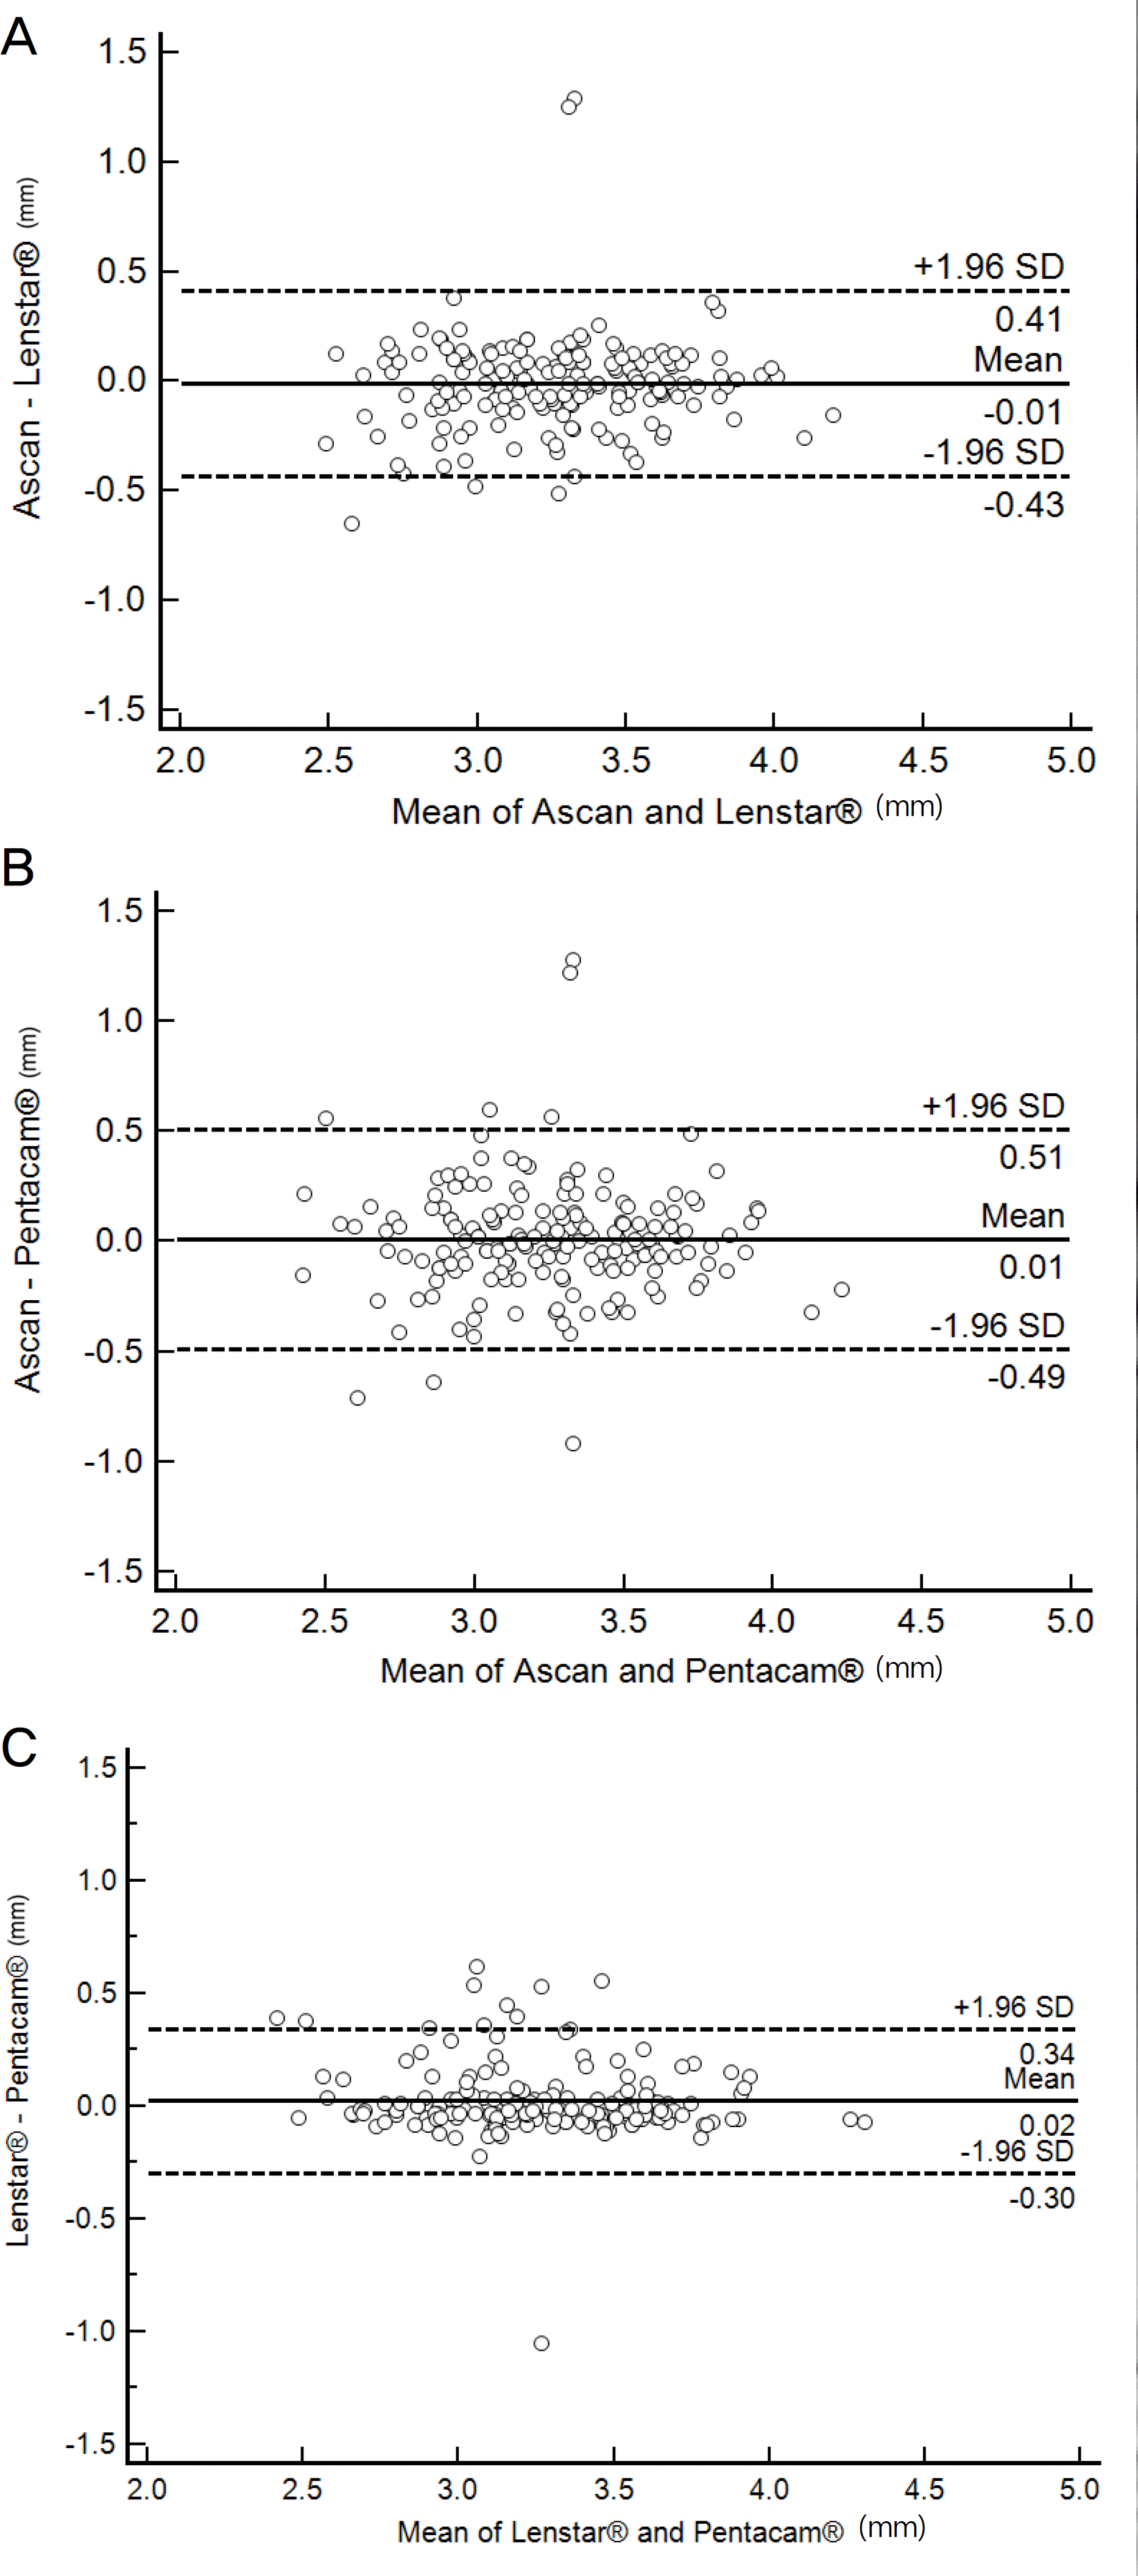
 | Figure 1.Bland and Altman plots comparing the level of agreement between the 3 instruments for anterior chamber depth (ACD, mm). (A) A-scan and Lentar LS900®, (B) Ascan and Pentacam®, (C) Lenstar® and Pentacam®. SD = standard deviation. |
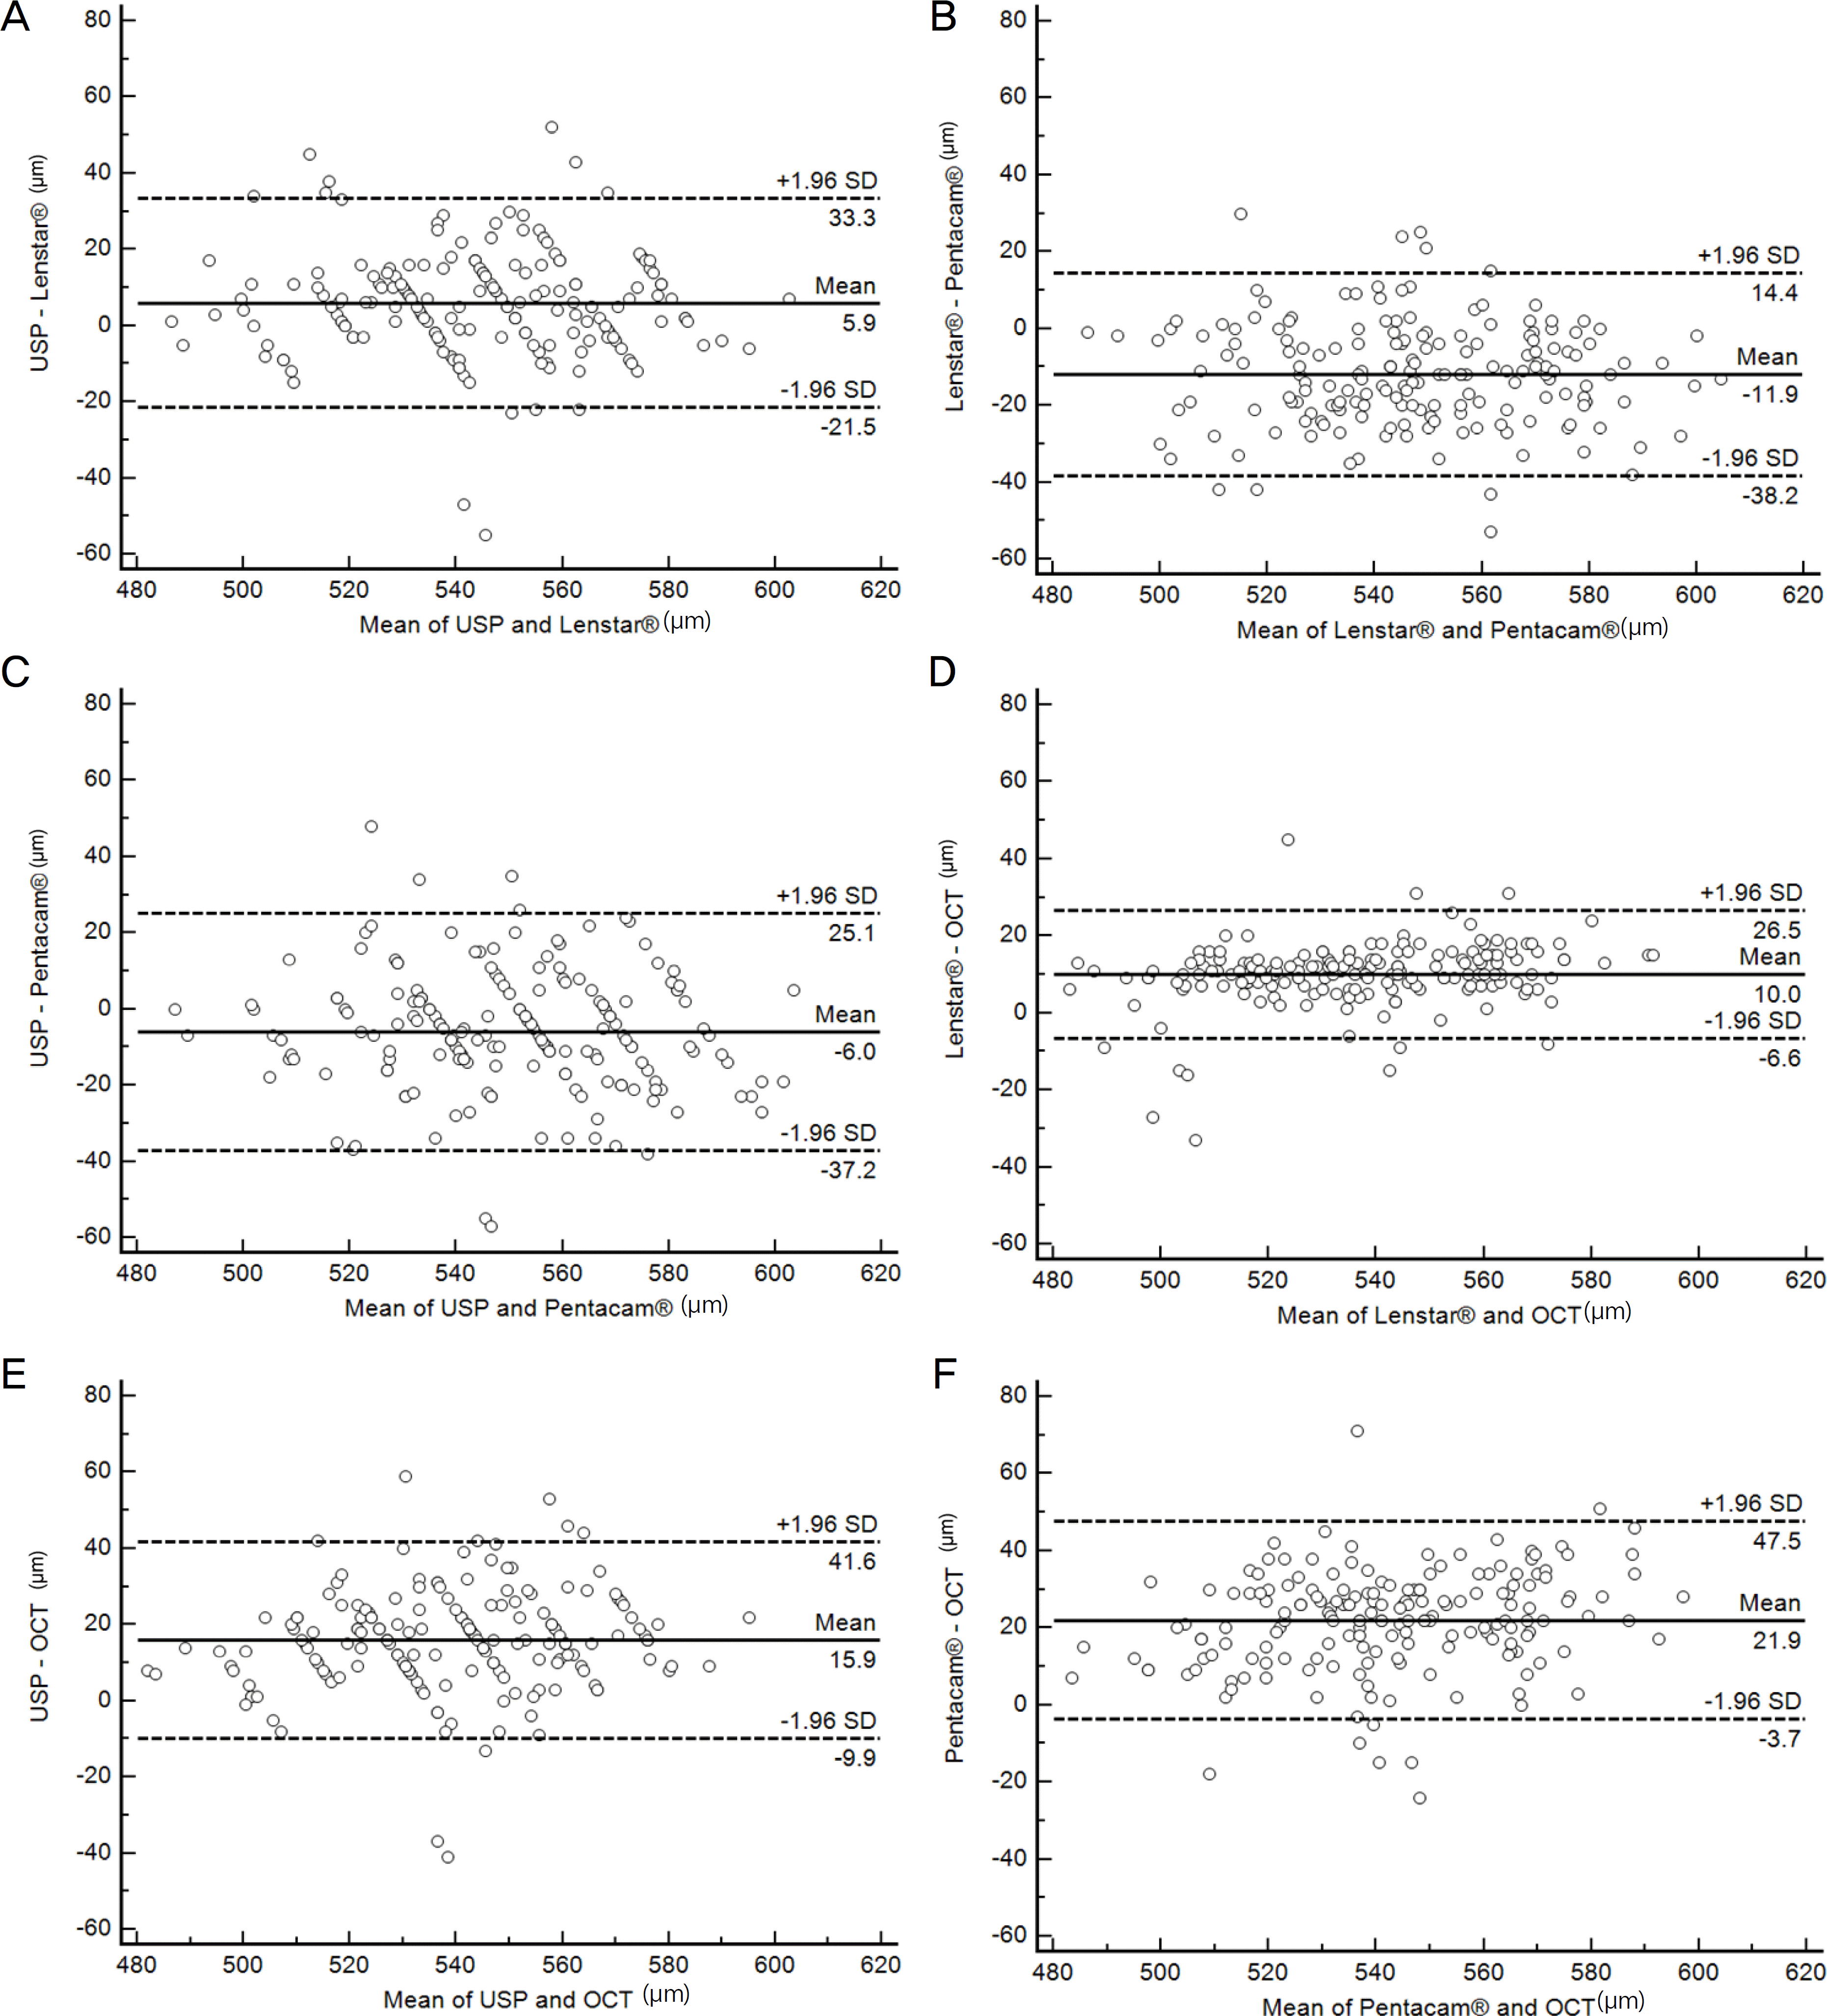
 | Figure 2.Bland and Altman plots comparing the level of agreement between the 4 instruments for central corneal thickness (CCT, μ m). (A) Ultrasound pachymetry (USP) and Lenstar LS900, (B) USP and Pentacam, (C) USP and anterior optical coherence tomography (OCT), (D) Lenstar and Pentacam, (E) Lenstar and anterior OCT, (F) Pentacam and anterior OCT. SD = standard deviation. |
Table 1.
Comparison of mean anterior chamber depth among devices
| A-scan | Lenstar LS900® | Pentacam® | p-value* | |
|---|---|---|---|---|
| Mean ACD (mm) | 3.26 ± 0.36 | 3.27 ± 0.35 | 3.25 ± 0.36 | 0.170 |
| Range (mm) | 2.25–4.12 | 2.46–4.27 | 2.22–4.34 |
Table 2.
Mean difference, 95% limit of agreement (LoA), and Pearson correlation of anterior chamber depth
| Mean difference ± SD | p-value* | 95% LoA | Pearson correlation | n p-value† | |
|---|---|---|---|---|---|
| A-scan– Lenstar® (mm) | –0.01 ± 0.22 | 1.000 | –0.43 to 0.41 | 0.816 | <0.001 |
| A-scan– Pentacam® (mm) | 0.01 ± 0.26 | 0.204 | –0.49 to 0.51 | 0.753 | <0.001 |
| Lenstar®– Pentacam® (mm) | 0.02 ± 0.16 | 1.000 | –0.30 to 0.34 | 0.897 | <0.001 |
Table 3.
Comparison of mean central corneal thickness among devices
| USP | Lenstar® | Pentacam® | AS-OCT | p-value* | |
|---|---|---|---|---|---|
| Mean CCT (μ m) | 547.26 ± 23.83 | 541.38 ± 24.49 | 553.31 ± 25.23 | 531.40 ± 22.33 | <0.05 |
| Range (μ m) | 486–606 | 485–599 | 487–611 | 478–584 |
Table 4.
Mean difference, 95% limit of agreement (LoA), and Pearson correlation of central corneal thickness
| Comparisons | Mean difference ± SD | p-value* | 95% LoA | Pearson correlation | p-value† |
|---|---|---|---|---|---|
| USP– Lenstar® (μ m) | 5.9 ± 27.4 | 0.000 | –21.5 to 33.3 | 0.833 | <0.001 |
| USP– Pentacam® (μ m) | –6.0 ± 31.1 | 0.000 | –37.2 to 25.1 | 0.792 | <0.001 |
| USP– AS-OCT (μ m) | 15.9 ± 25.7 | 0.000 | –9.9 to 41.6 | 0.840 | <0.001 |
| Lenstar®– Pentacam® (μ m) | –11.9 ± 26.3 | 0.000 | –38.2 to 14.4 | 0.855 | <0.001 |
| Lenstar®– AS-OCT (μ m) | 10.0 ± 16.5 | 0.000 | –6.6 to 26.5 | 0.939 | <0.001 |
| Pentacam®– AS-OCT (μ m) | 21.9 ± 25.6 | 0.000 | –3.7 to 47.5 | 0.856 | <0.001 |


 PDF
PDF ePub
ePub Citation
 Print
Print


 XML Download