

 PDF
PDF ePub
ePub Citation
 Print
Print


Abstract
Purpose
To compare the incidence of posterior capsular opacification (PCO) based on low and high fluid-dynamic parameters during cataract surgery and evaluate the importance of these findings.
Methods
This retrospective study included 125 eyes in 73 patients with senile cataract who received a cataract surgery between September 2013 and March 2014. Patients were divided into 2 groups: those with low (vacuum: 180 mm Hg, aspiration flow: 18 mL/min, bottle height: 55 cm) and high (vacuum: 400 mm Hg, aspiration flow: 22 mL/min, bottle height: 90 cm) fluidic parameters during the nucleus was removal. We measured the total surgery time, ultrasound time, and balanced salt solution consumption during phacoemulsification. Best corrected visual acuity (BCVA), PCO score, PCO percentage and severity were measured at 3, 6 and 12 months postoperatively. Endothelial cell density (ECD) was measured preoperatively and 12 months postoperatively.
Results
The study included 20 eyes of 13 patients with low parameters and 20 eyes of 15 patients with high parameters. There was no statistically significant difference in the mean total surgery time, ultrasound time or fluid consumption between the two groups. BCVA and ECD were not significantly different between the two groups during the postoperative follow-up. PCO score, percentage and severity were higher in the low parameter group at 3, 6 and 12 months postoperatively.
Conclusions
Surgery with low fluid-dynamic parameters is equally effective as with high parameters in terms of surgical time and postoperative BCVA. However, the incidence of PCO was higher in the low fluid-dynamic parameter group up to 12 months. Surgical efforts to reduce remnant lens epithelial cells are needed during low fluidic-dynamic parameter surgery.
References
1. Kelman CD. The history and development of phacoemulsification. Int Ophthalmol Clin. 1994; 34:1–12.

2. Fine IH, Packer M, Hoffman RS. Power modulations in new abdominal technology: improved outcomes. J Cataract Refract Surg. 2004; 30:1014–9.
3. Vasavada AR, Raj S. Step-down technique. J Cataract Refract Surg. 2003; 29:1077–9.
4. Ward MS, Georgescu D, Olson RJ. Effect of bottle height and aspiration rate on postocclusion surge in Infiniti and Millennium peri-staltic phacoemulsification machines. J Cataract Refract Surg. 2008; 34:1400–2.
5. Heo WJ, Lee JY, Kim HK. Comparison of clinical outcomes abdominal high and low fluid-dynamic parameters during phacoemulsification. J Korean Ophthalmol Soc. 2015; 56:1860–6.
6. Oh TH, Lee SJ, Kim HS. Clinical outcomes of cataract surgery abdominal torsional mode phacoemulsification and soft shell technique. J Korean Ophthalmol Soc. 2009; 50:1313–8.
7. Lee JE, Choi SH. Comparison of clinical results between ellips and ozil modes in phacoemulsification. J Korean Ophthalmol Soc. 2011; 52:1161–6.
8. Awasthi N, Guo S, Wagner BJ. Posterior capsular opacification: a problem reduced but not yet eradicated. Arch Ophthalmol. 2009; 127:555–62.
9. Apple DJ, Peng Q, Visessook N, et al. Eradication of posterior abdominal opacification: documentation of a marked decrease in Nd:YAG laser posterior capsulotomy rates noted in an analysis of 5416 pseudophakic human eyes obtained postmortem. Ophthalmology. 2001; 108:505–18.
10. Nishi O, Nishi K, Sakka Y, et al. Intercapsular cataract surgery with lens epithelial cell removal. Part IV: Capsular fibrosis induced by poly(methyl methacrylate). J Cataract Refract Surg. 1991; 17:471–7.
11. Sterling S, Wood TO. Effect of intraocular lens convexity on abdominal capsule opacification. J Cataract Refract Surg. 1986; 12:655–7.
12. Born CP, Ryan DK. Effect of intraocular lens optic design on abdominal capsular opacification. J Cataract Refract Surg. 1990; 16:188–92.
13. Legler UF, Apple DJ, Assia EI, et al. Inhibition of posterior capsule opacification: the effect of colchicine in a sustained drug delivery system. J Cataract Refract Surg. 1993; 19:462–70.
14. Power WJ, Neylan D, Collum LM. Daunomycin as an inhibitor of human lens epithelial cell proliferation in culture. J Cataract Refract Surg. 1994; 20:287–90.
15. Kim NE, Lee SJ, Park JM. Risk factors for development of abdominal capsule opacification after cataract surgery or combined abdominal surgery. J Korean Ophthalmol Soc. 2014; 55:1132–8.
16. Findl O, Buehl W, Siegl H, Pinz A. Removal of reflections in the photographic assessment of PCO by fusion of digital retro-illumination images. Invest Ophthalmol Vis Sci. 2003; 44:275–80.
17. Findl O, Buehl W, Menapace R, et al. Comparison of 4 methods for quantifying posterior capsule opacification. J Cataract Refract Surg. 2003; 29:106–11.
18. Camparini M, Macaluso C, Reggiani L, Maraini G. Retroillumination versus reflected-light images in the photographic abdominal of posterior capsule opacification. Invest Ophthalmol Vis Sci. 2000; 41:3074–9.
19. Bender L, Spalton DJ, Uyanonvara B, et al. POCOman: new abdominal for quantifying posterior capsule opacification. J Cataract Refract Surg. 2004; 30:2058–63.
20. Barman SA, Hollick EJ, Boyce JF, et al. Quantification of posterior capsular opacification in digital images after cataract surgery. Invest Ophthalmol Vis Sci. 2000; 41:3882–92.
21. Wong T, Hingorani M, Lee V. Phacoemulsification time and power requirements in phaco chop and divide and conquer nucleofractis techniques. J Cataract Refract Surg. 2000; 26:1374–8.
22. Verges C, Cazal J, Lavin C. Surgical strategies in patients with abdominal and glaucoma. Curr Opin Ophthalmol. 2005; 16:44–52.
23. Hayashi K, Hayashi H, Nakao F, Hayashi F. Risk factors for abdominal endothelial injury during phacoemulsification. J Cataract Refract Surg. 1996; 22:1079–84.
24. Faramarzi A, Javadi MA, Karimian F, et al. Corneal endothelial cell loss during phacoemulsification: bevel-up versus bevel-down phaco tip. J Cataract Refract Surg. 2011; 37:1971–6.
25. Osher RH. Slow motion phacoemulsification approach. J Cataract Refract Surg. 1993; 19:667.
26. Hayashi K, Yoshida M, Manabe S, Hirata A. Cataract surgery in eyes with low corneal endothelial cell density. J Cataract Refract Surg. 2011; 37:1419–25.
27. Wong MM, Shukla AN, Munir WM. Correlation of corneal abdominal and volume with intraoperative phacoemulsification parame-ters using Scheimpflug imaging and optical coherence tomography. J Cataract Refract Surg. 2014; 40:2067–75.
28. Walkow T, Anders N, Klebe S. Endothelial cell loss after abdominal: relation to preoperative and intraoperative parameters. J Cataract Refract Surg. 2000; 26:727–32.
29. Nixon DR. Preoperative cataract grading by Scheimpflug imaging and effect on operative fluidics and phacoemulsification energy. J Cataract Refract Surg. 2010; 36:242–6.
30. Vasavada AR, Praveen MR, Vasavada VA, et al. Impact of high and low aspiration parameters on postoperative outcomes of abdominal: randomized clinical trial. J Cataract Refract Surg. 2010; 36:588–93.
31. Cleary G, Spalton DJ, Hancox J, et al. Randomized intraindividual comparison of posterior capsule opacification between a abdominal intraocular lens and a conventional intraocular lens. J Cataract Refract Surg. 2009; 35:265–72.
32. Cheng CY, Yen MY, Chen SJ, et al. Visual acuity and contrast sen-sitivity in different types of posterior capsule opacification. J Cataract Refract Surg. 2001; 27:1055–60.
Figure 1.
Posterior capsular opacification (PCO) scoring by slit lamp derived reflected light photographs and retroillumination. ‘Grade 0’ means ‘PCO do not intrude the intraocular lens (IOL) edge’. ‘Grade 1’ means ‘PCO intrude less than half of IOL edge area and below the continuous curvilinear capsulorrhexis (CCC) margin’. ‘Grade 2’ means ‘PCO intrude more than half of IOL edge area and below the CCC margin’. ‘Grade 3’ means ‘PCO intrude the CCC margin but do not intrude visual axis’, and ‘Grade 4’ means ‘PCO intrude visual axis’. ‘Visual axis' means ‘3 mm from center of pupil’.
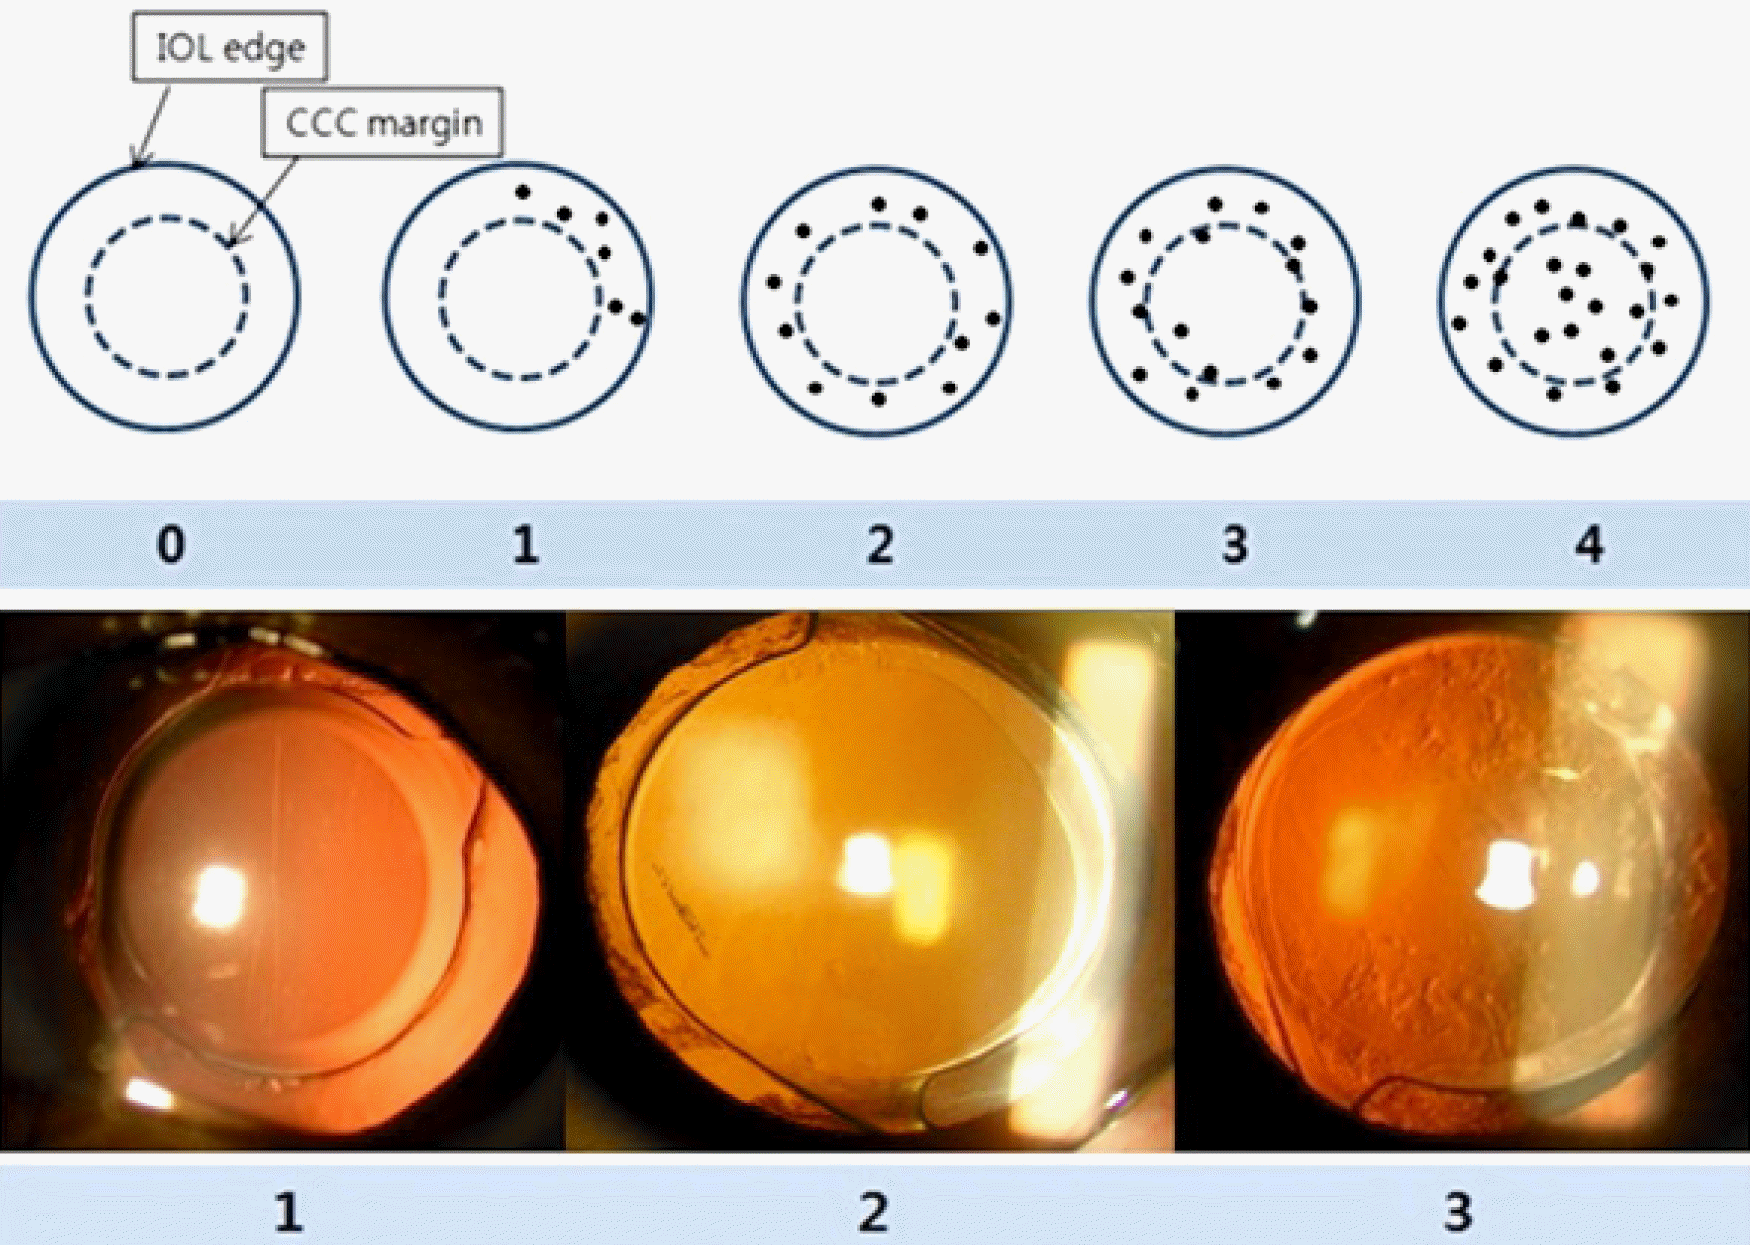
Table 1.
Patient baseline characteristics in low and high fluid-dynamic parameter group
| Characteristics | Low Group | High Group | p-value* |
|---|---|---|---|
| Eyes | 20 | 20 | |
| Age (years) | 68.71 ± 6.60 | 69.28 ± 6.25 | 0.421 |
| Gender (male:female) | 9:11 | 8:12 | |
| Lens opacity | |||
| Nuclear opalescence | 3.38 ± 0.72 | 3.43 ± 0.63 | 0.392 |
| Nuclear color | 3.47 ± 0.68 | 3.52 ± 0.75 | 0.434 |
| Cortical | 2.68 ± 1.25 | 2.37 ± 1.35 | 0.523 |
| Posterior subcapsular | 1.52 ± 0.98 | 1.76 ± 1.12 | 0.621 |
| BCVA (log MAR) | 0.29 ± 0.35 | 0.20 ± 0.19 | 0.874 |
| Endothelial cell density (cells/mm2) | 2512.78 ± 281.78 | 2,538.36 ± 309.69 | 0.832 |
Table 2.
Comparison of intraoperative parameters and outcomes
| Exam | Low Group (n = 20) | High Group (n = 20) | p-value* |
|---|---|---|---|
| Surgery time (seconds) | 495.59 ± 82.79 | 476.62 ± 68.52 | 0.254 |
| Ultrasound time (seconds) | 64.31 ± 18.07 | 56.78 ± 24.85 | 0.249 |
| Fluid consumption (mL) | 107.50 ± 28.21 | 117.81 ± 35.50 | 0.459 |
Table 3.
Comparison of postoperative BCVA
| BCVA | Low Group (n = 20) | High Group (n = 20) | p-value* |
|---|---|---|---|
| Preoperative | 0.29 ± 0.35 | 0.20 ± 0.19 | 0.873 |
| Postoperative | |||
| 3 months | 0.03 ± 0.01 | 0.02 ± 0.01 | 0.954 |
| 6 months | 0.05 ± 0.02 | 0.03 ± 0.01 | 0.932 |
| 12 months | 0.07 ± 0.02 | 0.05 ± 0.02 | 0.826 |
Table 4.
Preoperative and postoperative ECD and change in ECD
| ECD | Low Group (n = 20) | High Group (n = 20) | p-value* |
|---|---|---|---|
| Preoperative (cells/mm2) | 2,512.78 ± 281.78 | 2,538.36 ± 309.69 | 0.785 |
| Postoperative 12 months (cells/mm2) | 2,297.45 ± 268.87 | 2,316.87 ± 287.36 | 0.842 |
| Mean change (%)† | 7.79 ± 5.72 | 7.82 ± 4.89 | 0.674 |
Table 5.
Comparison of postoperative PCO score, percentage, and severity
| PCO | Low Group (n = 20) | High Group (n = 20) | p-value§ |
|---|---|---|---|
| PCO score* | |||
| Postop 3 m | 1.75 ± 0.62 | 1.00 ± 0.76 | 0.012 |
| Postop 6 m | 1.82 ± 0.54 | 1.05 ± 0.91 | 0.035 |
| Postop 12 m | 2.01 ± 0.55 | 1.23 ± 0.59 | 0.009 |
| PCO percentage† | |||
| Postop 3 m | 28.23 ± 6.24 | 19.90 ± 6.09 | <0.001 |
| Postop 6 m | 36.82 ± 5.08 | 27.48 ± 5.99 | 0.023 |
| Postop 12 m | 41.45 ± 7.30 | 36.45 ± 6.06 | 0.009 |
| PCO severity‡ | |||
| Postop 3 m | 0.29 ± 0.08 | 0.22 ± 0.07 | 0.031 |
| Postop 6 m | 0.35 ± 0.06 | 0.26 ± 0.04 | 0.048 |
| Postop 12 m | 0.40 ± 0.05 | 0.34 ± 0.04 | 0.043 |
 XML Download