Abstract
Purpose
To determine the frequency and potential causes of segmentation errors in spectral domain optical coherence tomography (SD-OCT) imaging of retinal nerve fiber layer (RNFL) scans.
Methods
Segmentation errors for the RNFL thickness analysis were recorded during a retrospective chart review of 214 eye scans from 132 consecutive patients with glaucoma or glaucoma suspect who underwent a complete eye exam using Spectralis™ OCT scanning from August 2014 to November 2014. Segmentation errors were classified as inner, outer, inner and outer segmentation errors, and degraded images. The risk factors including age, sex, intraocular pressure, spherical equivalents, severity of glaucoma, and associated ocular disorders were evaluated using logistic regression analysis.
Results
A total of 71 eye scans included segmentation errors. Risk factors of inner segmentation error (8.9%) were age, epiretinal membrane, and degenerative myopia. Risk factors of outer segmentation error (29.9%) were age, peripapillary atrophy, posterior vitreous detachment, and severity of glaucoma. Risk factors of inner and outer segmentation errors (6.1%) were age and degenerative myopia. The single risk factor of degraded image (2.3%) was degenerative myopia.
Go to : 
References
1. Quigley HA, Broman AT. The number of people with glaucoma worldwide in 2010 and 2020. Br J Ophthalmol. 2006; 90:262–7.

2. Hyman L, Wu SY, Connell AM, et al. Prevalence and causes of abdominal impairment in the Barbados Eye Study. Ophthalmology. 2001; 108:1751–6.
3. Gaasterland D, Tanishima T, Kuwabara T. Axoplasmic flow during chronic experimental glaucoma. 1. Light and electron microscopic studies of the monkey optic nervehead during development of glaucomatous cupping. Invest Ophthalmol Vis Sci. 1978; 17:838–46.
4. Quigley HA, Green WR. The histology of human glaucoma cupping and optic nerve damage: clinicopathologic correlation in 21 eyes. Ophthalmology. 1979; 86:1803–30.

5. Quigley HA, Addicks EM, Green WR, Maumenee AE. Optic nerve damage in human glaucoma. II. The site of injury and abdominal to damage. Arch Ophthalmol. 1981; 99:635–49.
6. Minckler DS, Bunt AH, Johanson GW. Orthograde and retrograde axoplasmic transport during acute ocular hypertension in the monkey. Invest Ophthalmol Vis Sci. 1977; 16:426–41.
7. Bellezza AJ, Rintalan CJ, Thompson HW, et al. Deformation of the lamina cribrosa and anterior scleral canal wall in early abdominal glaucoma. Invest Ophthalmol Vis Sci. 2003; 44:623–37.
8. Aref AA, Budenz DL. Spectral domain optical coherence abdominal in the diagnosis and management of glaucoma. Ophthalmic Surg Lasers Imaging. 2010; 41(Suppl):S15–27.

9. Chen TC, Cense B, Pierce MC, et al. Spectral domain optical abdominal tomography: ultra-high speed, ultra-high resolution ophthalmic imaging. Arch Ophthalmol. 2005; 123:1715–20.
10. Asrani S, Essaid L, Alder BD, Santiago-Turla C. Artifacts in abdominal-domain optical coherence tomography measurements in glaucoma. JAMA Ophthalmol. 2014; 132:396–402.
11. Liu Y, Simavli H, Que CJ, et al. Patient characteristics associated with artifacts in Spectralis optical coherence tomography imaging of the retinal nerve fiber layer in glaucoma. Am J Ophthalmol. 2015; 159:565–76.e2.

12. Mills RP, Budenz DL, Lee PP, et al. Categorizing the stage of abdominal from pre-diagnosis to end-stage disease. Am J Ophthalmol. 2006; 141:24–30.
13. Asrani S, Edghill B, Gupta Y, Meerhoff G. Optical coherence abdominal errors in glaucoma. J Glaucoma. 2010; 19:237–42.
14. Giani A, Cigada M, Esmaili DD, et al. Artifacts in automatic retinal segmentation using different optical coherence tomography instruments. Retina. 2010; 30:607–16.

15. Lee SY, Kwon HJ, Bae HW, et al. Frequency, type and cause of artifacts in swept-source and Cirrus HD optical coherence tomography in cases of glaucoma and suspected glaucoma. Curr Eye Res. 2016; 41:957–64.

16. Jonas JB, Nguyen XN, Gusek GC, Naumann GO. Parapapillary chorioretinal atrophy in normal and glaucoma eyes. I. Morphometric data. Invest Ophthalmol Vis Sci. 1989; 30:908–18.
17. Jonas JB, Naumann GO. Parapapillary chorioretinal atrophy in normal and glaucoma eyes. II. Correlations. Invest Ophthalmol Vis Sci. 1989; 30:919–26.
Go to : 
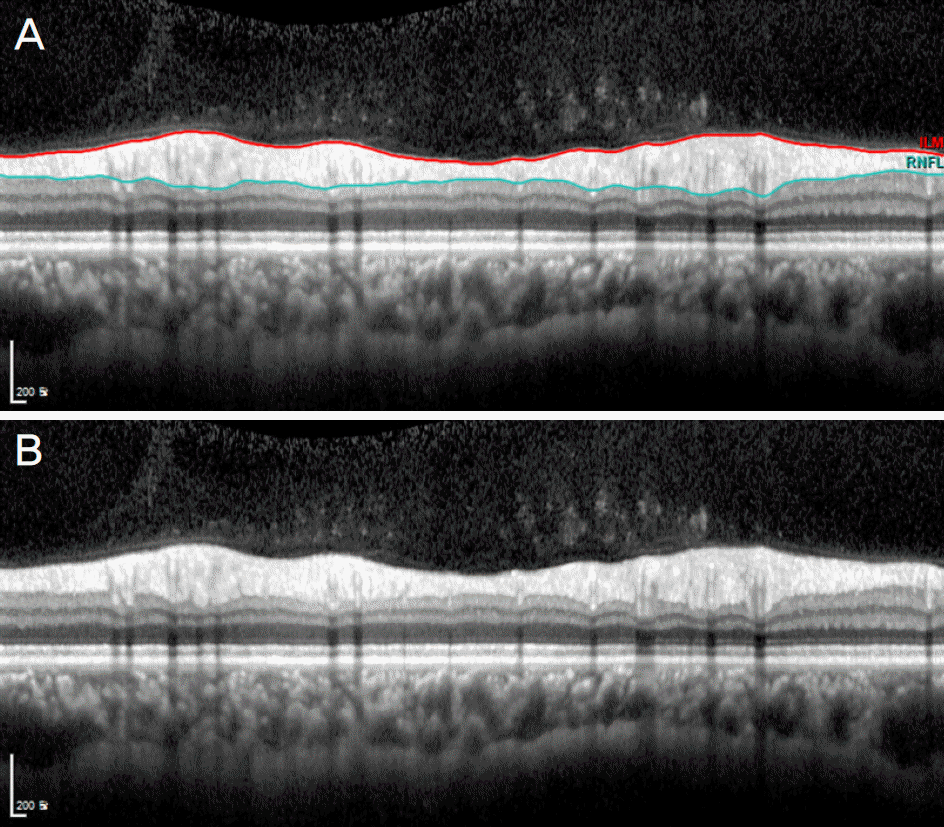
 | Figure 1.Optical coherence tomography. (A) Normalperipapillary retinal nerve fiber layer thickness (RNFL) profile automatically segmented in Spectralis optical coherence tomography. Inner line indicated as internal limiting membrane are located between vitreous and RNFL. Outer line indicated as RNFL are located between RNFL and ganglion cell layer. (B) Unsegmentednormal peripapillary RNFL thickness profile. |
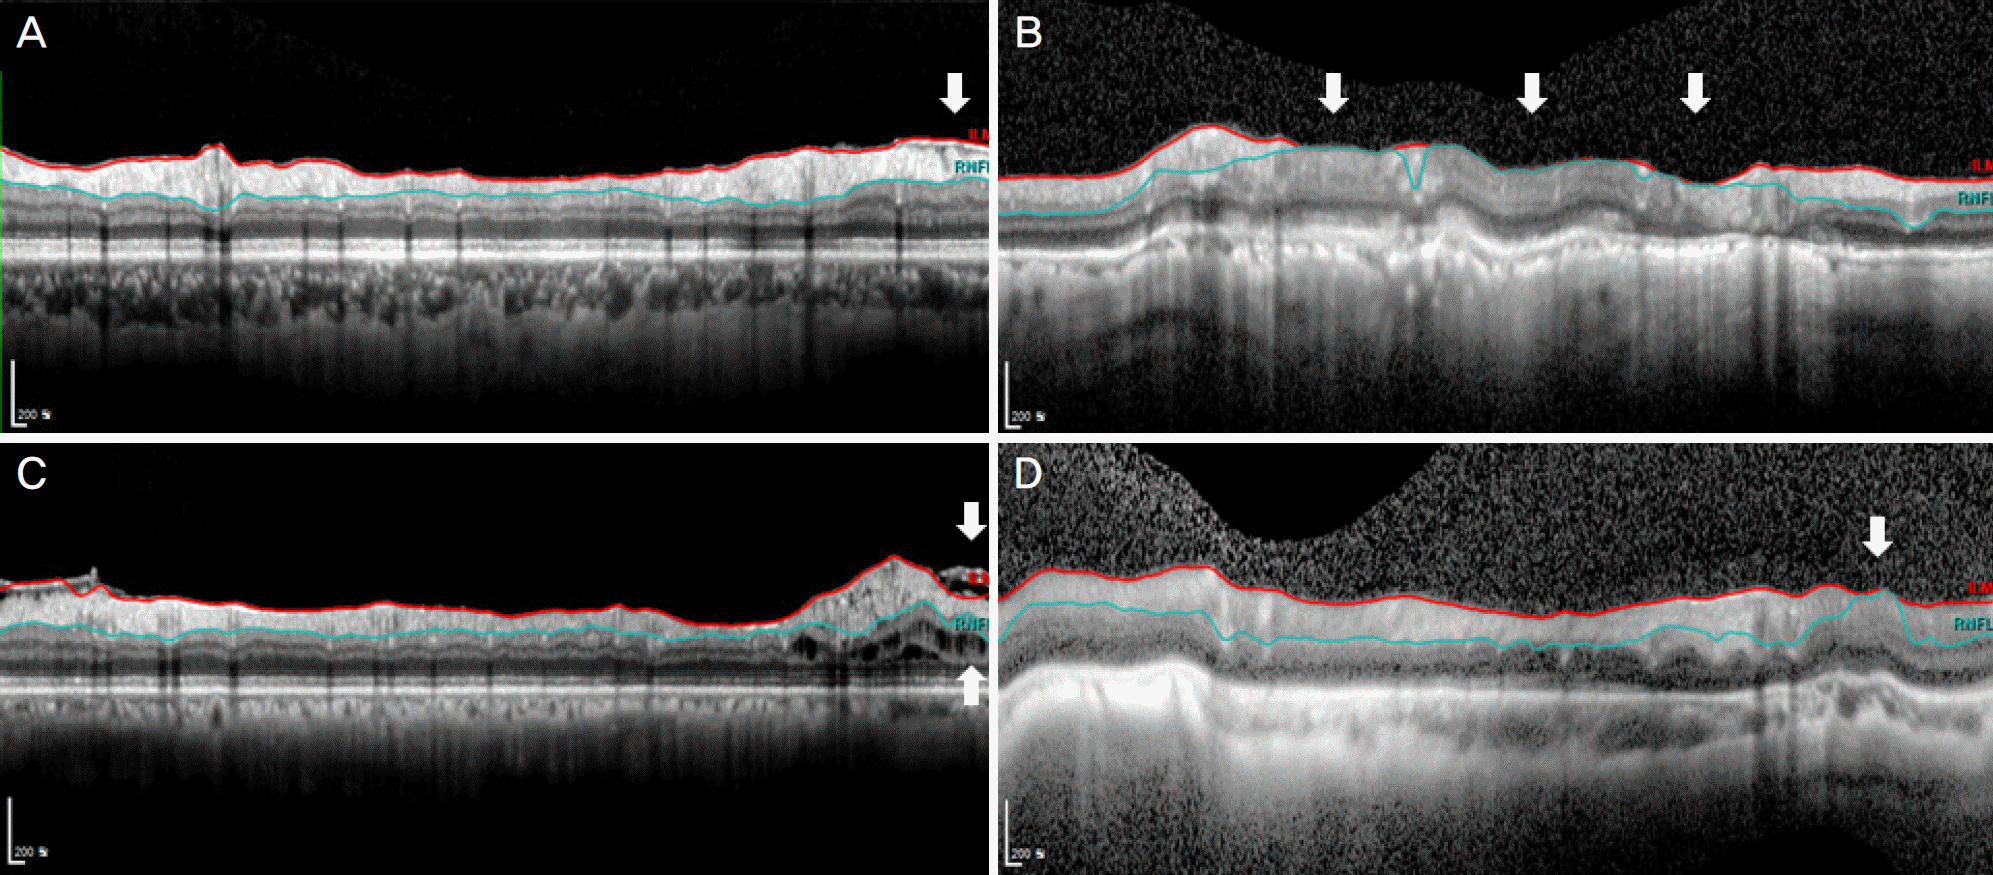
 | Figure 2.Examples of 4 segmentation error types in Spectralis™ imaging for retinal nerve fiber layer thickness. (A) Inner segmentation error associated with epiretinal membrane (arrow). (B) Outer segmentation error associated with large peripapillary atrophy (arrows). (C) Inner and outer segmentation error associated with epiretinal membrane and macular edema (arrows). (D) Degraded image (QS = 9) and outer segmentation error associated with degenerative myopia (arrow). |
Table 1.
Baseline demographics and descriptive data
| Parameters | Values |
|---|---|
| Age (years) | |
| Mean ± SD | 59.6 ± 15.2 |
| Range | 18–96 |
| Sex (n, %) | |
| Male | 55 (41.7) |
| Female | 77 (58.3) |
| BCVA (log MAR) | 0.11 ± 0.37 |
| IOP (mm Hg) | 12.6 ± 3.2 |
| SE (diopters) | −1.04 ± 2.98 |
Table 2.
Prevalence of the 4 types of segmentation errors
| Numbers of scans (n) | Percentage of scans (%) | |
|---|---|---|
| Inner segmentation error | 19 | 8.9 |
| Outer segmentation error | 64 | 29.9 |
| Inner and outer segmentation error | 13 | 6.1 |
| Degraded image | 5 | 2.3 |
Table 3.
Univariate and multivariate analysis for risk factors for inner segmentation errors
Table 4.
Univariate and multivariate analysis for risk factors for outer segmentation errors
Table 5.
Univariate and multivariate analysis for risk factors for inner and outer segmentation errors
Table 6.
Univariate and multivariate analysis for risk factors for degraded images


 PDF
PDF ePub
ePub Citation
 Print
Print


 XML Download