Abstract
Purpose
To investigate the relationships between estimated cerebrospinal fluid pressure (CSFP) and trans-lamina cribrosa pressure difference (TLCPD) in open-angle glaucoma (OAG) in Korean population.
Methods
A total of 10,801 eyes were included from the Korean National Health and Nutrition Examination Survey V. All participants (aged 19 years or older) were classified as non-glaucomatous group, OAG suspect group and OAG group. CSFP was calculated as CSFP (mm Hg) = 0.44 body mass index (kg/m2) + 0.16 diastolic blood pressure (mm Hg) – 0.18 age (years) – 1.91. TLCPD was calculated by subtracting CSFP from intraocular pressure.
Results
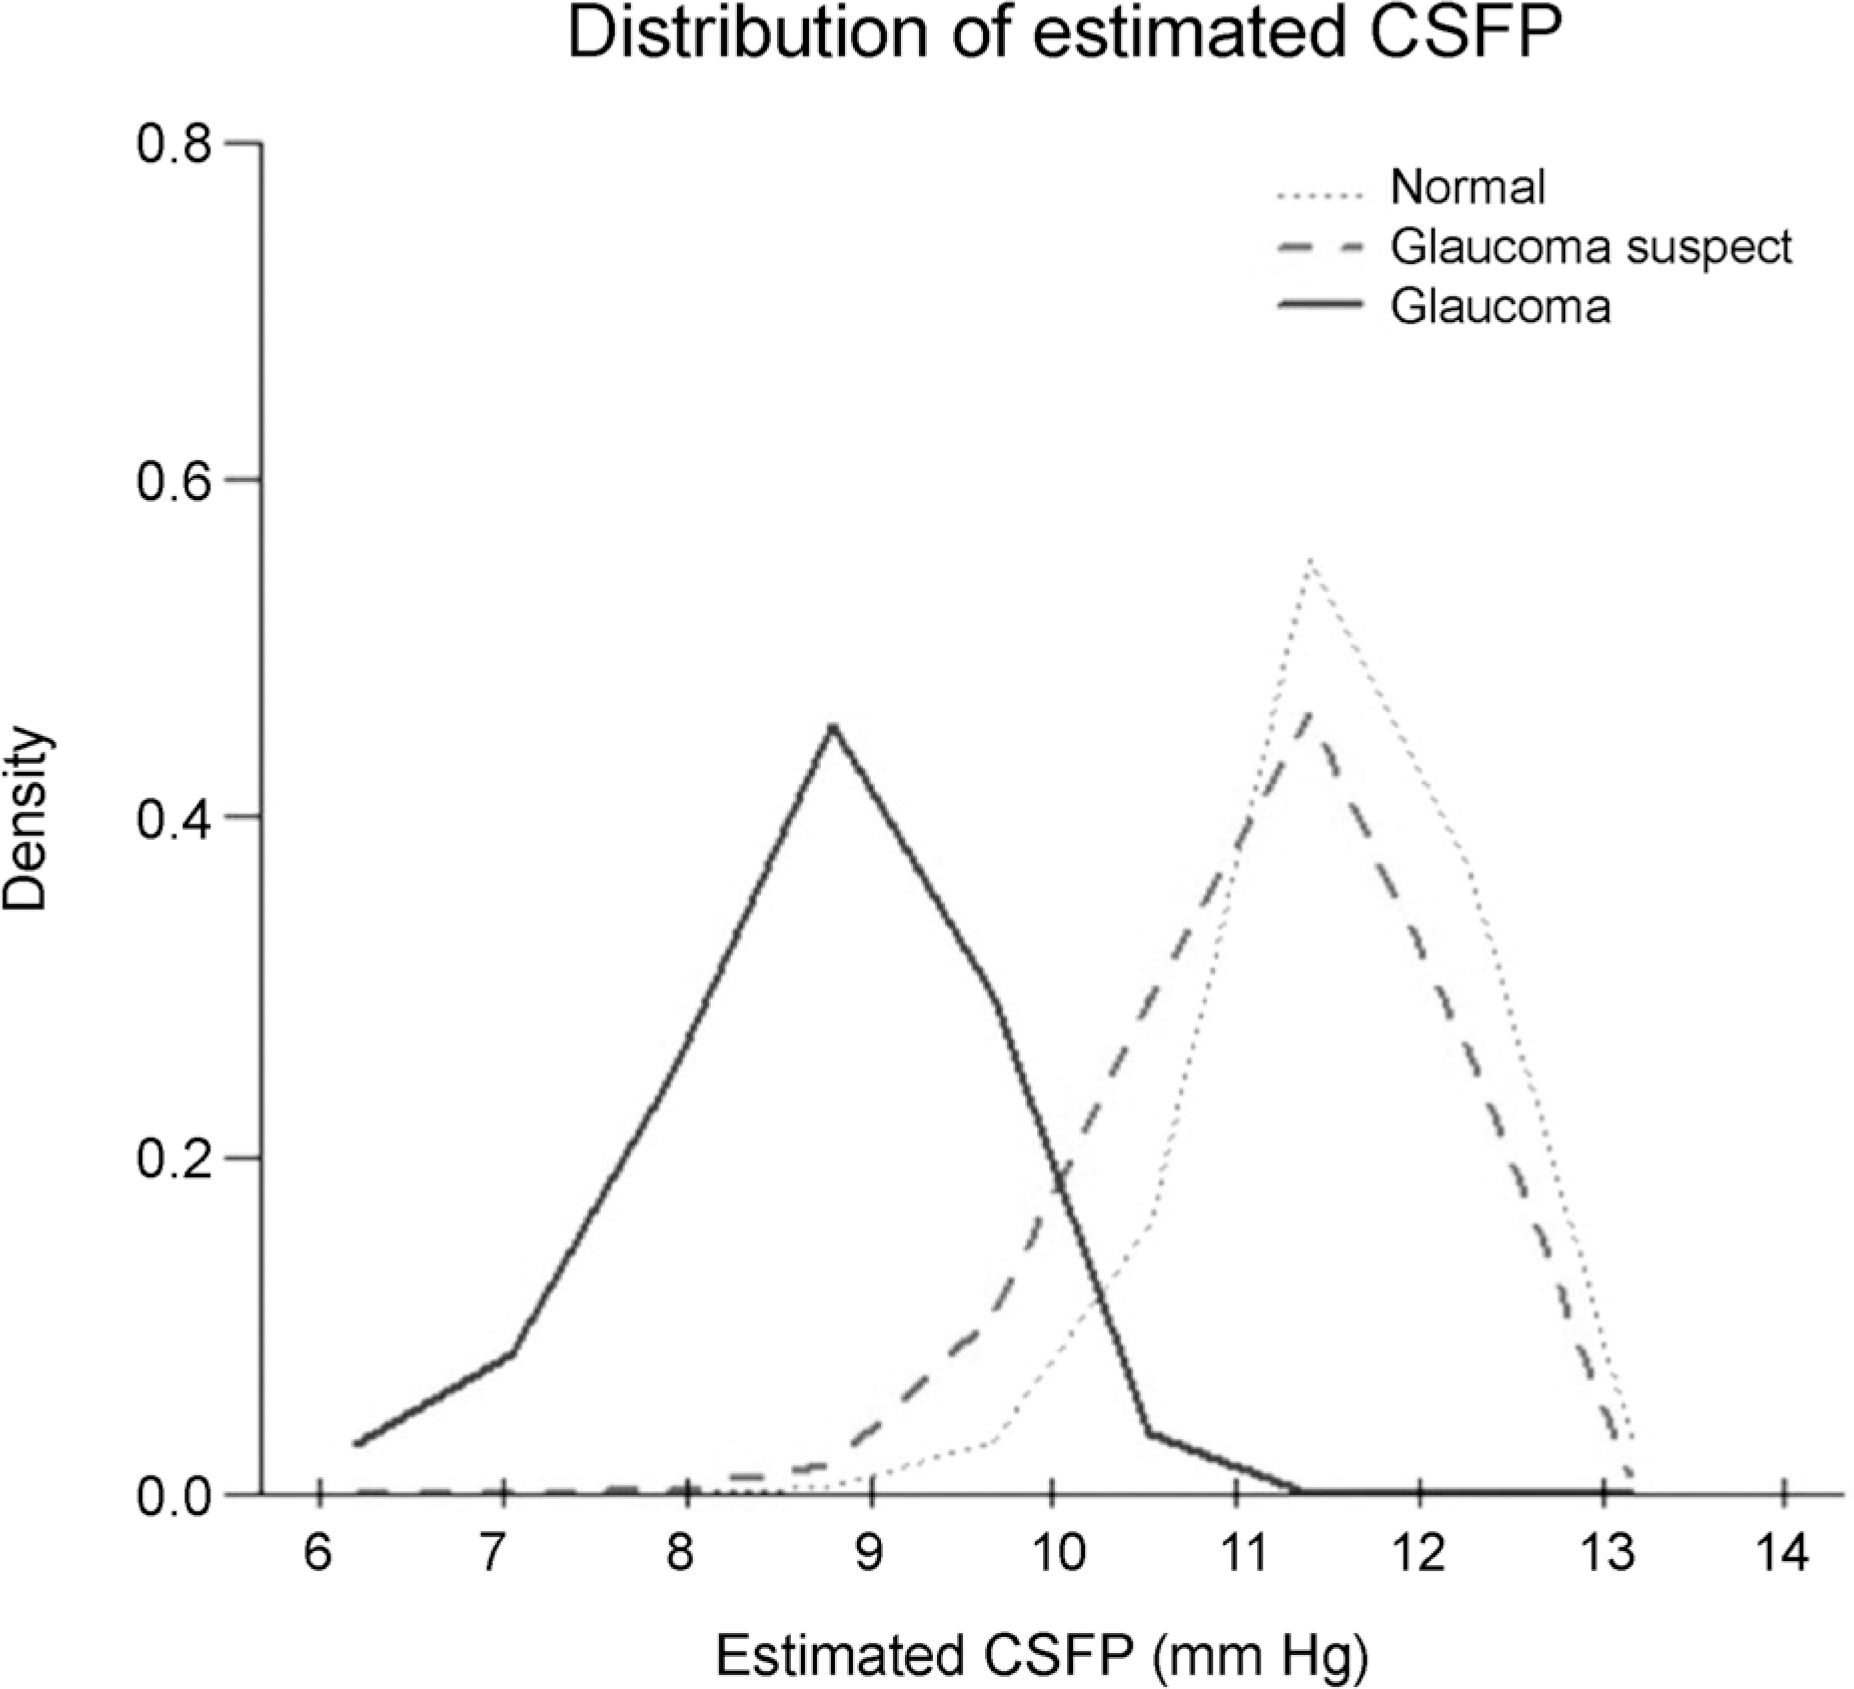
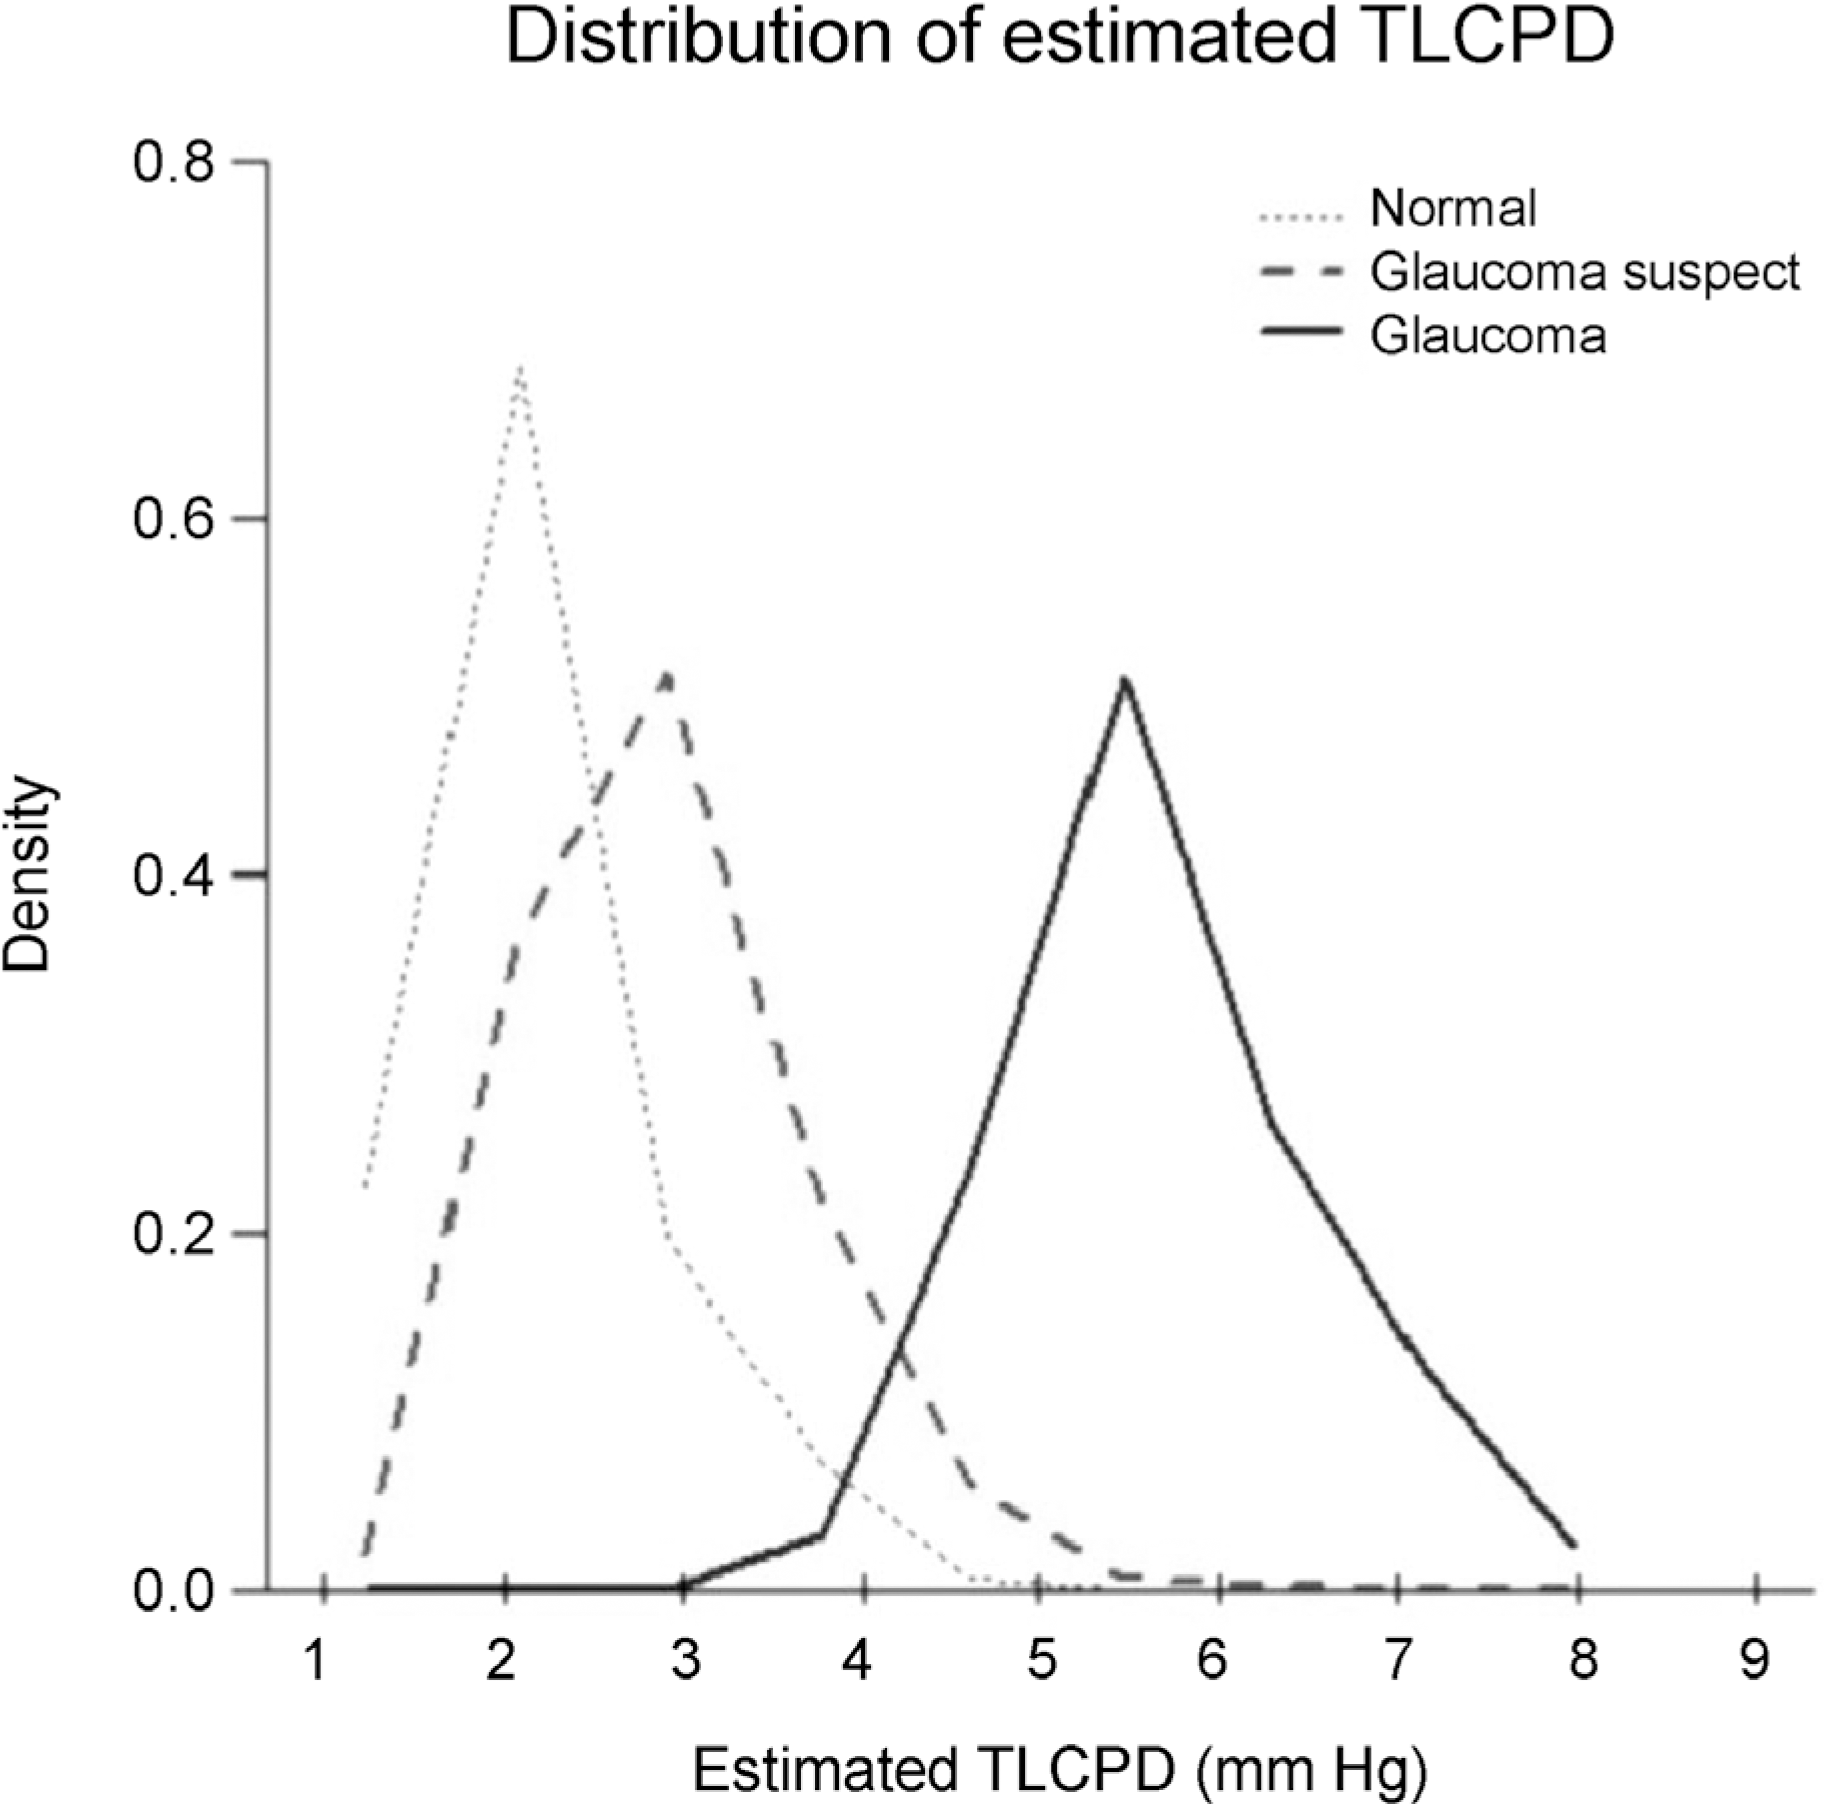
The mean estimated CSFP was (8.7 ± 3.3 mm Hg vs. 11.6 ± 3.7 mm Hg, 11.2 ± 3.8 mm Hg vs. 11.6 ± 3.7 mm Hg) was lower, and the mean TLCPD (5.7 ± 4.4 mm Hg vs. 2.2 ± 4.4 mm Hg, 3 ± 4.7 mm Hg vs. 2.2 ± 4.4 mm Hg) was higher in the OAG group and in the OAG suspect group than in the non-glaucomatous control group, respectively (p < 0.001). After adjusting relating factor with CSFP and TLCPD using simple linear regression and multivariate analyses, the mean estimated CSFP was distributed lower (p < 0.001; beta: −0.12; B: −2.306; 95% confidence interval [CI]: −2.717, −1.895) in OAG group than in nonglaucomatous group and the mean TLCPD was distributed higher (p < 0.001; beta: 0.099; B: 1.349; 95% CI: 0.977, 1.72; p < 0.001; beta: 0.118; B: 2.776; 95% CI: 2.264, 3.289) in OAG suspect group and in OAG group than in non-glaucomatous group, respectively.
Go to : 
References
1. Crawford Downs J, Roberts MD, Sigal IA. Glaucomatous cupping of the lamina cribrosa: a review of the evidence for active abdominal remodeling as a mechanism. Exp Eye Res. 2011; 93:133–40.
2. Yablonski M, Ritch R, Pokorny KS. Effect of decreased abdominal pressure on optic disk. Invest Ophthalmol Vis Sci. 1979; 18(Suppl):165.
3. Jonas JB, Berenshtein E, Holbach L. Anatomic relationship abdominal lamina cribrosa, intraocular space, and cerebrospinal fluid space. Invest Ophthalmol Vis Sci. 2003; 44:5189–95.
4. Morgan WH, Yu DY, Cooper RL, et al. The influence of abdominal fluid pressure on the lamina cribrosa tissue pressure gradient. Invest Ophthalmol Vis Sci. 1995; 36:1163–72.
5. Morgan WH, Chauhan BC, Yu DY, et al. Optic disc movement with variations in intraocular and cerebrospinal fluid pressure. Invest Ophthalmol Vis Sci. 2002; 43:3236–42.
6. Morgan WH, Yu DY, Alder VA, et al. The correlation between cerebrospinal fluid pressure and retrolaminar tissue pressure. Invest Ophthalmol Vis Sci. 1998; 39:1419–28.
7. Marek B, Harris A, Kanakamedala P, et al. Cerebrospinal fluid pressure and glaucoma: regulation of trans-lamina cribrosa pressure. Br J Ophthalmol. 2014; 98:721–5.

8. Ren R, Jonas JB, Tian G, et al. Cerebrospinal fluid pressure in abdominal: a prospective study. Ophthalmology. 2010; 117:259–66.
9. Xie X, Zhang X, Fu J, et al. Noninvasive intracranial pressure abdominal by orbital subarachnoid space measurement: the Beijing Intracranial and Intraocular Pressure (iCOP) study. Crit Care. 2013; 17:R162.
10. Jonas JB, Nangia V, Wang N, et al. Trans-lamina cribrosa pressure difference and open-angle glaucoma. The central India eye and medical study. PLoS One. 2013; 8:e82284.

11. Jonas JB, Wang NL, Wang YX, et al. Estimated trans-lamina cribrosa pressure difference versus intraocular pressure as biomarker for open-angle glaucoma. The Beijing Eye Study 2011. Acta Ophthalmol. 2015; 93:e7–e13.

12. Wang YX, Jonas JB, Wang N, et al. Intraocular pressure and estimated cerebrospinal fluid pressure. The Beijing Eye Study 2011. PLoS One. 2014; 9:e104267.

13. Yoon KC, Mun GH, Kim SD, et al. Prevalence of eye diseases in South Korea: data from the Korea National Health and Nutrition Examination Survey 2008–2009. Korean J Ophthalmol. 2011; 25:421–33.

14. Foster PJ, Buhrmann R, Quigley HA, Johnson GJ. The definition and classification of glaucoma in prevalence surveys. Br J Ophthalmol. 2002; 86:238–42.

15. Berdahl JP, Allingham RR, Johnson DH. Cerebrospinal fluid pressure is decreased in primary open-angle glaucoma. Ophthalmology. 2008; 115:763–8.

16. Berdahl JP, Fautsch MP, Stinnett SS, Allingham RR. Intracranial pressure in primary open angle glaucoma, normal tension glaucoma, and ocular hypertension: a case-control study. Invest Ophthalmol Vis Sci. 2008; 49:5412–8.

17. Guidoboni G, Harris A, Carichino L, et al. Effect of intraocular pressure on the hemodynamics of the central retinal artery: a mathematical model. Math Biosci Eng. 2014; 11:523–46.

18. Quigley HA, Broman AT. The number of people with glaucoma worldwide in 2010 and 2020. Br J Ophthalmol. 2006; 90:262–7.

19. Kim CS, Seong GJ, Lee NH, et al. Prevalence of primary open-angle glaucoma in central South Korea the Namil study. Ophthalmology. 2011; 118:1024–30.
Go to : 
 | Figure 1.Distribution of estimated cerebrospinal fluid pressure. Estimated cerebrospinal fluid pressure (CSFP) was calculated after adjustment for glaucoma status, sex, log-transformed pulse, total cholesterol, log-transformed triglycerides, corneal refractive power, anterior chamber depth, vertical cup-to-ratio, and intraocular pressure. |
 | Figure 2.Distribution of estimated trans-lamina cribrosa pressure difference. Estimated trans-lamina cribrosa pressure difference (TLCPD) was calculated after adjustment for glaucoma status, sex, log-transformed pulse, corneal refractive power, anterior chamber depth, and vertical cup-to-disc ratio. |
Table 1.
Characteristic per groups
| Variable | Normal | Glaucoma suspect | Glaucoma | Total | Comparison (p-value*) |
|---|---|---|---|---|---|
| By patient | N = 4,911 | N = 895 | N = 326 | N = 6,132 | |
| Age (years) | 50.8 ± 16.6 | 54.4 ± 15.7 | 65.5 ± 11.7 | 52.1 ± 16.6 | <0.0011–2,1–3,2–3 |
| Sex (n, %) | |||||
| Male | 1,995 (40.6) | 462 (51.6) | 152 (46.6) | 2,609 (42.5) | <0.0011–2 |
| Female | 2,916 (59.4) | 433 (48.4) | 174 (53.4) | 3,523 (57.5) | |
| BMI (kg/m2) | 23.7 ± 3.4 | 23.9 ± 3.2 | 23.7 ± 3.2 | 23.8 ± 3.4 | 0.510 |
| Systolic BP (mm Hg) | 119.3 ± 16.9 | 122.2 ± 18.1 | 126.6 ± 17.6 | 120.1 ± 17.2 | <0.0011–2,1–3,2–3 |
| Diastolic BP (mm Hg) | 75.6 ± 10.4 | 76.7 ± 10.3 | 75.0 ± 10.1 | 75.7 ± 10.4 | 0.0041–2,2–3 |
| Pulse (beats/15 sec) | 17.6 ± 2.0 | 14.1 ± 3.0 | 17.5 ± 2.1 | 17.1 ± 2.6 | <0.0011–2,2–3 |
| Total cholesterol (mg/dL) | 189.7 ± 36.6 | 188.1 ± 35.7 | 190.2 ± 36.2 | 189.5 ± 36.5 | 0.468 |
| HDL cholesterol (mg/dL) | 51.8 ± 12.7 | 50.5 ± 12.6 | 48.4 ± 11.1 | 51.5 ± 12.6 | <0.0011–2,1–3,2–3 |
| Triglycerides (mg/dL) | 130.5 ± 130.9 | 137.1 ± 106.7 | 147.1 ± 81.0 | 132.3 ± 103.3 | 0.0101–3 |
| By eye | N = 9,149 | N = 1,224 | N = 428 | N = 10,801 | |
| Corneal refractive power (diopter) | −0.8 ± 2.2 | −0.7 ± 2.1 | −0.7 ± 3.0 | −0.8 ± 2.2 | 0.048 |
| ACD | 2.8 ± 0.5 | 2.7 ± 0.5 | 2.7 ± 0.6 | 2.8 ± 0.5 | <0.0011–3 |
| Vertical CDR | 0.3 ± 0.1 | 0.6 ± 0.1 | 0.7 ± 0.2 | 0.4 ± 0.1 | <0.0011–2,1–3,2–3 |
| Horizontal CDR | 0.3 ± 0.1 | 0.6 ± 0.1 | 0.6 ± 0.2 | 0.4 ± 0.1 | <0.0011–2,1–3,2–3 |
| Estimated CSFP (mm Hg) | 11.6 ± 3.7 | 11.2 ± 3.8 | 8.7 ± 3.3 | 11.4 ± 3.7 | <0.0011–2,1–3,2–3 |
| IOP (mm Hg) | 13.7 ± 2.7 | 14.2 ± 3.0 | 14.4 ± 3.4 | 13.8 ± 2.8 | <0.0011–2,1–3 |
| TLCPD (mm Hg) | 2.2 ± 4.4 | 3.0 ± 4.7 | 5.7 ± 4.4 | 2.4 ± 4.5 | <0.0011–2,1–3,2–3 |
BMI = body mass index; BP = blood pressure; HDL = high-density lipoprotein; ACD = anterior chamber depth; CDR = cup-to-disc ratio; CSFP = cerebrospinal fluid pressure; IOP = intraocular pressure; TLCPD = trans-lamina cribrosa pressure difference.
* p-values were calculated by analysis of variance (ANOVA) assuming unequal variance for continuous variables and Chi-square test for categorical variables. Posthoc comparison by Scheffe's method: i-j means that i-th group had significant differences (i, j = 1, 2, 3; Group 1 = Normal, Group 2 = Glaucoma suspect, Group 3 = Glaucoma).
Table 2.
Linear regression analysis for cerebrospinal fluid pressure
| Variable |
Univariable |
Multivariable |
|||||||
|---|---|---|---|---|---|---|---|---|---|
| B | 95% CI | Beta | p-value | B | 95% CI | Beta | p-value | VIF | |
| Glaucoma suspect (vs. Normal) | −0.348 | −0.566, −0.130 | −0.030 | 0.002 | 0.241 | −0.056, 0.538 | 0.022 | 0.111 | 0.000 |
| Galucoma (vs. Normal) | −2.871 | −3.226, −2.516 | −0.151 | <0.001 | −2.306 | −2.717, −1.895 | −0.120 | <0.001 | 2.594 |
| Male (ref: Female) | 0.869 | 0.728, 1.009 | 0.116 | <0.001 | 0.870 | 0.730, 1.009 | 0.120 | <0.001 | 1.093 |
| Systolic BP (mm Hg)* | −0.140 | −0.646, 0.366 | −0.005 | 0.588 | |||||
| Pulse (beats/15sec)* | 1.992 | 1.514, 2.469 | 0.082 | <0.001 | 1.502 | 0.969, 2.035 | 0.063 | <0.001 | 1.485 |
| Total cholesterol (mg/dL) | 0.004 | 0.002, 0.006 | 0.041 | <0.001 | 0.003 | 0.001, 0.005 | 0.028 | 0.005 | 1.162 |
| HDL cholesterol (mg/dL) | −0.003 | −0.009, 0.002 | −0.012 | 0.228 | |||||
| Triglycerides (mg/dL)* | 0.592 | 0.472, 0.712 | 0.095 | <0.001 | 0.599 | 0.474, 0.724 | 0.098 | <0.001 | 1.234 |
| Corneal refractive power (diopter) | −0.579 | −0.609, −0.549 | −0.345 | <0.001 | −0.539 | −0.569, −0.509 | −0.337 | <0.001 | 1.041 |
| ACD | 1.154 | 1.006, 1.032 | 0.146 | <0.001 | 0.691 | 0.548, 0.835 | 0.089 | <0.001 | 1.027 |
| Vertical CDR | −2.578 | −3.059, −2.097 | −0.101 | <0.001 | −1.178 | −1.832, −0.525 | −0.048 | <0.001 | 2.073 |
| Horizontal CDR | −2.322 | −2.817, −1.826 | −0.088 | <0.001 | |||||
| IOP (mm Hg) | 0.086 | 0.061, 0.111 | 0.065 | <0.001 | 0.034 | 0.009, 0.059 | 0.027 | 0.007 | 1.110 |
Table 3.
Linear regression analysis trans-lamina cribrosa pressure difference
| Variable |
Univariable |
Multivariable |
|||||||
|---|---|---|---|---|---|---|---|---|---|
| B | 95% CI | Beta | p-value | B | 95% CI | Beta | p-value | VIF | |
| Glaucoma suspect (vs. Normal) | 0.798 | 0.533, 1.062 | 0.056 | <0.001 | 1.349 | 0.977, 1.720 | 0.099 | <0.001 | 0.000 |
| Galucoma (vs. Normal) | 3.537 | 3.107, 3.967 | 0.154 | <0.001 | 2.776 | 2.264, 3.289 | 0.118 | <0.001 | 2.579 |
| Male (ref: Female) | −0.614 | −0.785, −0.442 | −0.067 | <0.001 | −0.740 | −0.910, −0.570 | −0.081 | <0.001 | 1.018 |
| Systolic BP (mm Hg)* | 2.257 | 1.644, 2.869 | 0.069 | <0.001 | |||||
| Pulse (beats/15 sec)* | 2.090 | 1.509, 2.671 | 0.070 | <0.001 | 4.604 | 3.964, 5.243 | 0.155 | <0.001 | 1.362 |
| Total cholesterol (mg/dL) | −0.001 | −0.003, 0.002 | −0.006 | 0.538 | |||||
| HDL cholesterol (mg/dL) | −0.008 | −0.015, −0.002 | −0.024 | 0.015 | |||||
| Triglycerides (mg/dL)* | −0.100 | −0.247, 0.047 | −0.013 | 0.185 | |||||
| Corneal refractive power (diopter) | 0.506 | 0.468, 0.543 | 0.248 | <0.001 | 0.492 | 0.454, 0.530 | 0.244 | <0.001 | 1.030 |
| ACD | −1.134 | −1.314, −0.954 | −0.118 | <0.001 | −0.729 | −0.909, −0.549 | −0.076 | <0.001 | 1.026 |
| Vertical CDR | 4.303 | 3.722, 4.884 | 0.138 | <0.001 | 2.446 | 1.623, 3.268 | 0.080 | <0.001 | 2.090 |
| Horizontal CDR | 3.903 | 3.304, 4.501 | 0.122 | <0.001 | |||||


 PDF
PDF ePub
ePub Citation
 Print
Print


 XML Download