Abstract
Purpose
We report a case of asymptomatic unexplained visual field loss diagnosed as early retinitis pigmentosa (RP) without pigmentation.
Case summary
A 33-year-old woman was referred to us with a constricted visual field (C24–2) before laser-assisted in-situ keratomileusis surgery. The visual field test (C30–2) revealed significantly decreased sensitivity between 15 to 25 degrees in both eyes. Close fundus examination revealed a subtle greyish retinal atrophic lesion along the vascular arcade and fluorescein angiography revealed a window defect in accordance with a retinal atrophic lesion in both eyes. Optical coherence tomography showed decreased retinal thickness around the macula. Electroretinogram revealed decreased b waves in rod response. Based on these findings, we diagnosed the patient with early RP without pigmentation.
Conclusions
The possibility of early RP without pigmentation presenting as slight atrophy around the macula without significant pigmental degeneration should also be considered if a patient presents with peripheral visual field constriction without other symptoms. The ophthalmologist should ensure that the location of the visual field defect matches the location of the lesion. In addition, a detailed fundus examination with macular optical coherence tomography can be helpful to diagnose such a lesion.
Go to : 
References
1. Ryan SJ. Retina. 5th ed.2. Philadelphia: Saunders;2013. 762:765–6.
2. Bunker CH, Berson EL, Bromley WC, et al. Prevalence of retinitis pigmentosa in Maine. Am J Ophthalmol. 1984; 97:357–65.

3. Frank MH, Sayegh MH. Immunomodulatory functions of abdominal stem cells. Lancet. 2004; 363:1411–2.
4. Carr RE, Noble KG. Retinitis pigmentosa. Ophthalmology. 1981; 88:169–72.
5. Grover S, Fishman GA, Anderson RJ, et al. Visual acuity abdominal in patients with retinitis pigmentosa at age 45 years or older. Ophthalmology. 1999; 106:1780–5.
6. Noble KG, Carr RE. Peripapillary pigmentary retinal degeneration. Am J Ophthalmol. 1978; 86:65–75.

7. Contestabile MT, Plateroti R, Carlesimo SC, et al. Atypical retinitis pigmentosa: a report of three cases. Ann Ophthalmol. 1992; 24:325–44.
8. Marsiglia M, Duncker T, Peiretti E, et al. Unilateral retinitis abdominal: a proposal of genetic pathogenic mechanisms. Eur J Ophthalmol. 2012; 22:654–60.
9. Massof RW, Benzschawel T, Emmel T, et al. The spread of retinal degeneration in retinitis pigmentosa. Invest Ophthalmol Vis Sci. 1984; 25:196.
10. Massof RW, Finkelstein D, Starr SJ. A two-stage hypothesis for the natural course of retinitis pigmentosa. Adv Biosci. 1987; 62:29–58.
11. Hood DC, Ramachandran R, Holopigian K, et al. Method for deriving visual field boundaries from OCT scans of patients with abdominal pigmentosa. Biomed Opt Express. 2011; 2:1106–14.
Go to : 
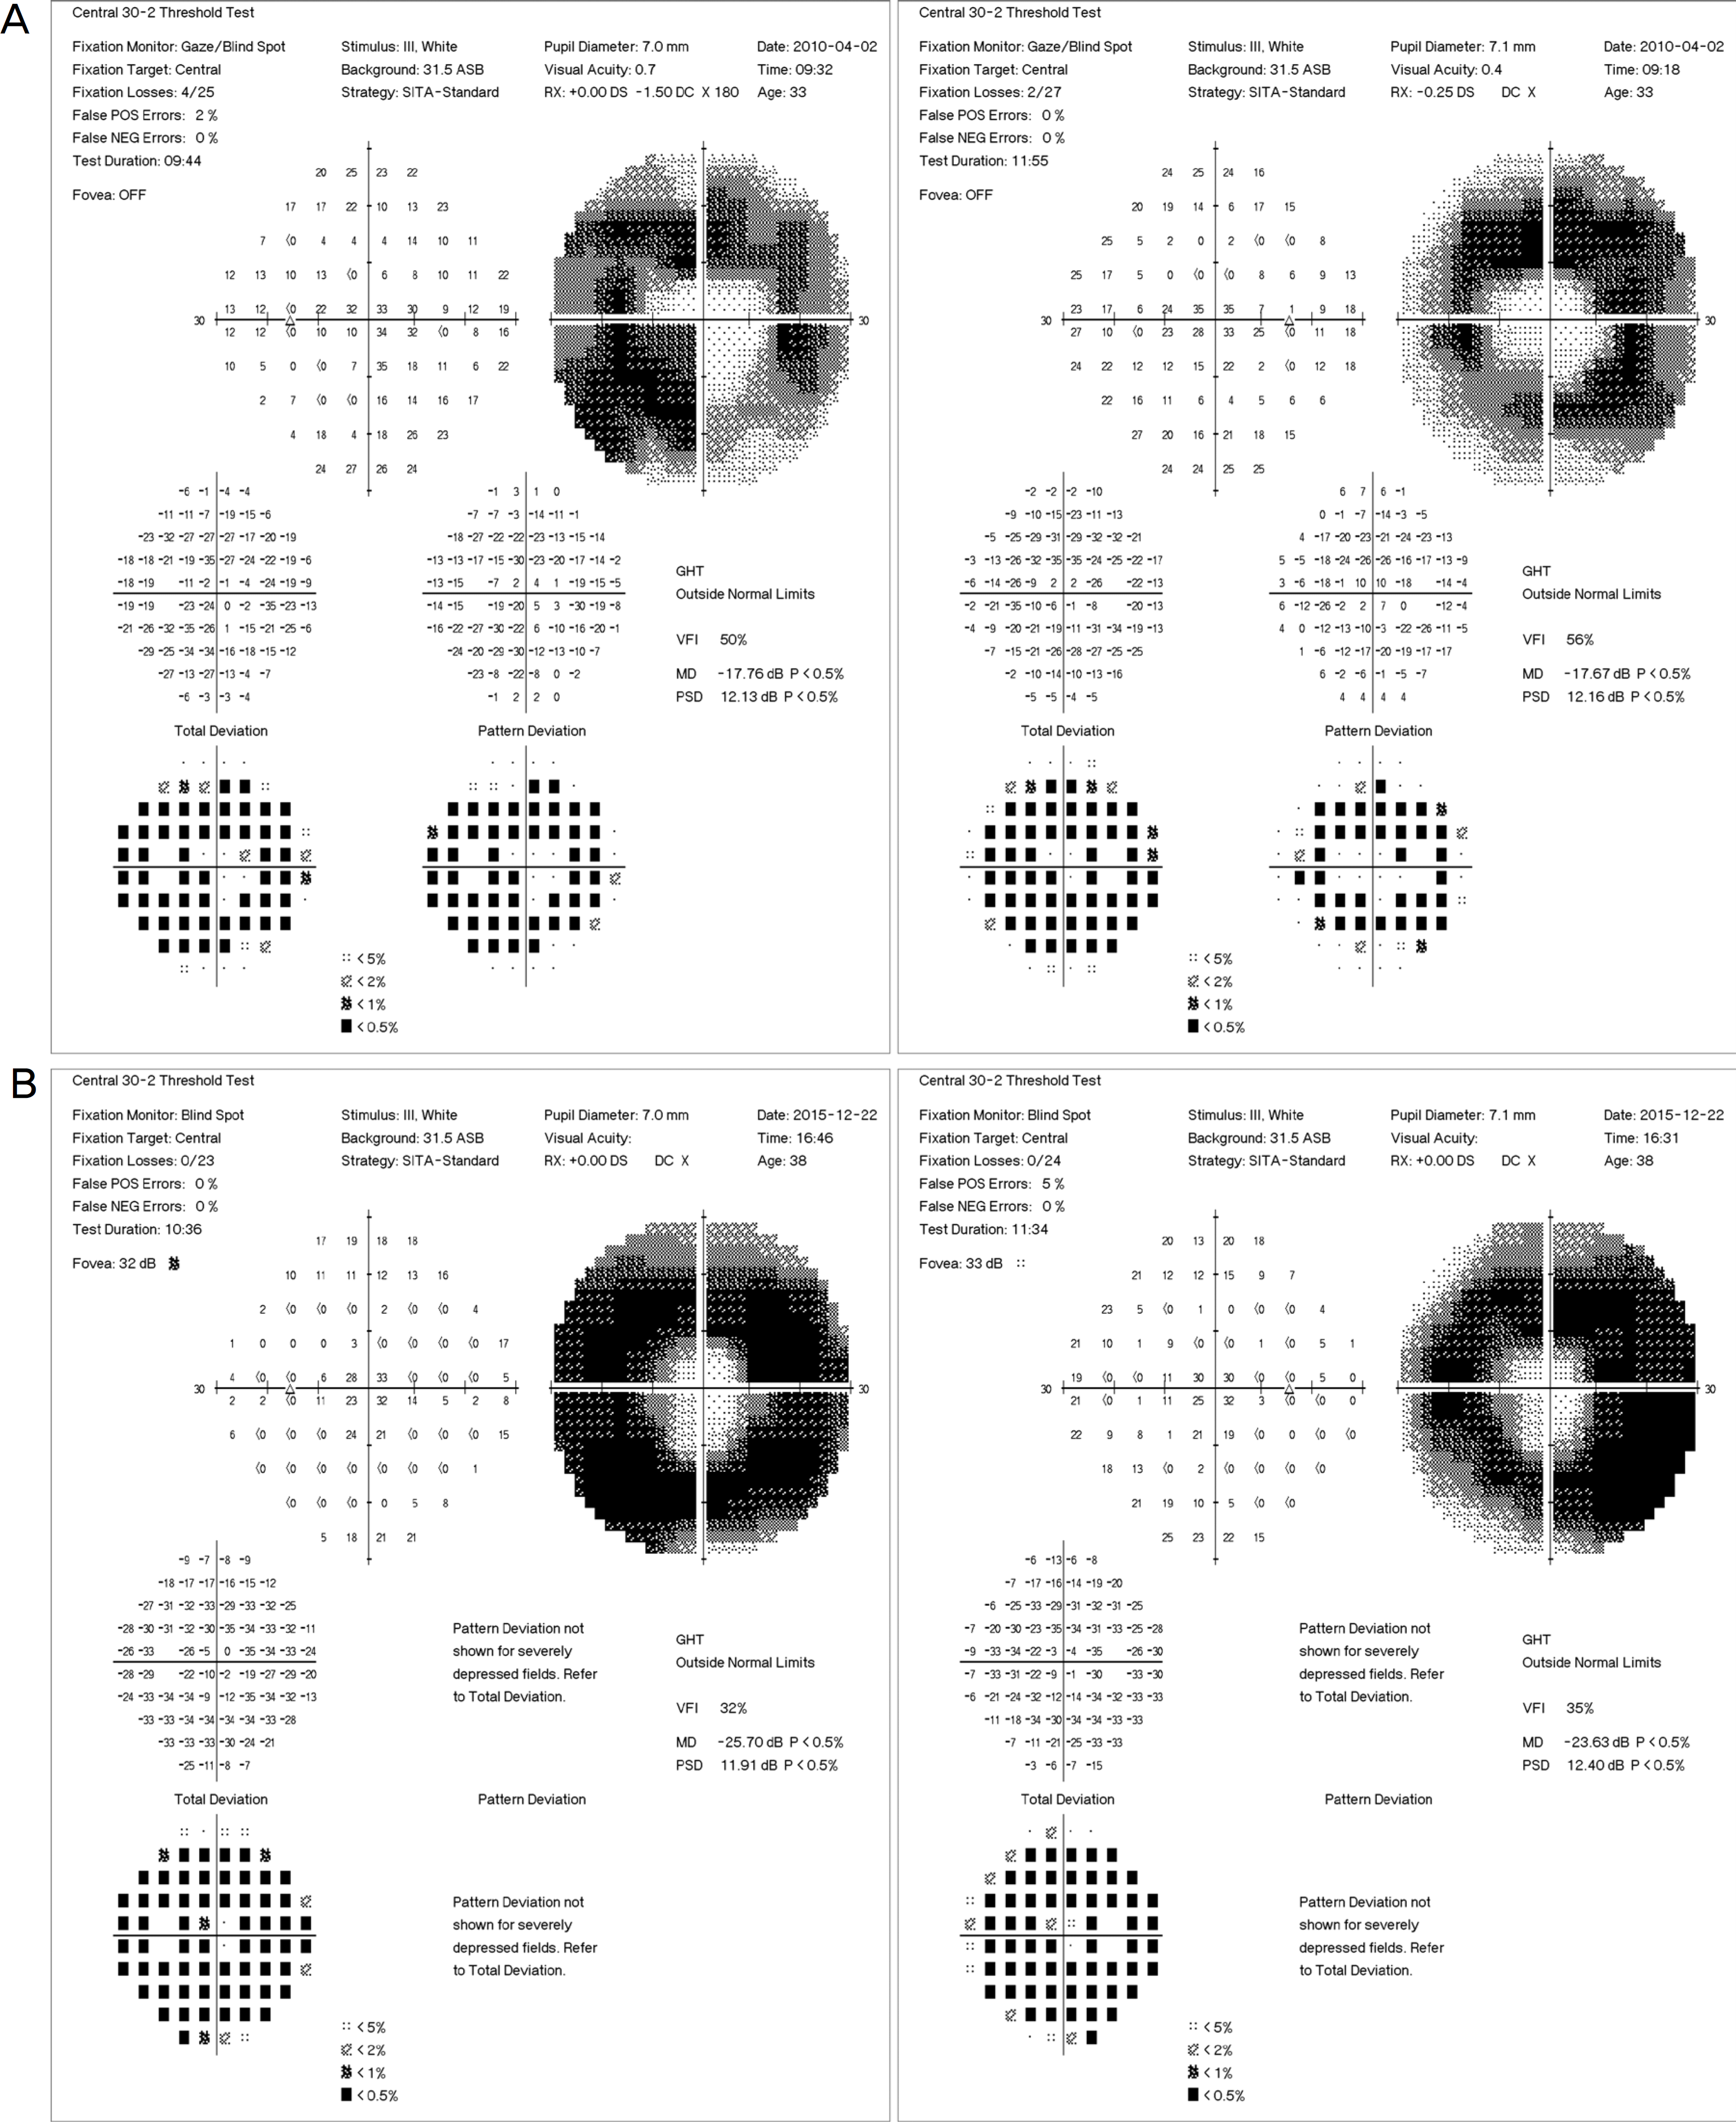 | Figure 1.Visual field change of this patient. (A) Visual fields reveal decreased sensitivity between 15 to 25 degrees in both eyes. (B) Five years later, visual fields show progression of peripheral constriction. |
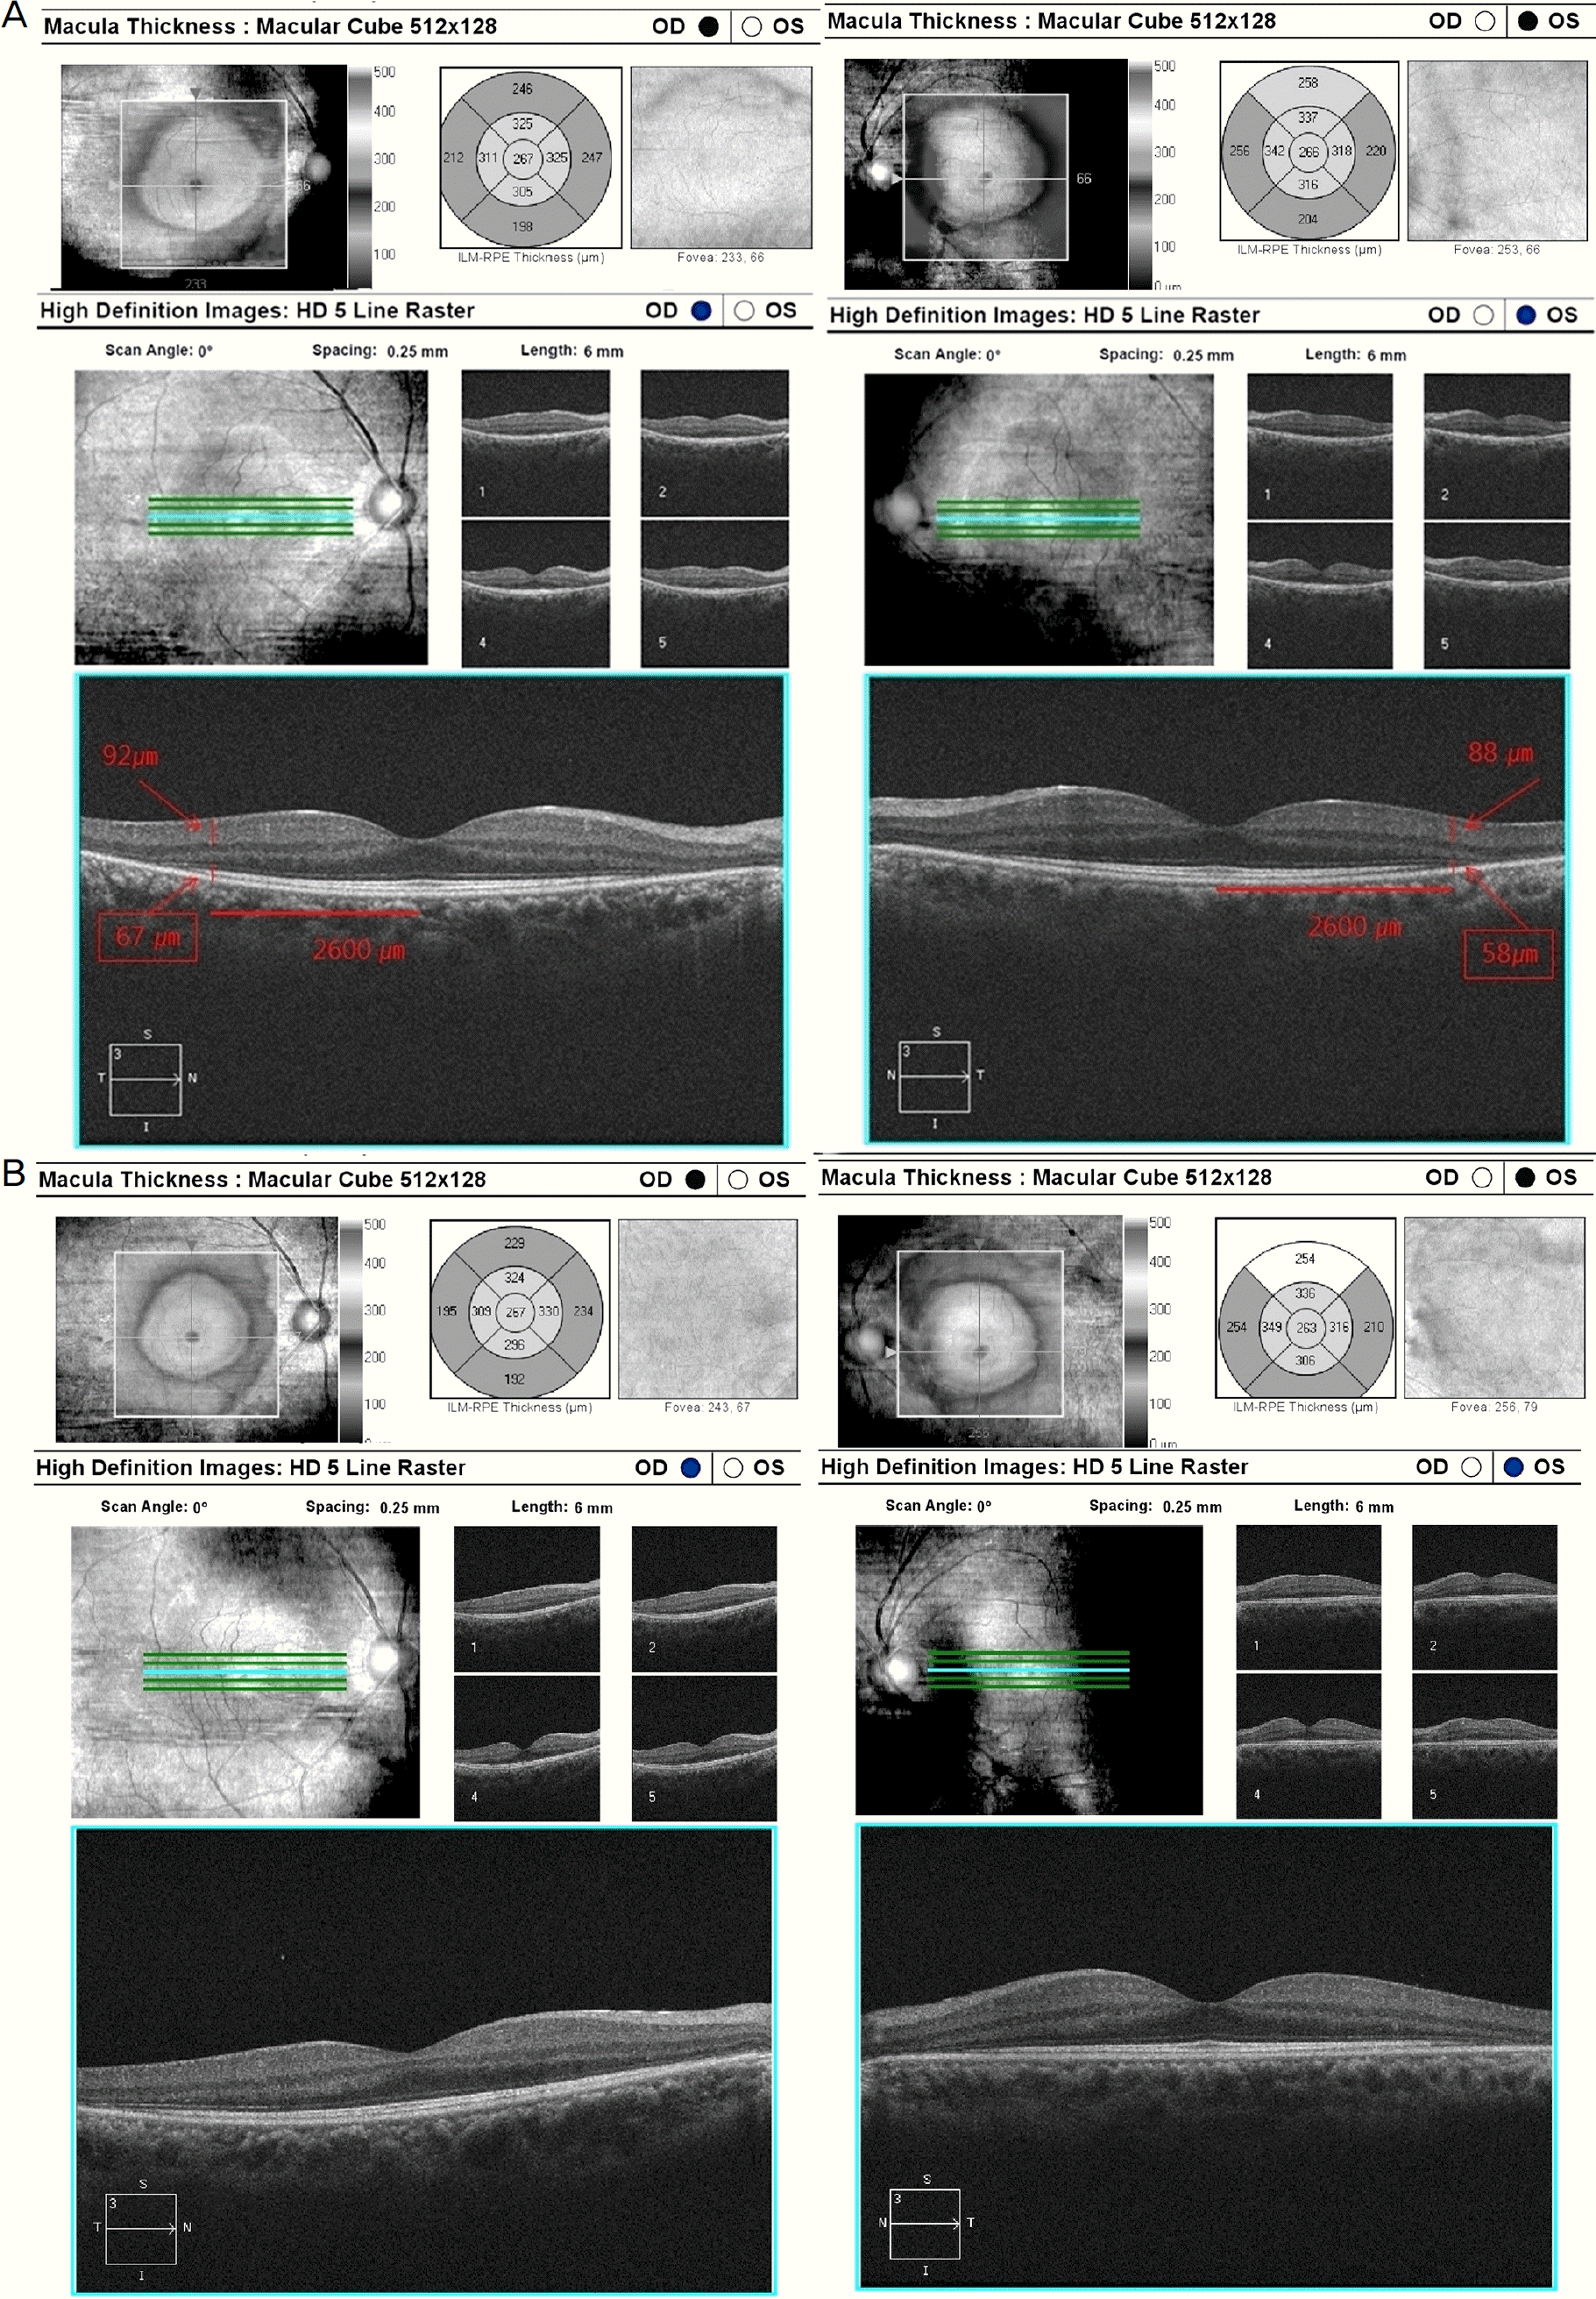 | Figure 2.Spectral optical coherence tomography (OCT) change of this patient. (A) OCT shows decreased retinal outer layer thickness around the macula in both eyes. (B) Five years later, OCT shows stationary. |
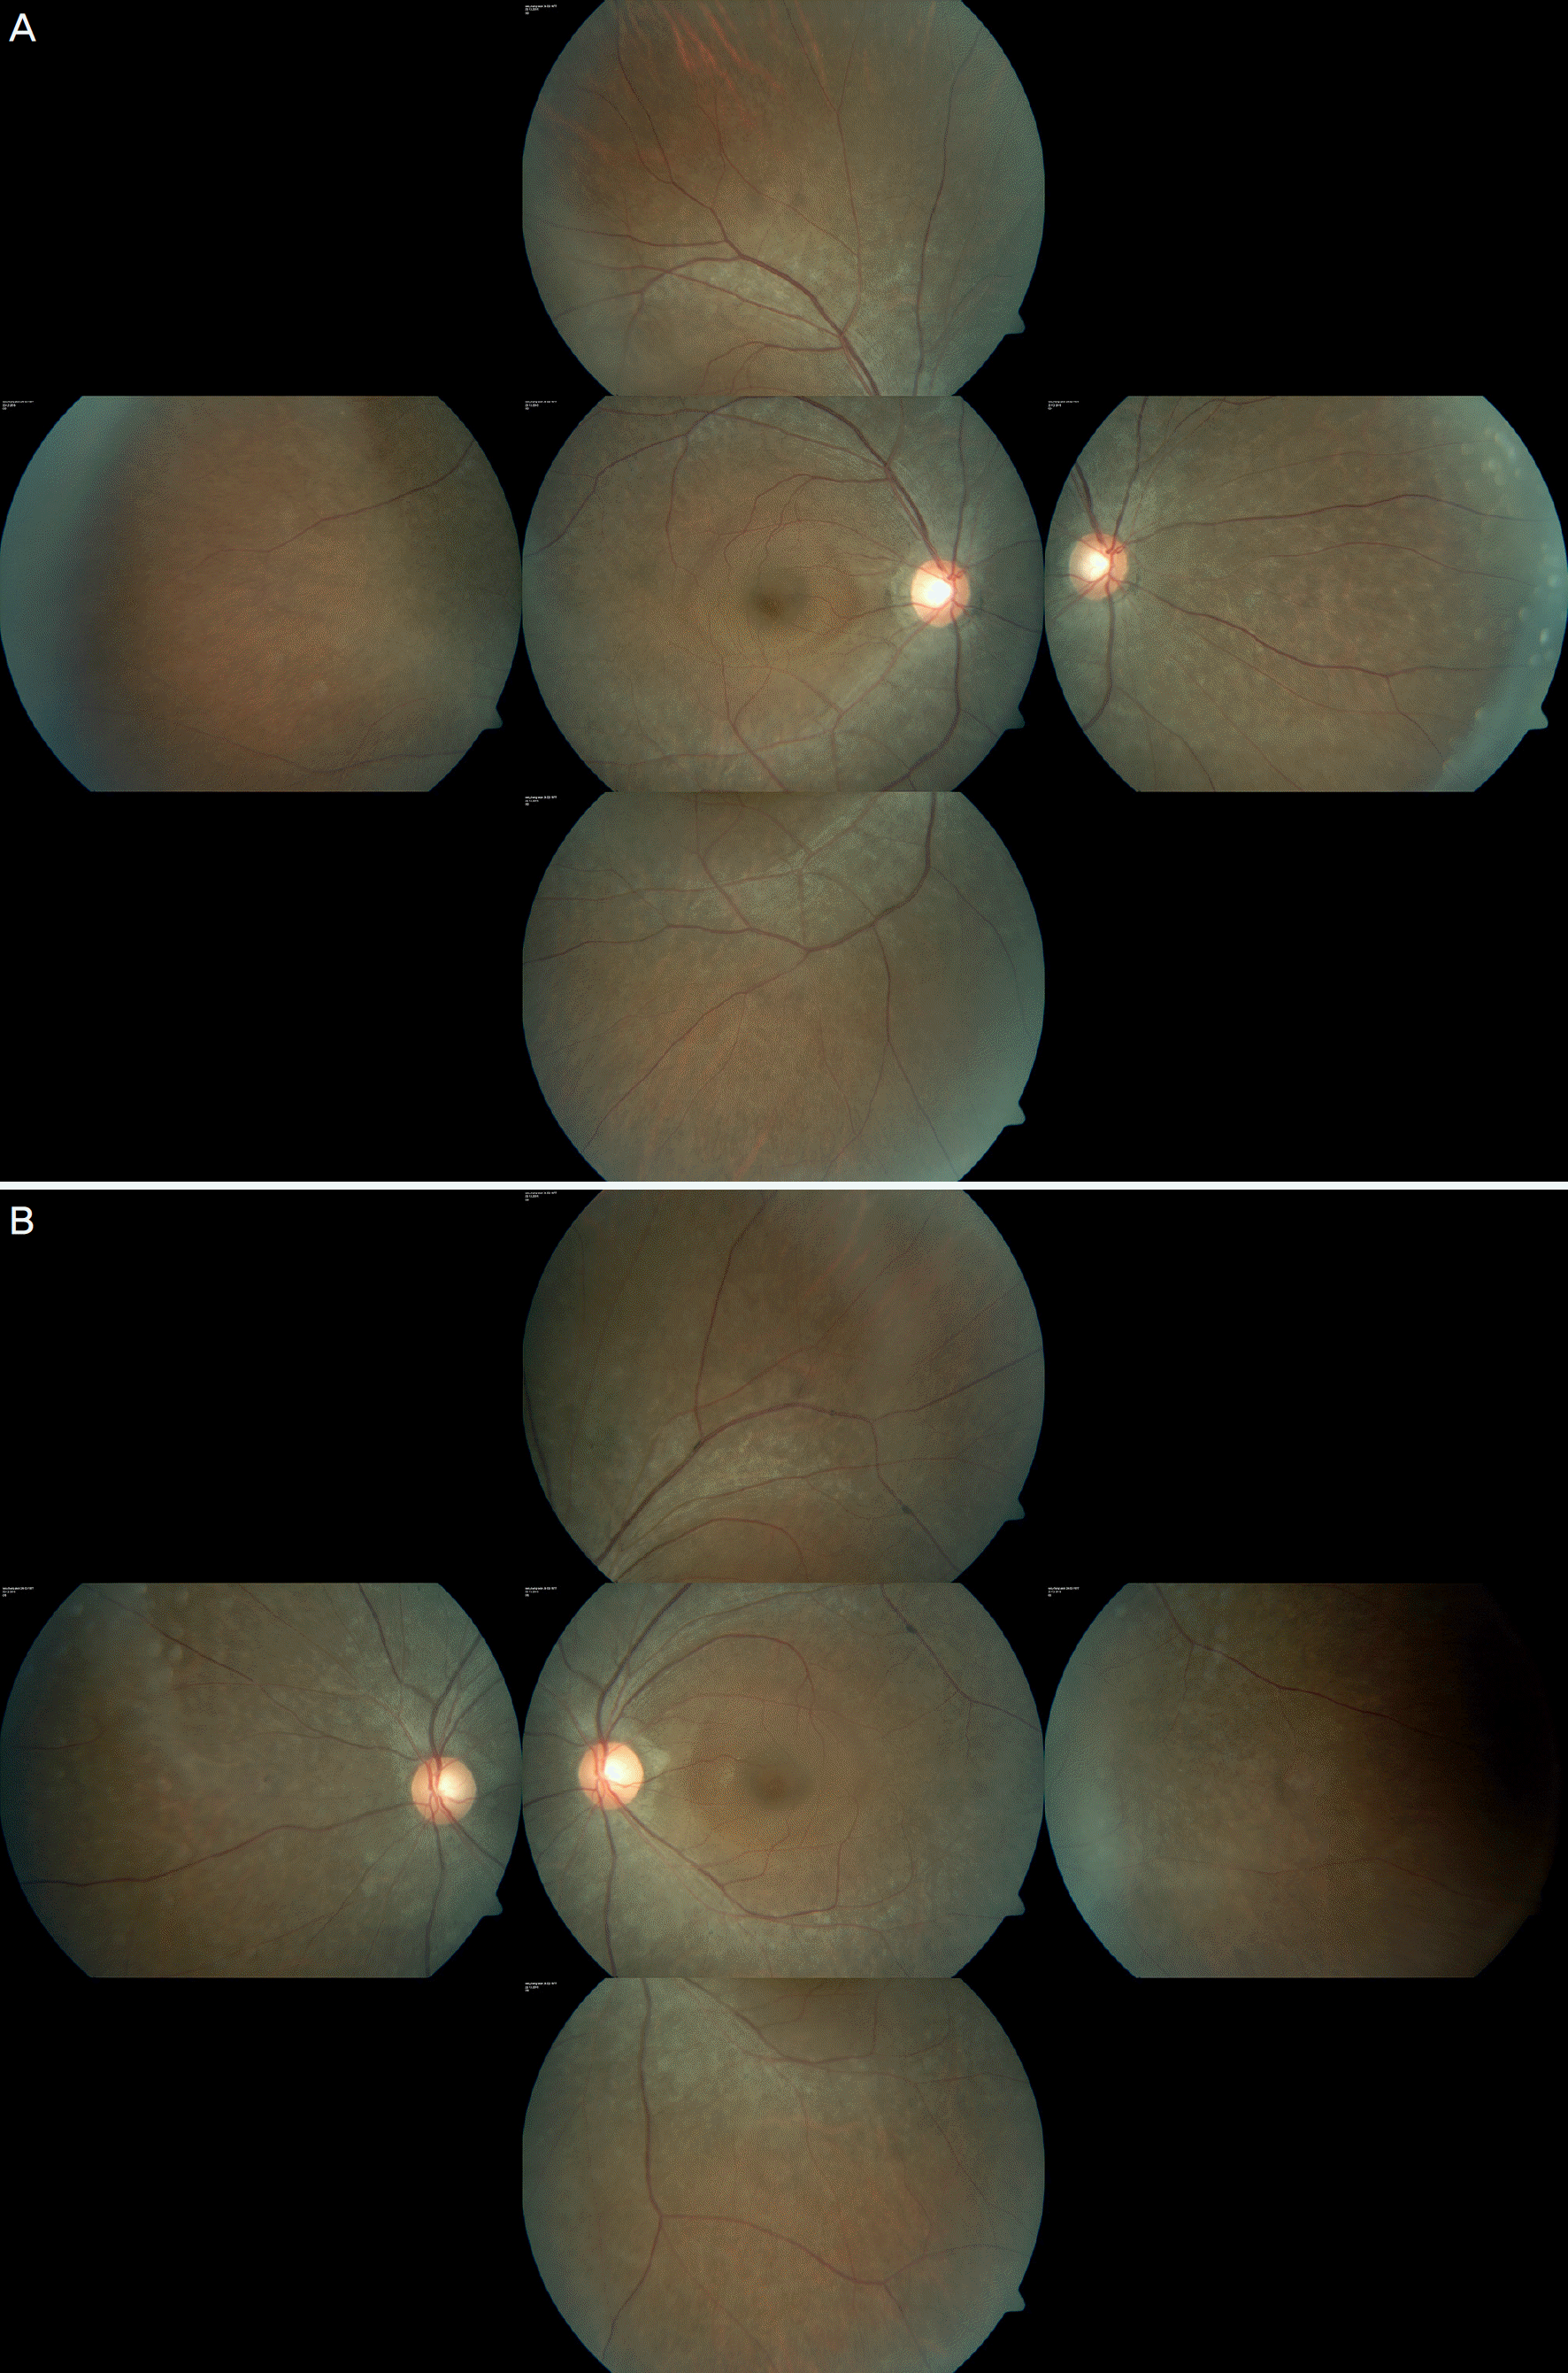
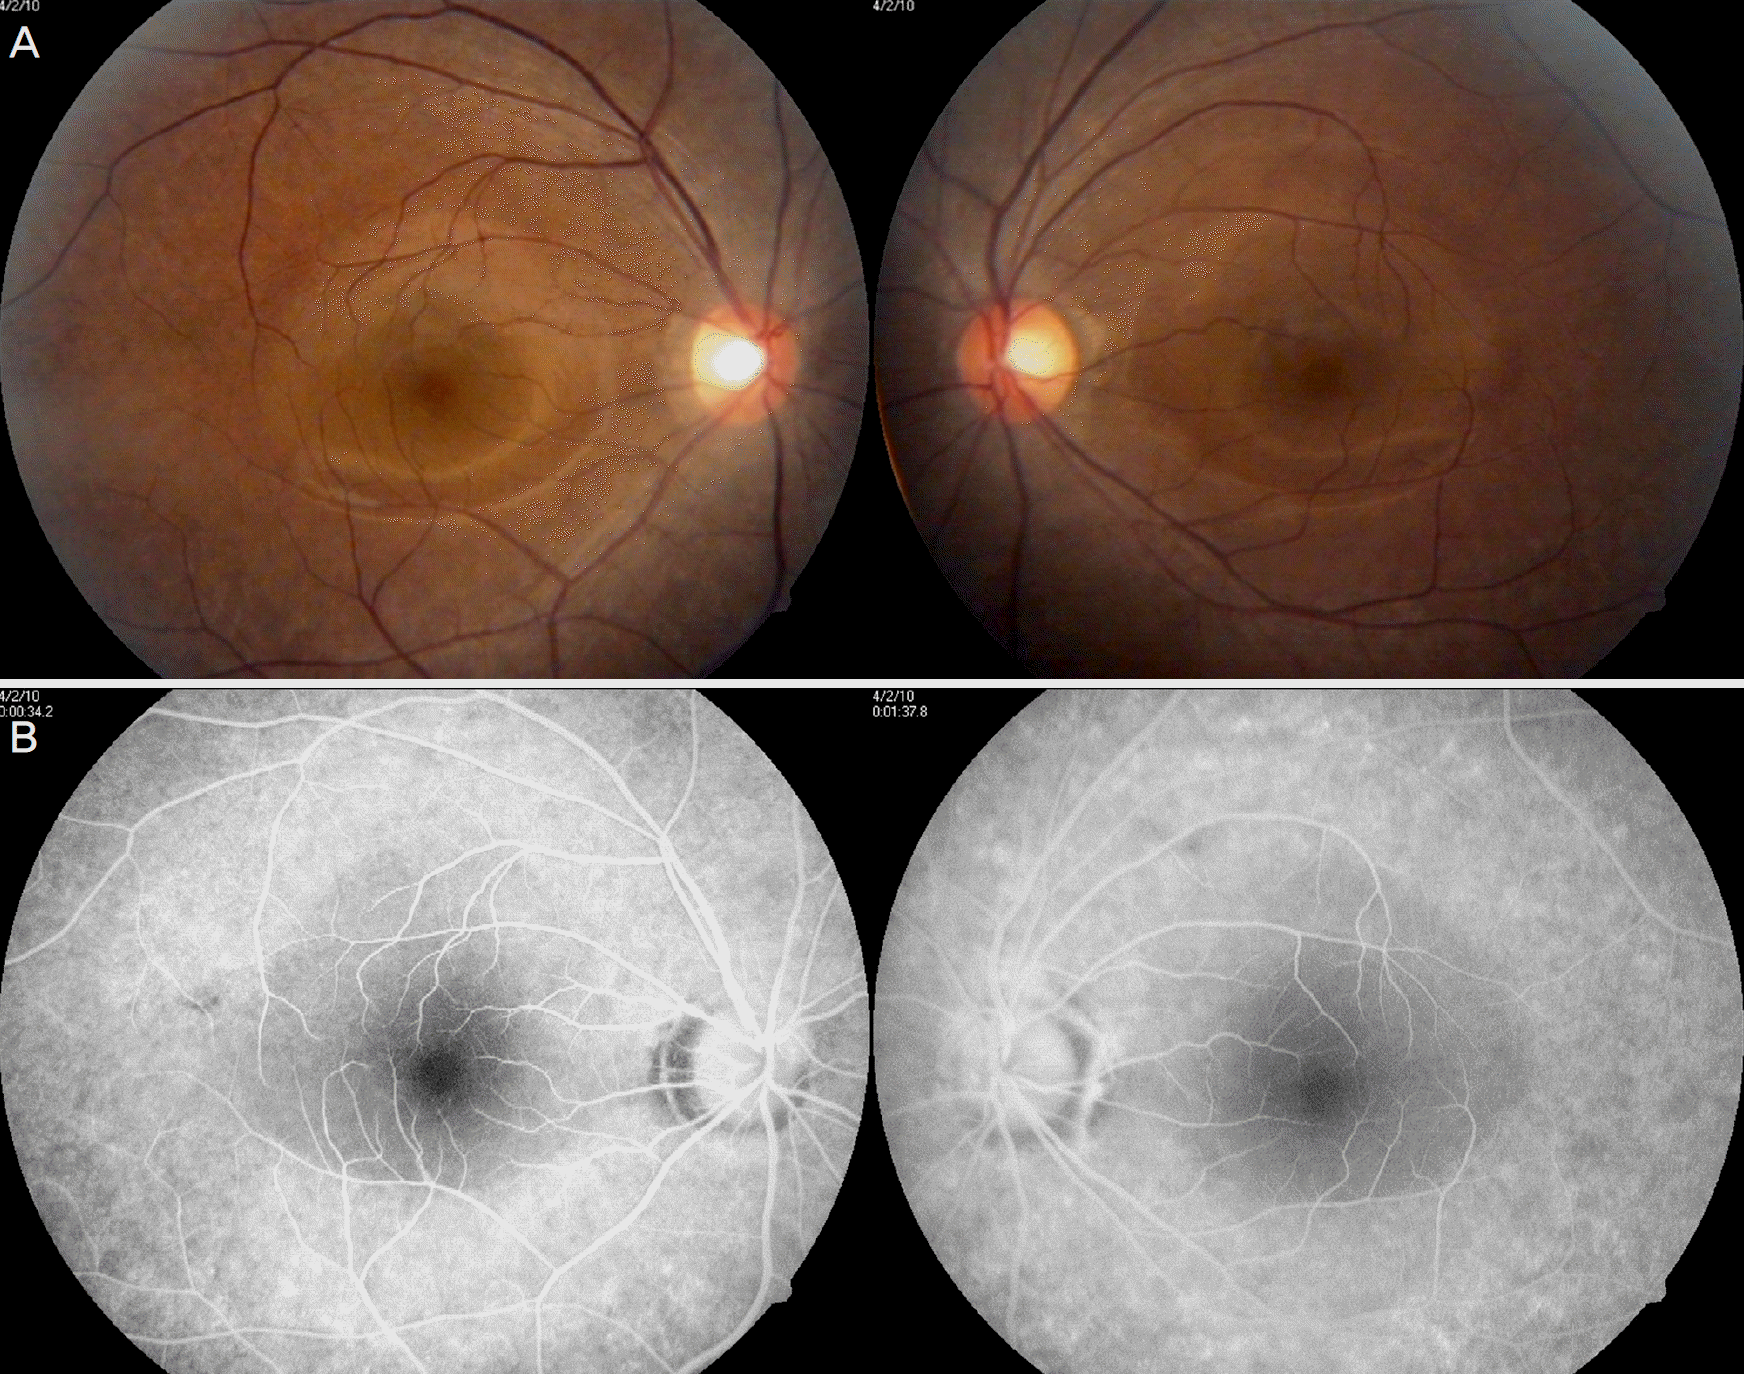 | Figure 3.Fundus photographs and Fluorescein angiographs. (A) The fundus photographs show retinal atrophic change along vascular arcade. (B) The fluorescein angiographs show window defect in retinal atrophic lesions. |
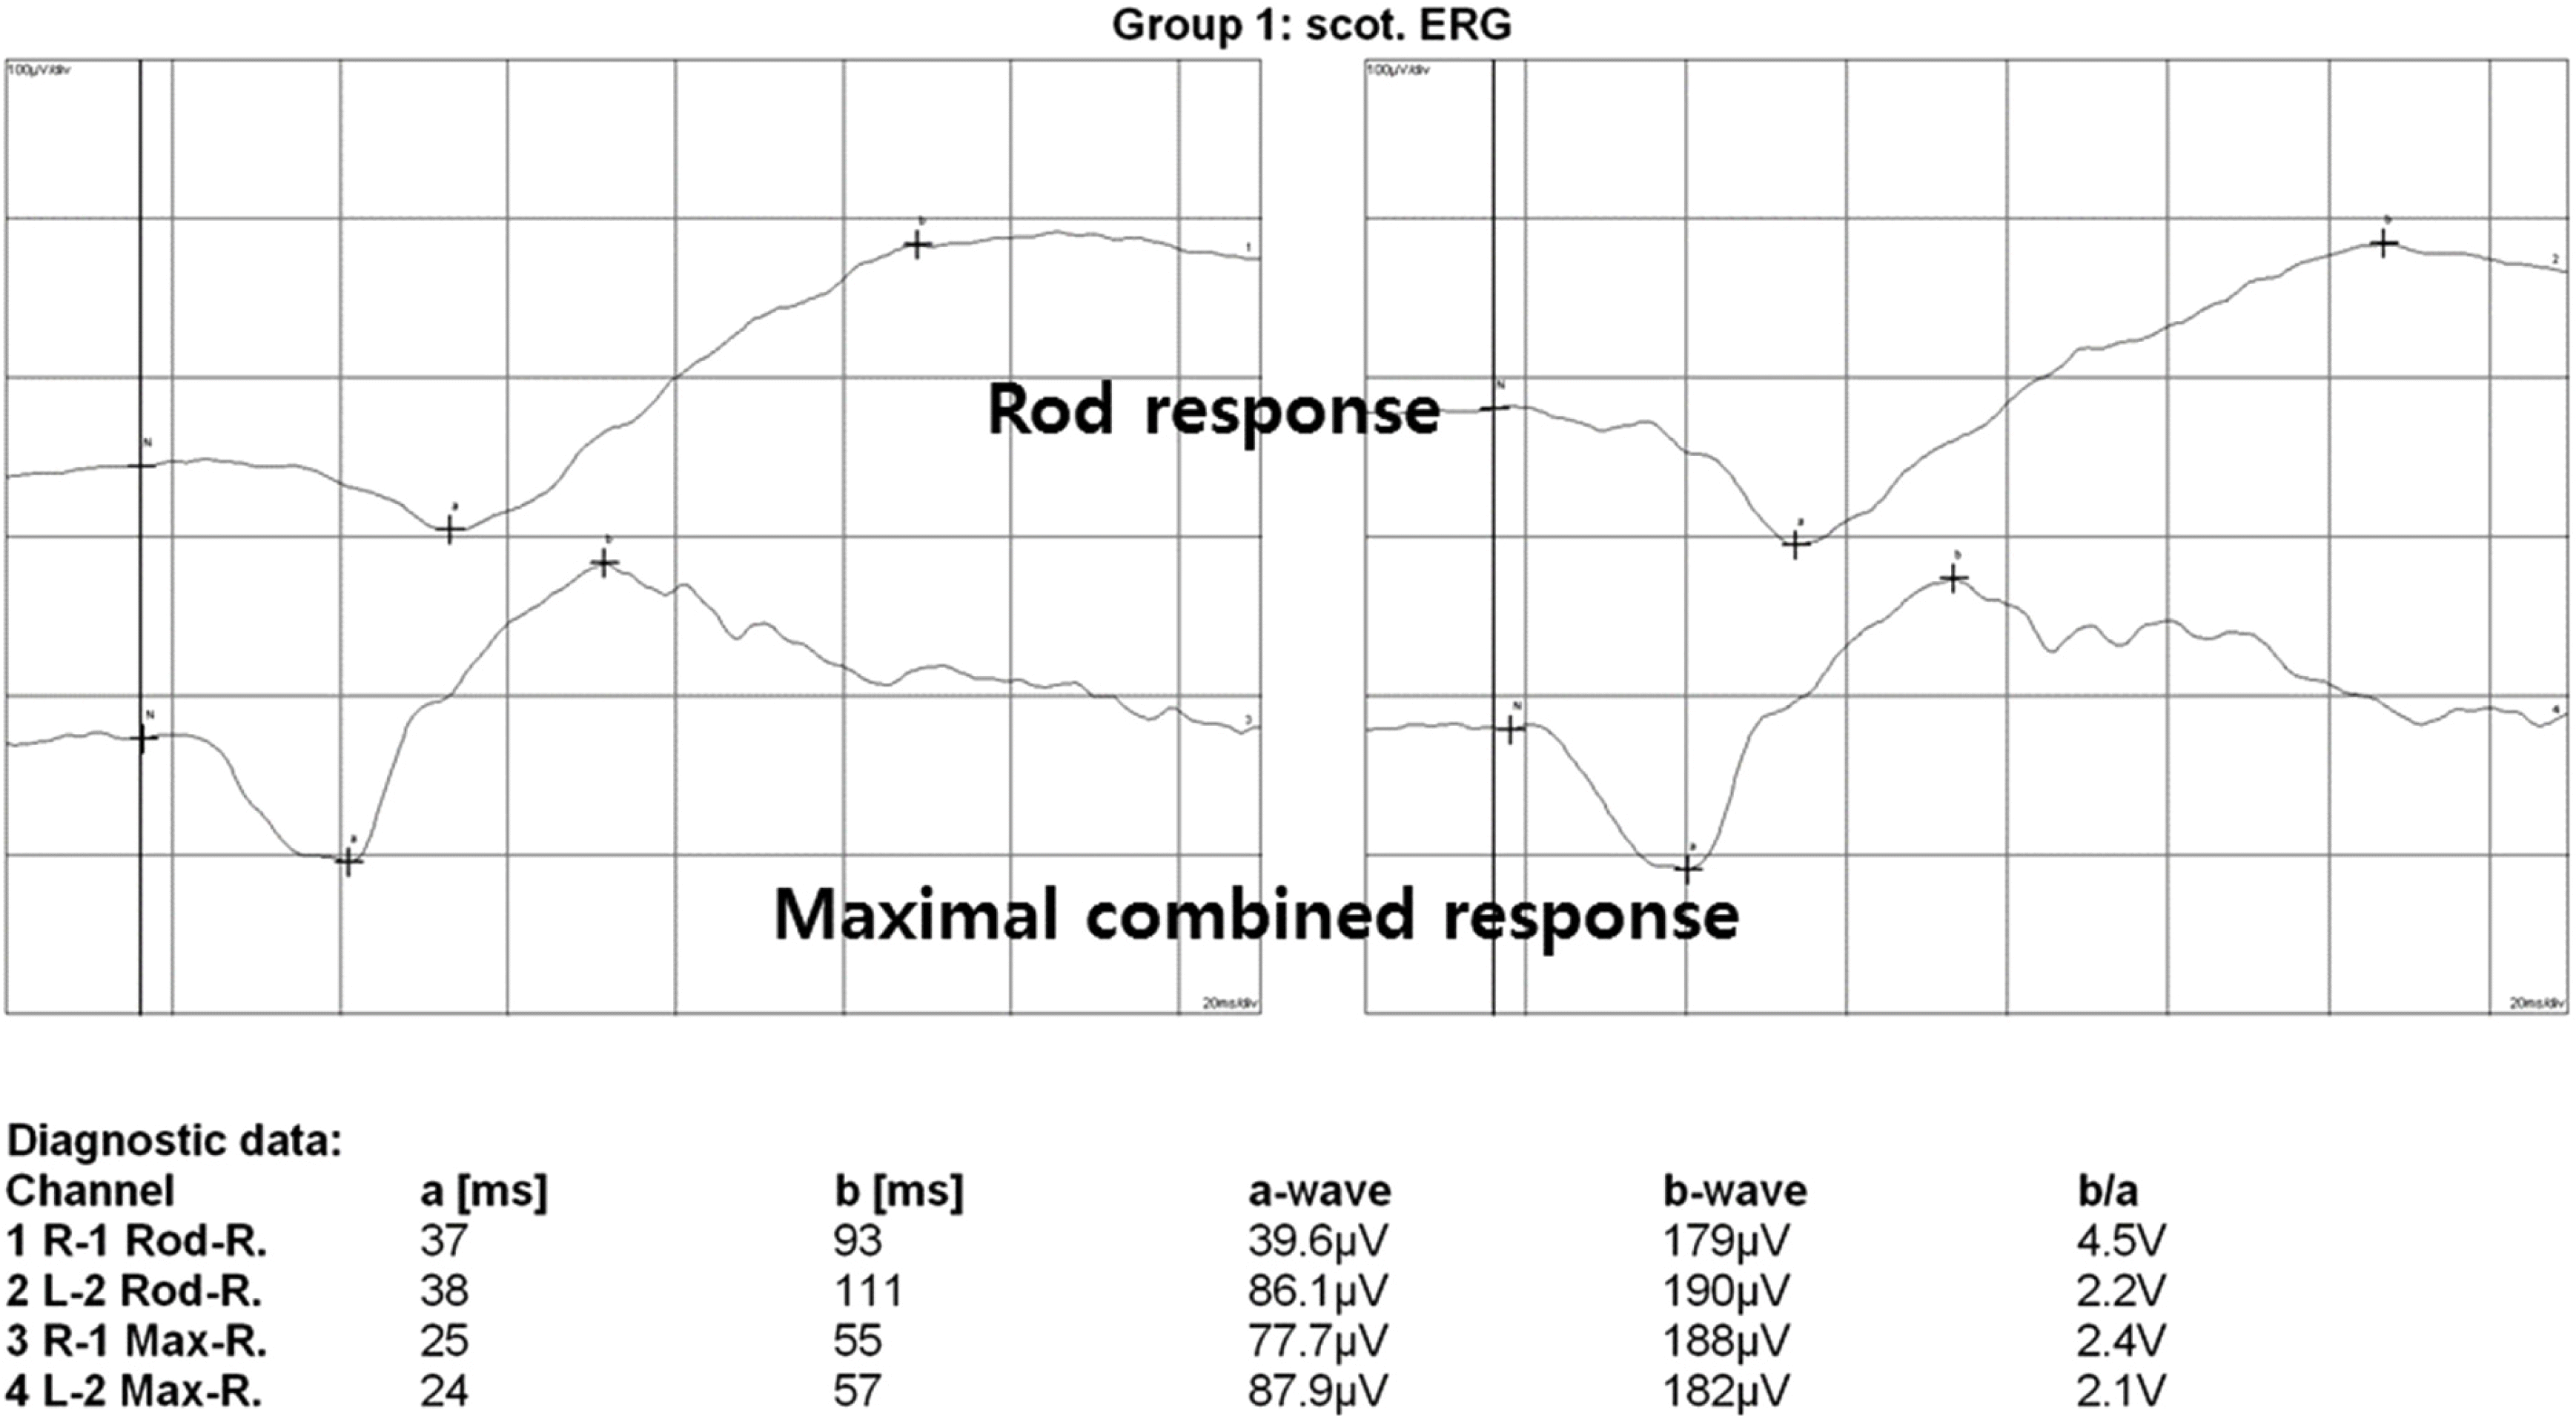 | Figure 4.The electroretinogram reveals decreased b wave amplitude of rod response and combined response in both eyes. ERG = electroretinogram. |


 PDF
PDF ePub
ePub Citation
 Print
Print


 XML Download