

 PDF
PDF ePub
ePub Citation
 Print
Print


Abstract
Purpose
To investigate the relationship between trans-lamina cribrosa pressure difference (TLCPD) and morphologic parameters of optic disc (OD) in normal tension glaucoma (NTG) patients.
Methods
Data from 31 NTG patients (31 eyes) and 29 controls (29 eyes) were analyzed retrospectively. Their cerebrospinal fluid pressure was estimated using diastolic pressure (DBP), body mass index (BMI) and age. TLCPD was defined as the difference of intraocular pressure (IOP) and the estimated cerebrospinal fluid pressure (ECSFP). Measurements of the rim area (RA), disc area (DA), average and vertical cup/disc (C/D) ratio, retinal nerve fiber layer thickness (RNFLT) and cup volume (CV) were taken for all patients using optical coherence tomography. The correlation between TLCPD and morphologic parameters of OD were assessed.
Results
There were no significant differences between the two groups in terms of age, DBP, IOP and spherical equivalent
(SE) and BMI. The mean ECSFP was significantly higher in the controls (10.7 ± 2.8 vs. 12.2 ± 2.2 mm Hg, p = 0.031) and TLCPD was significantly higher in patients (2.4 ± 2.1 vs. 4.9 ± 3.7 mm Hg, p = 0.002). In the NTG group, there was a negative correlation between TLCPD and RA (r = −0.595) and positive correlations between TLCPD and the average C/D ratio (r = 0.504), vertical C/D ratio (r = 0.434) and CV (r = 0.420). Average RNLFT was also significantly correlated with TLCPD (r = −0.500) and RNFLT for four quadrants, except the nasal quadrant, in NTG patients.
Go to : 
References
1. Berdahl JP, Allingham RR, Johnson DH. Cerebrospinal fluid abdominal is decreased in primary open-angle glaucoma. Ophthalmology. 2008; 115:763–8.
2. Jonas JB, Berenshtein E, Holbach L. Anatomic relationship abdominal lamina cribrosa, intraocular space, and cerebrospinal fluid space. Invest Ophthalmol Vis Sci. 2003; 44:5189–95.
3. Xie X, Zhang X, Fu J, et al. Noninvasive intracranial pressure abdominal by orbital subarachnoid space measurement: the Beijing Intracranial and Intraocular Pressure (iCOP) study. Crit Care. 2013; 17:R162.
4. Jonas JB, Wang N, Wang YX, et al. Body height, estimated abdominal fluid pressure and open-angle glaucoma. The Beijing Eye Study 2011. PLoS One. 2014; 9:e86678.
5. Garvin MK, Abràmoff MD, Wu X, et el. Automated 3-D abdominal layer segmentation of macular spectraldomain optical abdominal tomography images. IEEE Trans Med Imaging. 2009; 28:1436–47.
6. Shpak AA, Sevostyanova MK, Ogorodnikova SN, Shormaz IN. Comparison of measurement error of Cirrus HD-OCT and Heidelberg Retina Tomograph 3 in patients with early abdominal visual field defect. Graefes Arch Clin Exp Ophthalmol. 2012; 250:271–7.
7. Sommer A, Katz J, Quigley HA, et al. Clinically detectable nerve fiber atrophy precedes the onset of glaucomatous field loss. Arch Ophthalmol. 1991; 109:77–83.

8. Kim CS, Seong GJ, Lee NH, et al. Prevalence of primary open-angle glaucoma in central South Korea the Namil study. Ophthalmology. 2011; 118:1024–30.
9. Leske MC, Wu SY, Hennis A, et al. Risk factors for incident open-angle glaucoma: the Barbados Eye Studies. Ophthalmology. 2008; 115:85–93.
10. Ren R, Wang N, Zhang X, et al. Trans-lamina cribrosa pressure abdominal correlated with neuroretinal rim area in glaucoma. Graefes Arch Clin Exp Ophthalmol. 2011; 249:1057–63.
11. Jonas JB, Gründler AE, Gonzales-Cortés J. Pressure-dependent abdominal rim loss in normal-pressure glaucoma. Am J Ophthalmol. 1998; 125:137–44.
12. Morgan WH, Yu DY, Cooper RL, et al. The influence of abdominal fluid pressure on the lamina cribrosa tissue pressure gradient. Invest Ophthalmol Vis Sci. 1995; 36:1163–72.
13. Berdahl JP, Fautsch MP, Stinnett SS, Allingham RR. Intracranial pressure in primary open angle glaucoma, normal tension glaucoma, and ocular hypertension: a case-control study. Invest Ophthalmol Vis Sci. 2008; 49:5412–8.
14. Ren R, Jonas JB, Tian G, et al. Cerebrospinal fluid pressure in abdominal: a prospective study. Ophthalmology. 2010; 117:259–66.
15. Jonas JB, Nangia V, Wang N, et al. Trans-lamina cribrosa pressure difference and open-angle glaucoma. The central India eye and medical study. PLoS One. 2013; 8:e82284.
Go to :
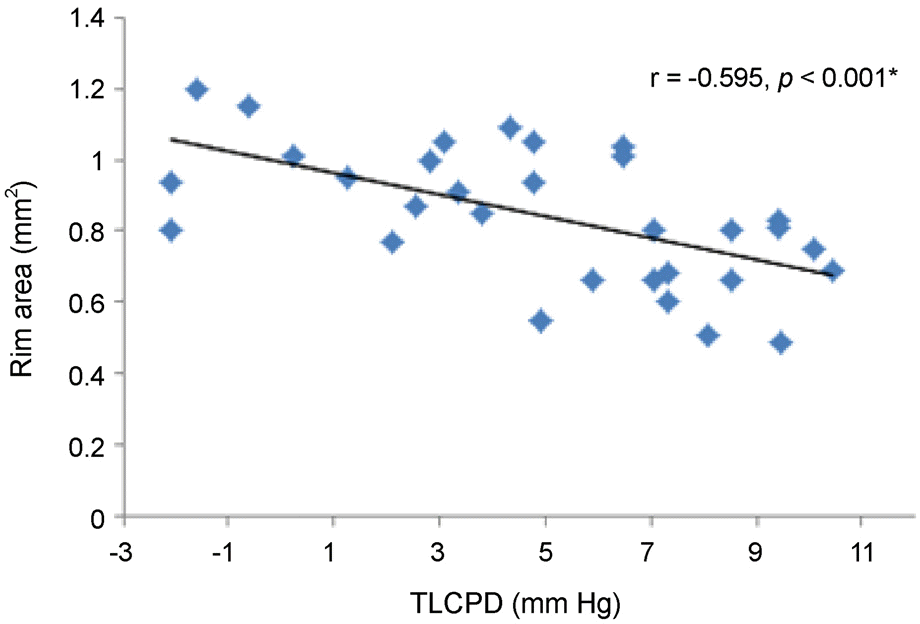 | Figure 1.The relationship between trans lamina cribrosa pressure difference (TLCPD) and rim area in normal tension glaucoma patients. r = Pearson's correlation coefficient. * p-value by Pearson's correlation analysis. |
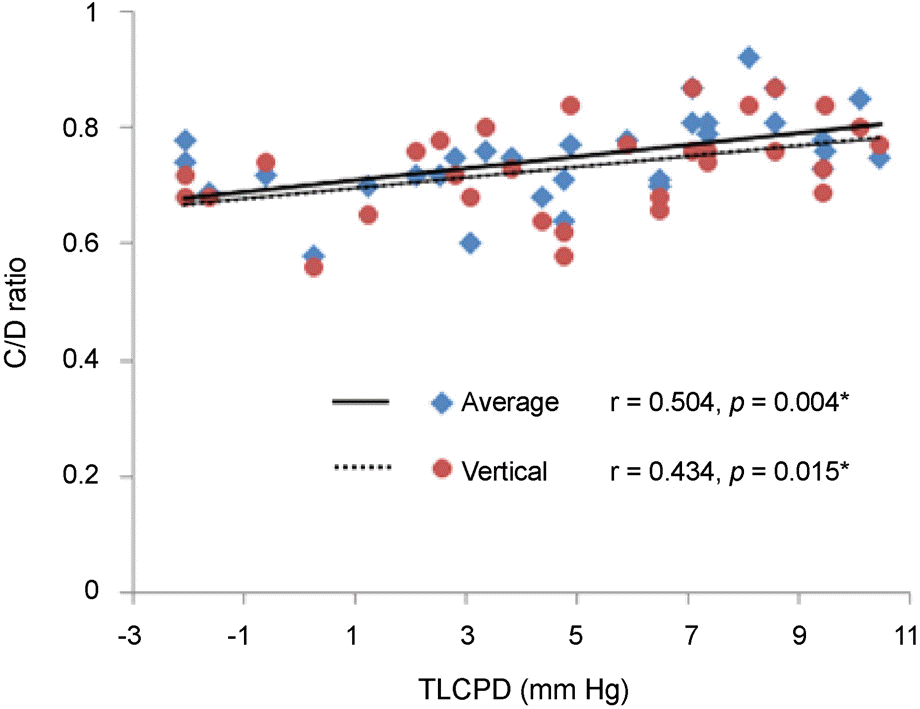 | Figure 2.The relationship between trans lamina cribrosa pressure difference (TLCPD) and cup/disc (C/D) ratio in normal tension glaucoma patients. r = Pearson's correlation coefficient. * p-value by Pearson's correlation analysis. |
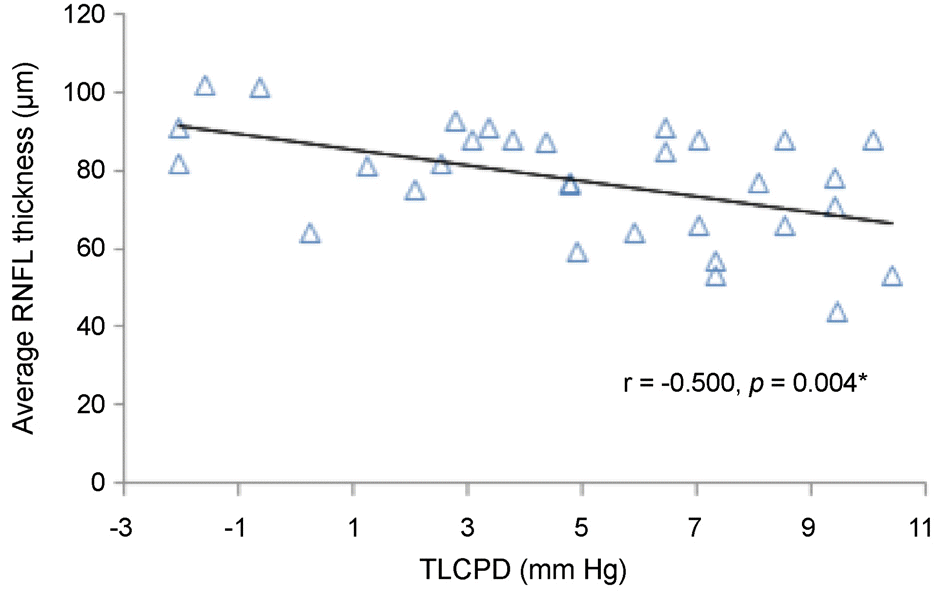 | Figure 3.The relationship between trans lamina cribrosa pressure difference (TLCPD) and average retinal nerve fiber layer (RNFL) thickness in normal tension glaucoma patients. r = Pearson's correlation coefficient. * p-value by Pearson's correlation analysis |
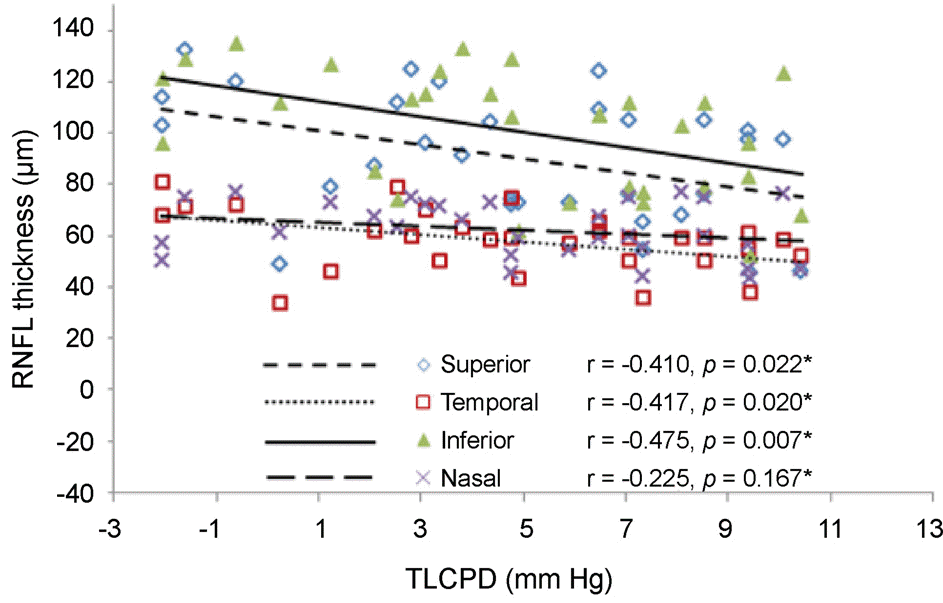 | Figure 4.The relationship between trans lamina cribrosa pressure difference (TLCPD) and average retinal nerve fiber layer (RNFL) thicknesses of 4 quadrant in normal tension glaucoma * p-value by patients. r = Pearson's correlation coefficient. pearson's correlation analysis. |
Table 1.
Clinical and ophthalmic characteristics of control and normal tension glaucoma (NTG) patient group
| Control | NTG patients | p-value | |
|---|---|---|---|
| Age (years) | 50.14 ± 11.62 | 53.10 ± 9.28 | 0.279* |
| Sex (n, %) | 0.782† | ||
| Male | 13 (45.8) | 15 (48.4) | |
| Female | 16 (55.2) | 16 (51.6) | |
| BMI (kg/m2) | 24.42 ± 2.93 | 22.28 ± 3.27 | 0.100* |
| DBP (mm Hg) | 77.24 ± 6.95 | 77.42 ± 9.78 | 0.936* |
| ECSFP (mm Hg) | 12.18 ± 2.20 | 10.73 ± 2.79 | 0.031* |
| TLCPG (mm Hg) | 2.37 ± 2.14 | 4.94 ± 3.71 | 0.002* |
| IOP (mm Hg) | 14.55 ± 2.64 | 15.68 ± 2.47 | 0.093* |
| SE (diopter) | –0.90 ± 1.77 | –1.87 ± 2.01 | 0.051* |
| Rim area (μ m2) | 1.33 ± 0.18 | 0.84 ± 0.19 | <0.001* |
| Disc area (μ m2) | 2.04 ± 0.45 | 1.99 ± 0.39 | 0.639* |
| Average C/D ratio | 0.56 ± 0.13 | 0.75 ± 0.07 | <0.001* |
| Vertical C/D ratio | 0.52 ± 0.13 | 0.73 ± 0.08 | <0.001* |
| Average RNFLT (μ m) | 98.83 ± 8.60 | 77.61 ± 14.67 | <0.001* |
| Nasal RNFLT (μ m) | 68.10 ± 9.86 | 62.29 ± 11.07 | 0.037* |
| Temporal RNFLT (μ m) | 77.76 ± 12.75 | 57.68 ± 12.30 | <0.001* |
| Superior RNFLT (μ m) | 120.90 ± 14.67 | 90.07 ± 24.61 | <0.001* |
| Inferior RNFLT (μ m) | 127.10 ± 14.25 | 100.65 ± 23.32 | <0.001* |
| Cup volume (μ m3) | 0.24 ± 0.18 | 0.58 ± 0.36 | <0.001* |
Table 2.
Associations between rim area, disc area, average and vertical cup/disc (C/D) ratio, retinal nerve fiber layer thickness (RNFLT), cup volume, IOP, TLCPD and ECSFP in NTG patient group
| r | p-value* | ||
|---|---|---|---|
| Rim area correlated with | IOP | –0.317 | 0.082 |
| ECSFP | 0.511 | 0.003 | |
| TLCPD | –0.595 | <0.001 | |
| Disc area correlated with | IOP | 0.278 | 0.131 |
| ECSFP | 0.119 | 0.523 | |
| TLCPD | 0.095 | 0.611 | |
| Average C/D ratio correlated with | IOP | 0.406 | 0.024 |
| ECSFP | –0.312 | 0.087 | |
| TLCPD | 0.504 | 0.004 | |
| Vertical C/D ratio correlated with | IOP | 0.243 | 0.188 |
| ECSFP | –0.363 | 0.045 | |
| TLCPD | 0.434 | 0.015 | |
| Average RNFLT (μ m) correlated with | IOP | –0.141 | 0.450 |
| ECSFP | 0.540 | 0.002 | |
| TLCPD | –0.500 | 0.004 | |
| Inferior RNFLT (μ m) correlated with | IOP | –0.162 | 0.384 |
| ECSFP | 0.489 | 0.005 | |
| TLCPD | –0.475 | 0.007 | |
| Superior RNFLT (μ m) correlated with | IOP | –0.142 | 0.445 |
| ECSFP | 0.420 | 0.019 | |
| TLCPD | –0.410 | 0.022 | |
| Nasal RNFLT (μ m) correlated with | IOP | –0.104 | 0.578 |
| ECSFP | 0.247 | 0.181 | |
| TLCPD | –0.255 | 0.167 | |
| Temporal RNFLT (μ m) correlated with | IOP | –0.002 | 0.990 |
| ECSFP | 0.555 | 0.001 | |
| TLCPD | –0.417 | 0.020 | |
| Cup volume (mm3) correlated with | IOP | 0.371 | 0.040 |
| ECSFP | –0.230 | 0.213 | |
| TLCPD | 0.420 | 0.019 |
Table 3.
Associations between rim area, disc area, average and vertical cup/disc (C/D) ratio, retinal nerve fiber layer thickness (RNFLT) thickness, cup volume, intraocular pressure (IOP), trans lamina cribrosa pressure difference (TLCPD) and estimated cerebrospinal fluid pressure (ECSFP) in control group
| r | p-value* | ||
|---|---|---|---|
| Rim area correlated with | IOP | 0.004 | 0.982 |
| ECSFP | 0.133 | 0.492 | |
| TLCPD | –0.131 | 0.497 | |
| Disc area correlated with | IOP | –0.119 | 0.539 |
| ECSFP | –0.422 | 0.023 | |
| TLCPD | 0.288 | 0.130 | |
| Average C/D ratio correlated with | IOP | –0.102 | 0.600 |
| ECSFP | –0.380 | 0.042 | |
| TLCPD | 0.267 | 0.162 | |
| Vertical C/D ratio correlated with | IOP | –0.010 | 0.957 |
| ECSFP | –0.245 | 0.200 | |
| TLCPD | 0.240 | 0.210 | |
| Average RNFLT (μ m) correlated with | IOP | 0.107 | 0.582 |
| ECSFP | 0.174 | 0.367 | |
| TLCPD | –0.048 | 0.807 | |
| Inferior RNFLT (μ m) correlated with | IOP | 0.256 | 0.181 |
| ECSFP | 0.444 | 0.016 | |
| TLCPD | –0.142 | 0.463 | |
| Superior RNFLT (μ m) correlated with | IOP | –0.054 | 0.782 |
| ECSFP | 0.093 | 0.632 | |
| TLCPD | –0.162 | 0.401 | |
| Nasal RNFLT (μ m) correlated with | IOP | 0.005 | 0.981 |
| ECSFP | –0.285 | 0.134 | |
| TLCPD | 0.299 | 0.115 | |
| Temporal RNFLT (μ m) correlated with | IOP | 0.072 | 0.710 |
| ECSFP | 0.130 | 0.500 | |
| TLCPD | –0.046 | 0.814 | |
| Cup volume (mm3) correlated with | IOP | –0.001 | 0.997 |
| ECSFP | –0.380 | 0.042 | |
| TLCPD | 0.391 | 0.036 |
 XML Download