

 PDF
PDF ePub
ePub Citation
 Print
Print


Abstract
Purpose
To analyze the recovery course of foveal microstructures and evaluate the important structures for visual improvement after vitrectomy for full thickness macular hole (MH) using optical coherence tomography (OCT).
Methods
We retrospectively reviewed the medical records of 34 cases with idiopathic macular hole. We investigated the healing process of foveal microstructures and visual acuity pre- and post-operatively at 1, 3, 6, 12 months after surgery. We evaluated the integrity of four factors by OCT image: existence of MH (Hole, H1,3,6,12), recovery of outer nuclear layer (ONL, O1,3,6,12), recovery of external limiting membrane (ELM, E1,3,6,12), and recovery of inner segment-outer segment (IS/OS) line of the photoreceptor (Photoreceptor, P1,3,6,12). We compared the recovery course and visual acuity of the four groups based on postoperative 12 months.
Results: The mean observed period was 1.85 ± 2.59 months at recovery of ONL, 3.78 ± 3.83 months at recovery of ONL and ELM, and 7.40 ± 3.56 months at recovery of ONL, ELM and IS/OS line. A t postoperative 12 months, the best corrected visual acuity (BCVA) of Groups E and P were better than that of Groups H and O (p < 0.05). Except for group H, all groups had improved BCVA at postoperative 12 months compared to preoperative BCVA (p < 0.05).
Go to : 
References
1. la Cour M, Friis J. Macular holes: classification, epidemiology, abdominal history and treatment. Acta Ophthalmol Scand. 2002; 80:579–87.
2. Gaudric A, Haouchine B, Massin P, et al. Mauclar hole formation: new data provided by optical coherence tomography. Arch abdominal. 1999; 117:744–51.
3. Haouchine B, Massin P, Gaudric A. Foveal pseudocyst as the first step in macular hole formation: a prospective study by optical abdominal tomography. Ophthalmology. 2001; 108:15–22.
4. Takahashi A, Nagaoka T, Ishiko S, et al. Foveal anatomic changes in a progressing stage 1 macular hole documented by spectral-abdominal optical coherence tomography. Ophthalmology. 2010; 117:806–10.
5. Benson WE, Cruickshanks KC, Fong DS, et al. Surgical abdominal of macular holes: a report by the American Academy of Ophthalmology. Ophthalmology. 2001; 108:1328–35.
6. Tognetto D, Grandin R, Sanguinetti G, et al. Internal limiting abdominal removal during macular hole surgery: results of a multicenter retrospective study. Ophthalmology. 2006; 113:1401–10.
7. Brooks HL Jr. Macular hole surgery with and without internal abdominal membrane peeling. Ophthalmology. 2000; 107:1939–48. abdominal 1948–9.
8. Thompson JT, Smiddy WE, Glaser BM, et al. Intraocular abdominal duration and success of macular hole surgery. Retina. 1996; 16:373–82.
9. Ip MS, Baker BJ, Duker JS, et al. Anatomical outcomes of surgery for idiopathic macular hole as determined by optical coherence tomography. Arch Ophthalmol. 2002; 120:29–35.

10. Tornambe PE, Poliner LS, Grote K. Macular hole surgery without abdominal positioning. A pilot study. Retina. 1997; 17:179–85.
11. Kitaya N, Hikichi T, Kagokawa H, et al. Irregularity of photo-receptor layer after successful macular hole surgery prevents visual acuity improvement. Am J Ophthalmol. 2004; 138:308–10.
12. Lee JE, Lee SU, Jea SY, et al. Reorganization of photoreceptor layer on optical coherence tomography concurrent with visual abdominal after macular hole surgery. Korean J Ophthalmol. 2008; 22:137–42.
13. Tornambe PE, Poliner LS, Cohen RG. Definition of macular hole surgery end points: elevated/open, flat/open, flat/closed. Retina. 1998; 18:286–7.
14. Sano M, Inoue M, Taniuchi S, et al. Ability to determine abdominal status of macular hole in gas-filled eyes by spectral-abdominal optical coherence tomography. Clin Experiment Ophthalmol. 2011; 39:885–92.
15. Shah SP, Manjunath V, Rogers AH, et al. Optical coherence abdominal-guided facedown positioning for macular hole surgery. Retina. 2013; 33:356–62.
16. Park SM, Cho SW, Lee TG. Swept source optical coherence abdominal findings in gas-filled eyes after macular hole surgery. J Korean Ophthalmol Soc. 2015; 56:1386–91.
17. Bottoni F, De Angelis S, Luccarelli S, et al. The dynamic healing process of idiopathic macular holes after surgical repair: a abdominal-domain optical coherence tomography study. Invest Ophthalmol Vis Sci. 2011; 52:4439–46.
18. Jeong SH, Kim JH, Kim JW, et al. abdominal changes in foveal abdominal after macular hole surgery. J Korean Ophthalmol Soc. 2013; 54:1731–6.
19. Madreperla SA, Geiger GL, Funata M, et al. Clinicopathologic abdominal of a macular hole treated by cortical vitreous peeling and gas tamponade. Ophthalmology. 1994; 101:682–6.
20. Wakabayashi T, Fujiwara M, Sakaguchi H, et al. Foveal abdominal and visual acuity in surgically closed macular holes: abdominal-domain optical coherence tomographic analysis. Ophthalmology. 2010; 117:1815–24.
21. Sano M, Shimoda Y, Hashimoto H, Kishi S. Restored photo-receptor outer segment and visual recovery after macular hole closure. Am J Ophthalmol. 2009; 147:313–8.e1.
22. Ooka E, Mitamura Y, Baba T, et al. Foveal microstructure on abdominal-domain optical coherence tomographic images and visual function after macular hole surgery. Am J Ophthalmol. 2011; 152:283–90.e1.
23. Purtskhvanidze K, Treumer F, Junge O, et al. The long-term course of functional and anatomical recovery after macular hole surgery. Invest Ophthalmol Vis Sci. 2013; 54:4882–91.
24. Itoh Y, Inoue M, Rii T, et al. Significant correlation between visual acuity and recovery of foveal cone microstructures after macular hole surgery. Am J Ophthalmol. 2012; 153:111–9.
Go to :
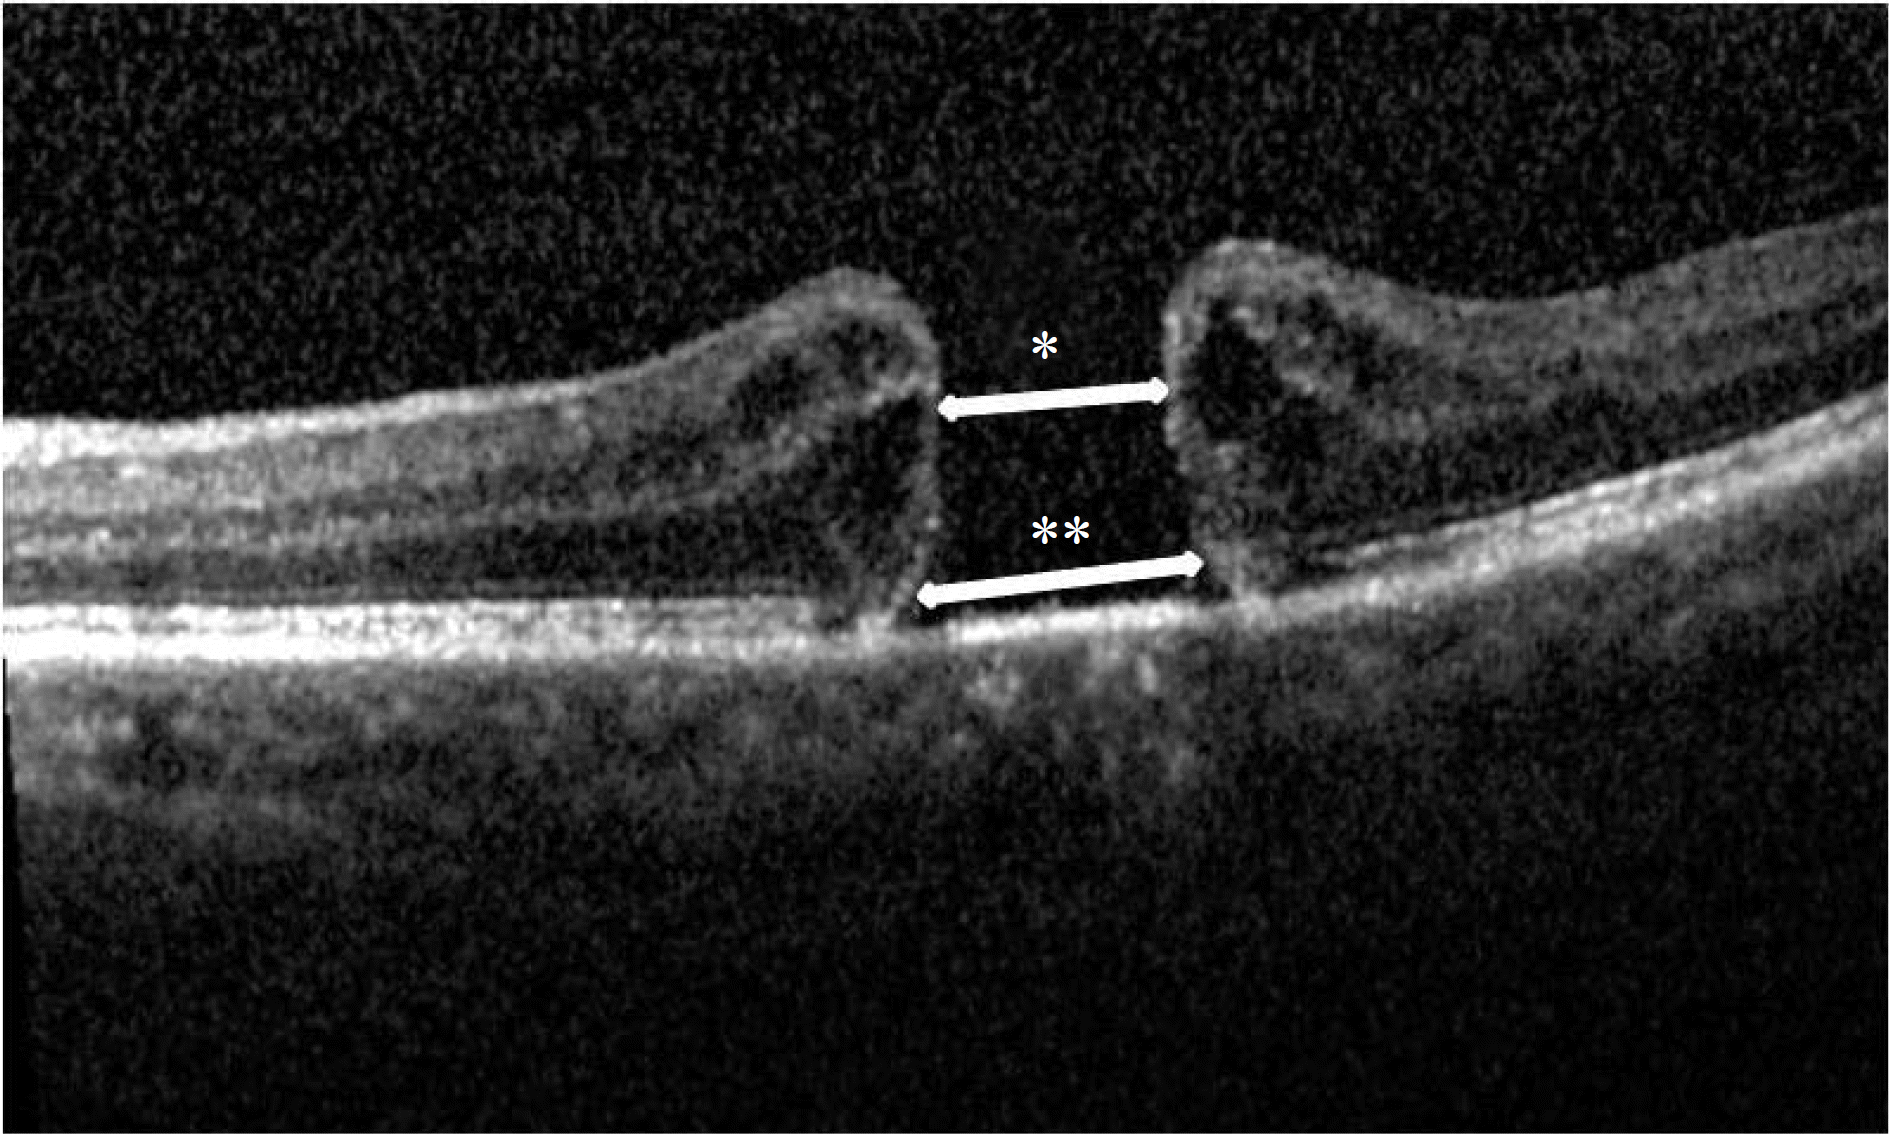 | Figure 1.Size parameters of macular hole on spectral domain optical coherence tomography. (*) indicates a minimum diam-eter of macular hole, (**) indicates a base diameter of macular hole. |
 | Figure 2.Spectral domain optical coherence tomography (SD-OCT) serial images obtained from patients during 12 months fol-low-up period. (A-E) is a case of group H in 54-year-old female. OCT images showed preoperative state (A), postoperative 1 month (B), 3 months (C), 6 months (D), 12 months (E). SD-OCT images of Group H showed still exist of macular hole at postoperative 12 months (E). (F-J) is a case of group O in 54-year-old female. OCT images showed preoperative state (F), postoperative 1 month (G), 3 months (H), 6 months (I), 12 months (J). SD-OCT images of Group O showed that only outer nuclear layer was restored at postoperative 12 months (J). (K-O) is a case of group E in 54-year-old female. OCT images showed preoperative state (K), post-operative 1 month (L), 3 months (M), 6 months (N), 12 months (O). SD-OCT images of Group E showed that the outer nuclear layer and external limiting membrane were restored at postoperative 12 months (O). (P-T) is a case of group P in 54-year-old female. OCT images showed preoperative state (P), postoperative 1 month (Q), 3 months (R), 6 months (S), 12 months (T). SD-OCT images of Group P showed completely recovery of normal foveal architecture state at postoperative 12 months (T). |
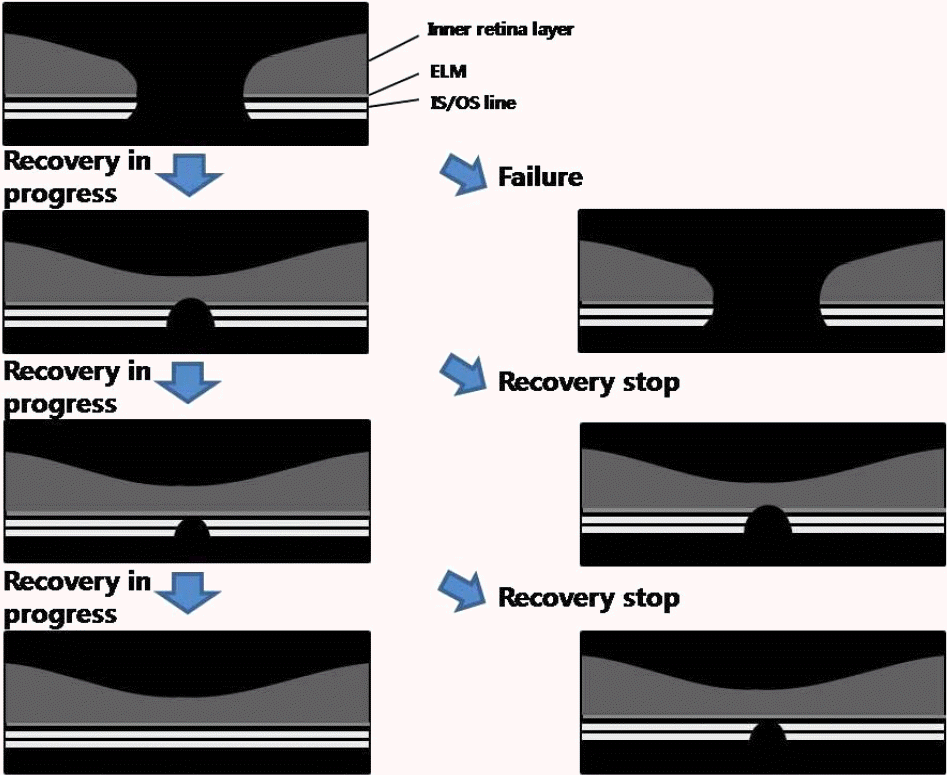 | Figure 3.Schematic drawing of the various macular hole healing process after surgery. Left images showed recovery in progress. Right top image showed failed processes and right middle and bottom images showed recovery stop. ELM = external limiting membrane; IS/OS = inner segment/outer segment of photoreceptor. |
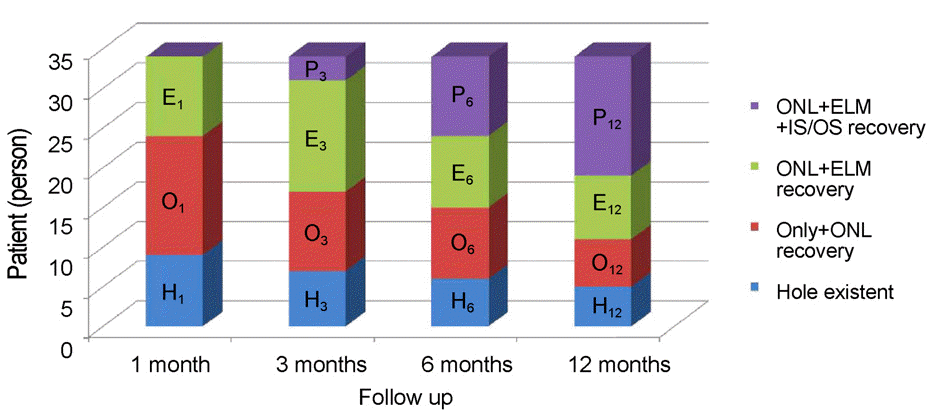 | Figure 4.Changes of foveal microstructures after macular hole surgery during follow up. Over the follow-up period (1, 3, 6, 12 months) after operation, foveal microstructures had been gradually restored. H1, H3, H6, H12 mean still a existence of macular hole (Hole) at the follow-up period. O1, O3, O6, O12 mean only recovery state of outer nuclear layer (ONL). E1, E3, E6, E12 mean recovery state of outer nuclear layer and external limiting membrane (ELM). P1, P3, P6, P12 mean recovery state of outer nuclear layer and external limiting membrane and inner segment-outer segment line of photoreceptor (photoreceptor). IS/OS = inner segment/outer segment of photoreceptor. |
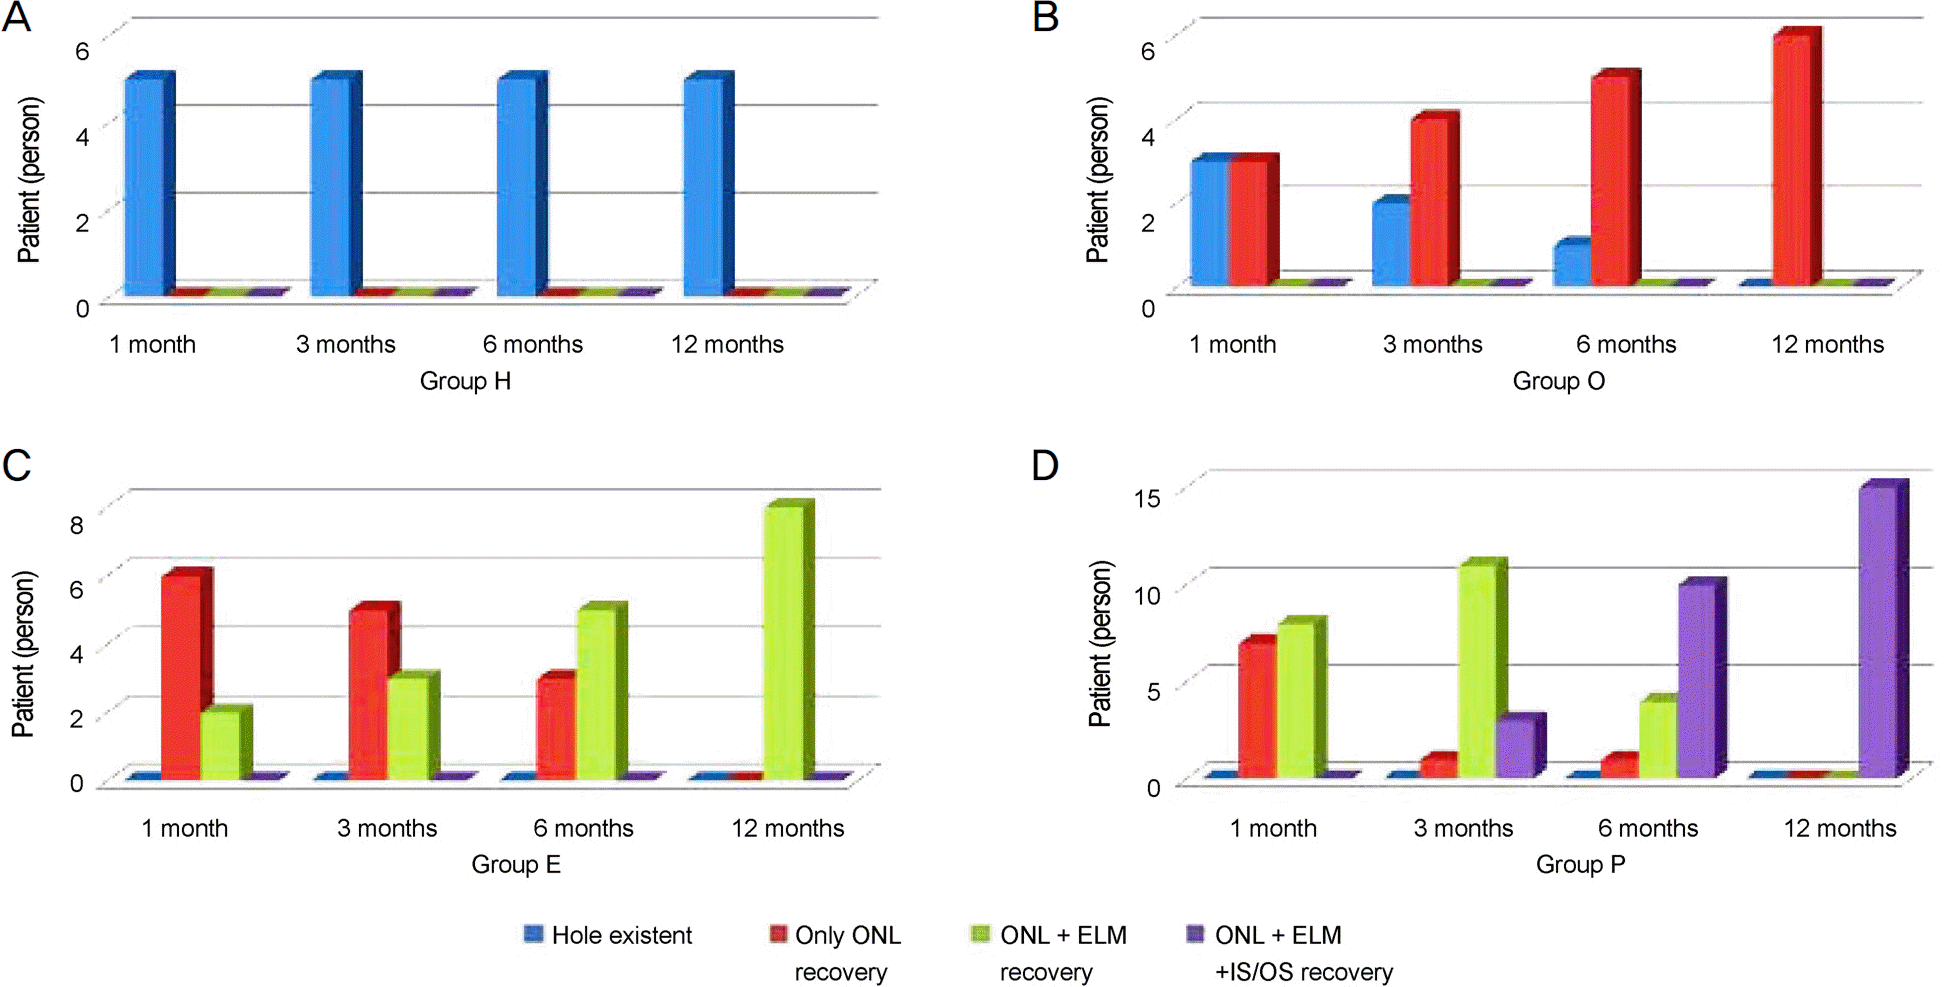 | Figure 5.Changes of foveal microstructures after macular hole surgery of each group that divided by based on the foveal micro-structure status at 12 months. Group H (A) was not changed during the follow-up period after operation. Group O (B) was changed gradually decreasing hole existent state but increasing recovery of outer nuclear layer. Group E (C) was changed gradually increasing recovery of external limiting membrane. Group P (D) was changed gradually increasing recovery of inner segment-outer segment line of photoreceptor. Hole = macular hole; ONL = outer nuclear layer; ELM = external limiting membrane; IS/OS = inner segment/outer segment of photoreceptor. |
Table 1.
Comparison of visual acuity and period for each step during follow up periods (1, 3, 6, 12 months)
| Variables | Not recovery (Hole existent) (n = 26) | ONL recovery (n = 41) | ONL + ELM recovery (n = 41) | ONL + ELM + IS/OS recovery (n = 28) | * p-value |
|---|---|---|---|---|---|
| Postop BCVA (log MAR) | 1.25 ± 0.45 | 0.87 ± 0.40 | 0.43 ± 0.46 | 0.29 ± 0.29 | <0.001 |
| Mean duration (months) | – | 1.94 ± 2.71 | 3.75 ± 3.75 | 7.40 ± 3.56 |
Table 2.
Comparative characteristics of preoperative state of the four groups group that divided by based on the foveal microstructure status at 12 months
| Variables | Group H (n = 5) | Group O (n = 6) | Group E (n = 8) | Group P (n = 15) | * p-value |
|---|---|---|---|---|---|
| Age (years) | 64.8 ± 14.95 | 68.5 ± 13.39 | 62.37 ± 5.04 | 64.33 ± 7.59 | |
| Male:female | 1:4 | 3:3 | 2:6 | 3:12 | |
| Preop BCVA (log MAR) | 1.30 ± 0.36 | 1.02 ± 0.40 | 0.86 ± 0.35 | 0.91 ± 0.37 | 0.264 |
| MH size | |||||
| Base diameter (μ m) | 1,258.2 ± 437.81 | 988.16 ± 272.70 | 889.62 ± 323.52 | 555.86 ± 293.36 | 0.003 |
| Minimum diameter (μ m) | 760 ± 217.03 | 516.16 ± 199.62 | 473.37 ± 179.55 | 286.53 ± 203.18 | 0.004 |
| Preoprative lens state | |||||
| Phakia (%) | 4 (80) | 2 (33) | 8 (100) | 14 (93) | |
| Pseudophakia (%) | 1 (20) | 4 (67) | 0 (0) | 1 (6.6) | |
| Axial length (mm) | 24.56 ± 3.81 | 24.69 ± 3.38 | 22.72 ± 0.90 | 23.50 ± 0.86 | 0.187 |
Table 3.
Comparative characteristics of postoprative state and change of visual acuity after the surgery of the four groups that divided by based on the foveal microstructure status at 12 months
| Variables | Group H (n = 5) | Group O (n = 6) | Group E (n = 8) | Group P (n = 15) | * p-value |
|---|---|---|---|---|---|
| Postop BCVA (log MAR) | |||||
| POD 1 month | 1.42 ± 0.43 | 1.12 ± 0.45 | 1.35 ± 0.45 | 0.61 ± 0.50 | 0.060 |
| POD 3 months | 1.22 ± 0.45 | 1.07 ± 0.32 | 0.60 ± 0.30 | 0.43 ± 0.14 | 0.002 |
| POD 6 months | 1.14 ± 0.54 | 0.92 ± 0.34 | 0.39 ± 0.28 | 0.32 ± 0.34 | 0.003 |
| POD 12 months | 1.20 ± 0.59 | 0.79 ± 0.27† | 0.26 ± 0.19† | 0.30 ± 0.35† | 0.001 |
| Combined cataract surgery (%) | 4 (80) | 2 (33) | 8 (100) | 13 (87) | |
| Complication | |||||
| ERM (%) | 0 | 0 | 0 | 2 (13.3) |
Postop = postoperative; BCVA = best corrected visual acuity; log MAR = logarithm of the minimal angle resolution; POD = postoperative day; ERM = epiretinal membrane.
 XML Download