

 PDF
PDF ePub
ePub Citation
 Print
Print


Abstract
Purpose
To evaluate the effect of instrument aging on optical coherence tomography (OCT) measurements.
Methods
Single eyes of 60 healthy participants (60 eyes) aged 20–30 years were examined twice using a 5-year-old OCT instrument and a new OCT instrument (Carl Zeiss Meditec, Dublin, CA, USA). The measurements and changes in signal strength were investigated using both instruments.
Results
The signal strengths of the new and aged instruments were 8.6 ± 0.8 and 5.0 ± 1.0, respectively, which was a statistically significant difference (p < 0.001). In addition, the central macular thicknesses (CMT) of the new and aged instruments were 201.1 ± 16.1 μ m and 210.3 ± 16.0 μ m, respectively. The thickness was significantly greater using the aged instrument (p < 0.001). Repeated measurements within the same eye were compared, and the difference in CMT was 3.2 using the new instrument and 10.5 using the aged instrument (p < 0.05). The intraclass correlation coefficient (ICC) was compared to evaluate the reproducibility of each instrument. The ICC values of nine areas of Early Treatment Diabetic Retinopathy Study in the aged instrument were 0.371–0.872, indicating low reproducibility. However, the new instrument showed high reproducibility with values of 0.806–0.947.
Conclusions
Higher signal strength and lower CMT were observed using the new instrument compared to the aged instrument. Additionally, there were no differences in signal strength errors between the instruments. However, the error in CMT measured using the new instrument was significantly smaller compared to that using the aged instrument. Therefore, the effect of instrument aging should be accounted for in analyses of OCT measurements.
Go to : 
References
1. Huynh SC, Wang XY, Burlutsky G, et al. Retinal and optic disc findings in adolescence: a population-based OCT study. Invest Ophthalmol Vis Sci. 2008; 49:4328–35.

2. Stein DM, Ishikawa H, Hariprasad R, et al. A new quality abdominal parameter for optical coherence tomography. Br J Ophthalmol. 2006; 90:186–90.
3. Savini G, Zanini M, Barboni P. Influence of pupil size and cataract on retinal nerve fiber layer thickness measurements by Stratus OCT. J Glaucoma. 2006; 15:336–40.
4. El-Ashry M, Appaswamy S, Deokule S, Pagliarini S. The effect of phacoemulsification cataract surgery on the measurement of retinal nerve fiber layer thickness using optical coherence tomography. Curr Eye Res. 2006; 31:409–13.
5. Stein DM, Wollstein G, Ishikawa H, et al. Effect of corneal drying on optical coherence tomography. Ophthalmology. 2006; 113:985–91.
6. van Velthoven ME, van der Linden MH, de Smet MD, et al. Influence of cataract on optical coherence tomography image abdominal and retinal thickness. Br J Ophthalmol. 2006; 90:1259–62.
7. Smith M, Frost A, Graham CM, Shaw S. Effect of pupillary dilatation on glaucoma assessments using optical coherence tomography. Br J Ophthalmol. 2007; 91:1686–90.
8. Kremser B, Troger J, Baltaci M, et al. Retinal thickness analysis in subjects with different refractive conditions. Ophthalmologica. 1999; 213:376–9.
9. Wakitani Y, Sasoh M, Sugimoto M, et al. Macular thickness abdominals in healthy subjects with different axial lengths using abdominal coherence tomography. Retina. 2003; 23:177–82.
10. Mrugacz M, Bakunowicz-Lazarczyk A, Sredzinska-Kita D. Use of optical coherence tomography in myopia. J Pediatr Ophthalmol Strabismus. 2004; 41:159–62.
11. Lim MC, Hoh ST, Foster PJ, et al. Use of optical coherence abdominal to assess variations in macular retinal thickness in myopia. Invest Ophthalmol Vis Sci. 2005; 46:974–8.
12. Huynh SC, Wang XY, Rochtchina E, Mitchell P. Distribution of macular thickness by optical coherence tomography: findings from a population-based study of 6-year-old children. Invest Ophthalmol Vis Sci. 2006; 47:2351–7.
13. Samarawickrama C, Pai A, Huynh SC, et al. Influence of OCT abdominal strength on macular, optic nerve head, and retinal nerve fiber layer parameters. Invest Ophthalmol Vis Sci. 2010; 51:4471–5.
14. Cheung CY, Leung CK, Lin D, et al. Relationship between retinal nerve fiber layer measurement and signal strength in optical abdominal tomography. Ophthalmology. 2008; 115:1347–51. 1351.e1–2.
15. Wu Z, Huang J, Dustin L, Sadda SR. Signal strength is an abdominal determinant of accuracy of nerve fiber layer thickness measurement by optical coherence tomography. J Glaucoma. 2009; 18:213–6.
16. Bourne RR, Medeiros FA, Bowd C, et al. Comparability of retinal nerve fiber layer thickness measurements of optical coherence abdominal instruments. Invest Ophthalmol Vis Sci. 2005; 46:1280–5.
17. Furuichi M, Kashiwagi K, Tsukahara S. Variance between program versions in measuring optic nerve fiber layer thickness using abdominal coherence tomography. Ophthalmologica. 2002; 216:409–14.
Go to :
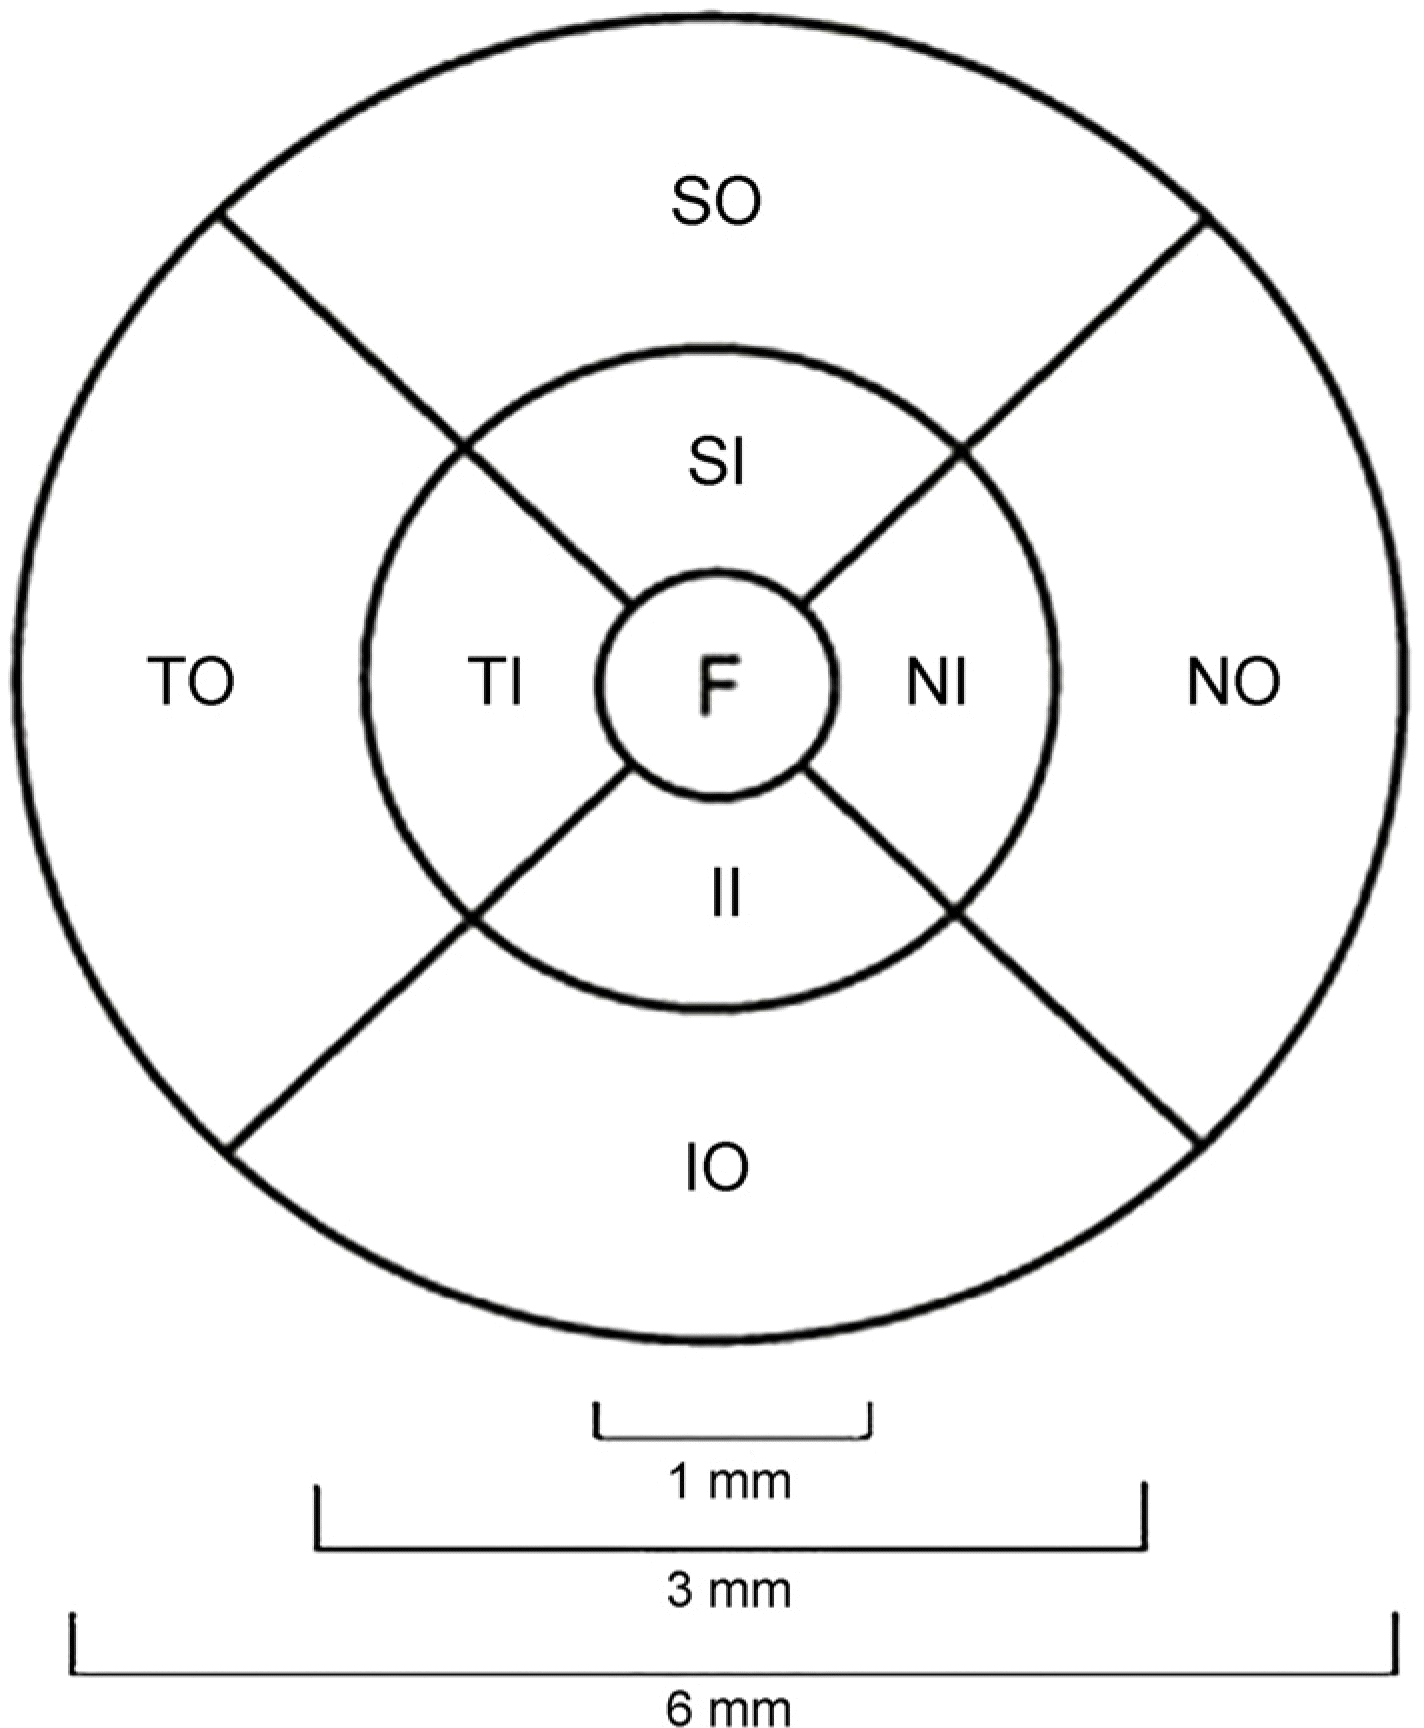 | Figure 1.The nine Early Treatment Diabetic Retinopathy Study (ETDRS) subfield area. The diameters of central circle, inner ring, and outer ring were 1 mm, 3 mm, and 6 mm, respectively. F = fovea; SI = superior inner; TI = temporal inner; II = inferior inner; NI = nasal inner; SO = superior outer; TO = temporal outer; IO = inferior outer; NO = nasal outer. |
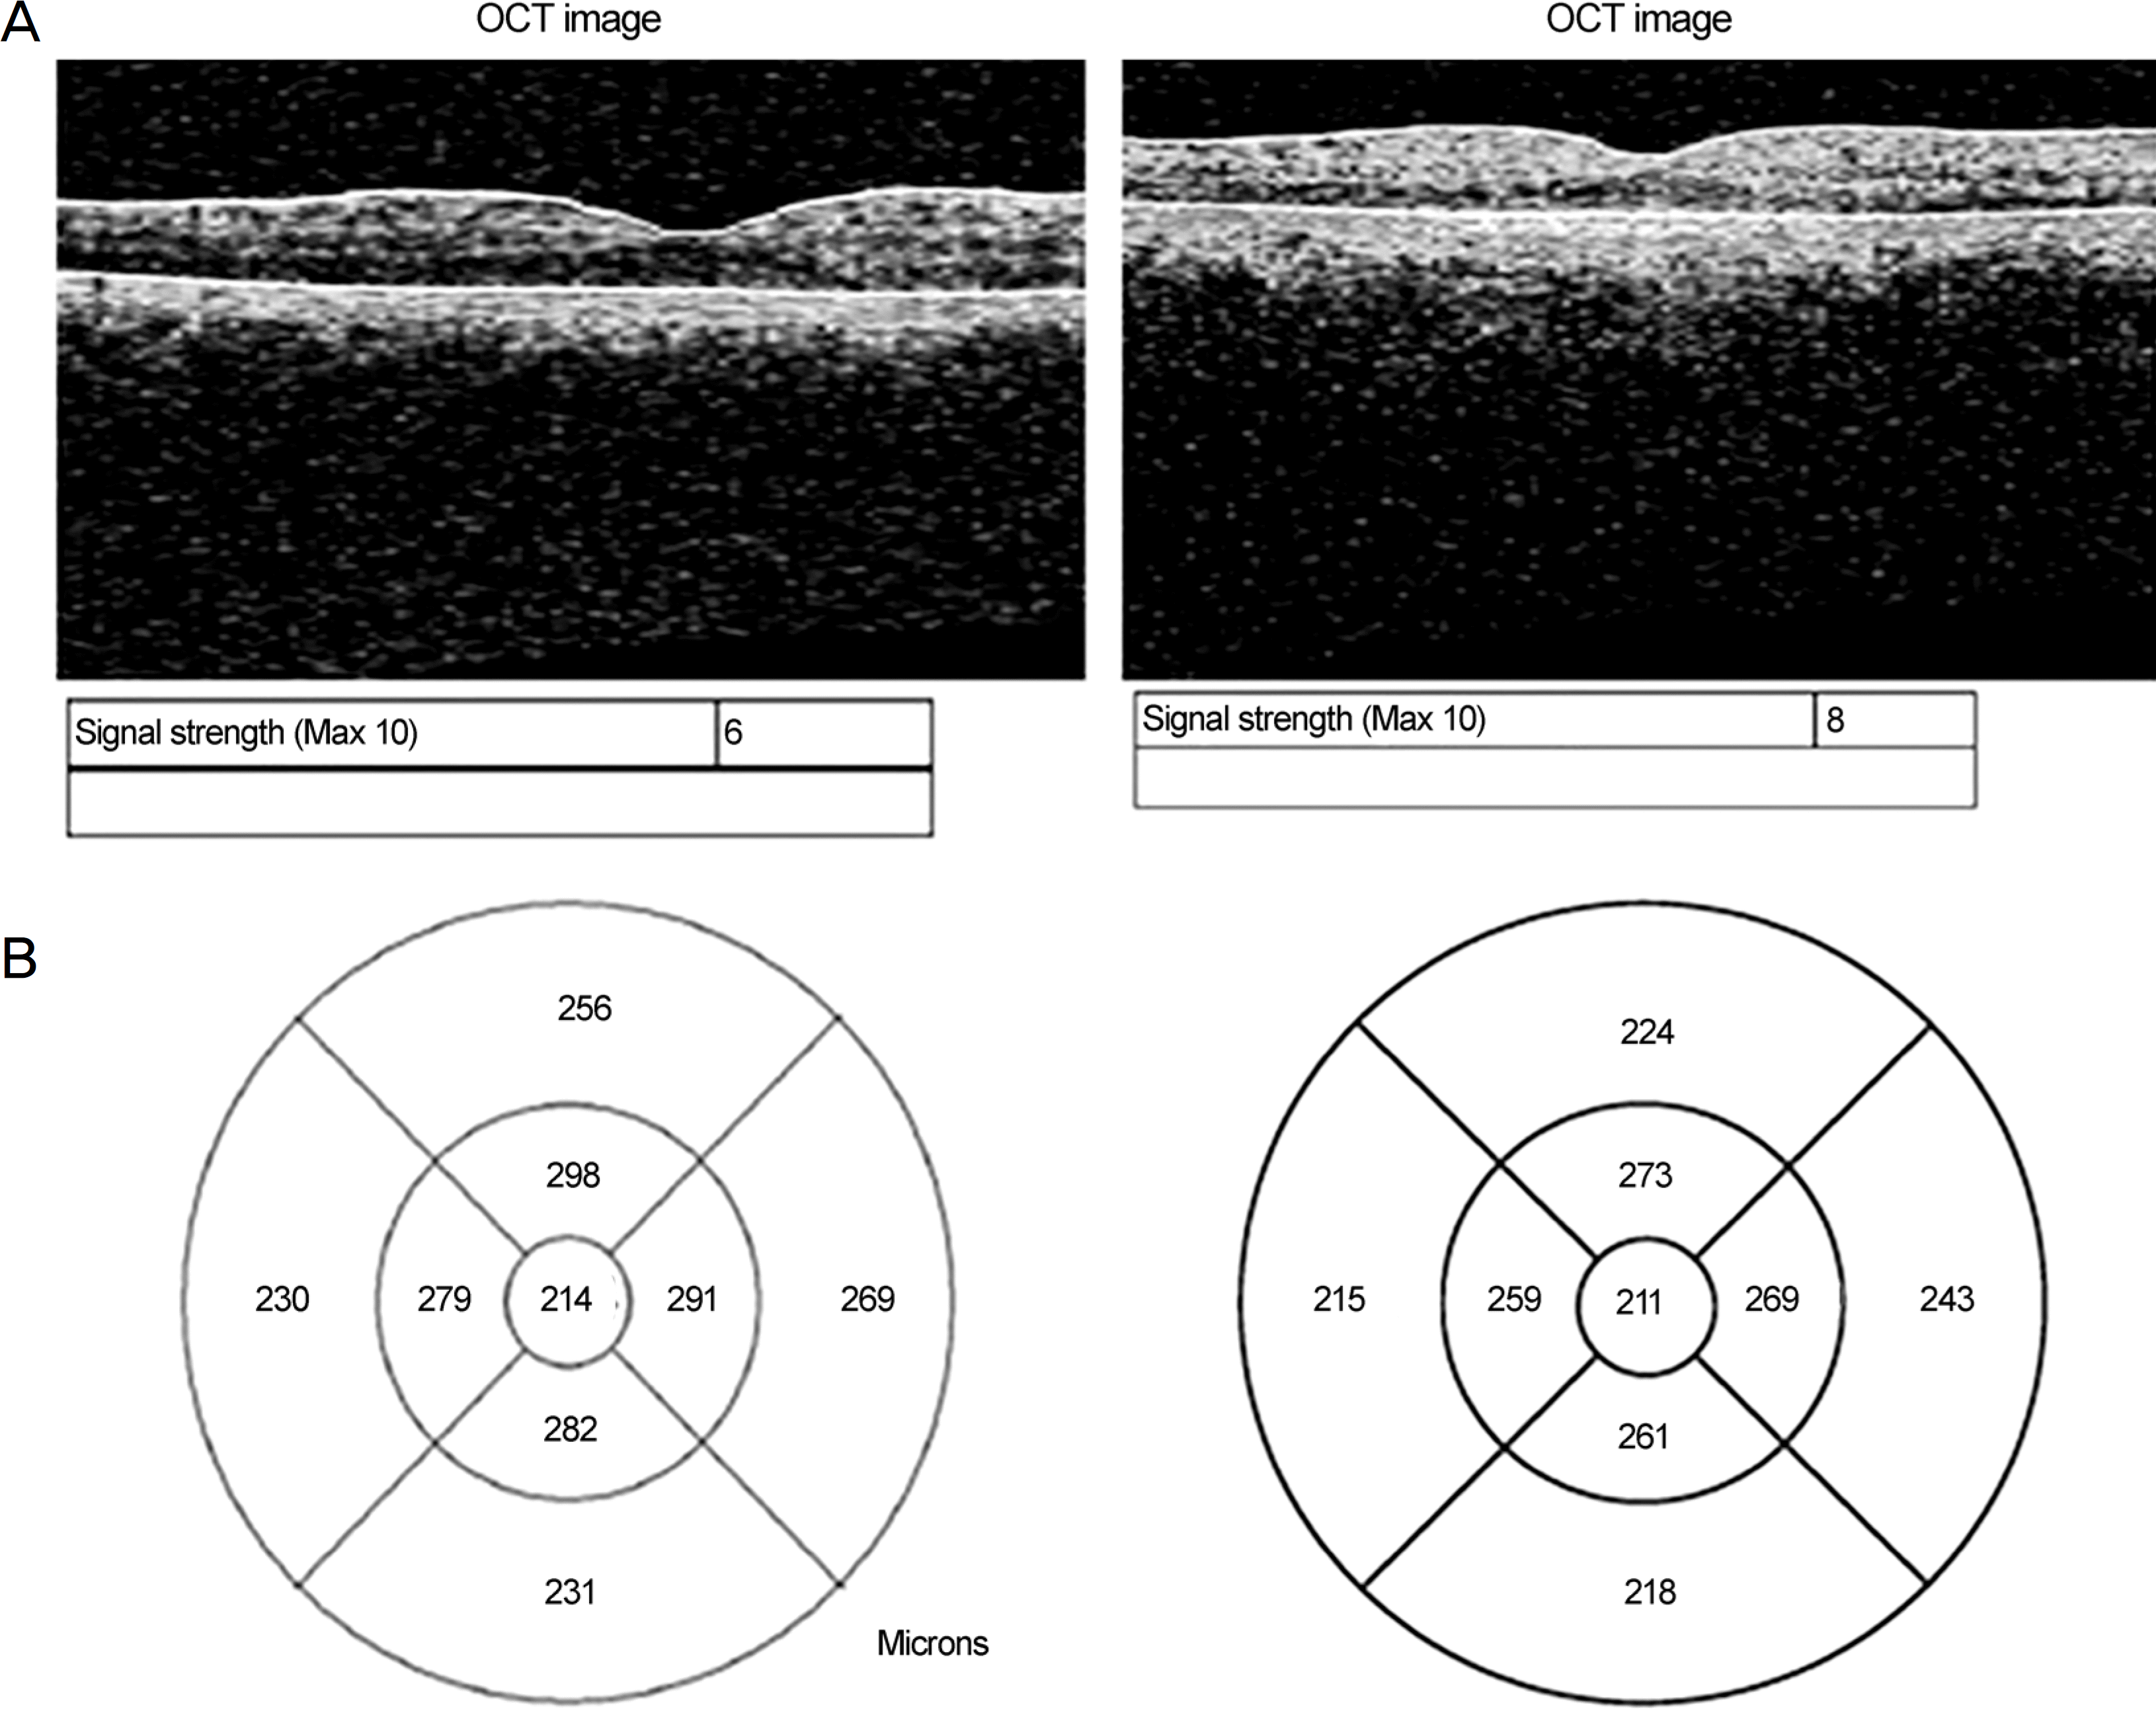 | Figure 2.Representative images from one patient using aged instrument and new instrument. (A) Signal strengths measured using the aged instrument (left) and the new instrument (right). (B) Fast macular thickness maps measured using the old instrument (left) and the new instrument (right). OCT = optical coherence tomography. |
Table 1.
Patient demographics
Table 2.
Signal strength and macular thickness values
Table 3.
Differences in signal strength and macular thickness values after repeated measurements
Table 4.
Intraclass correlation coefficient of macular thickness between the aged and new instruments
 XML Download