Abstract
Purpose
Methods
Results
References
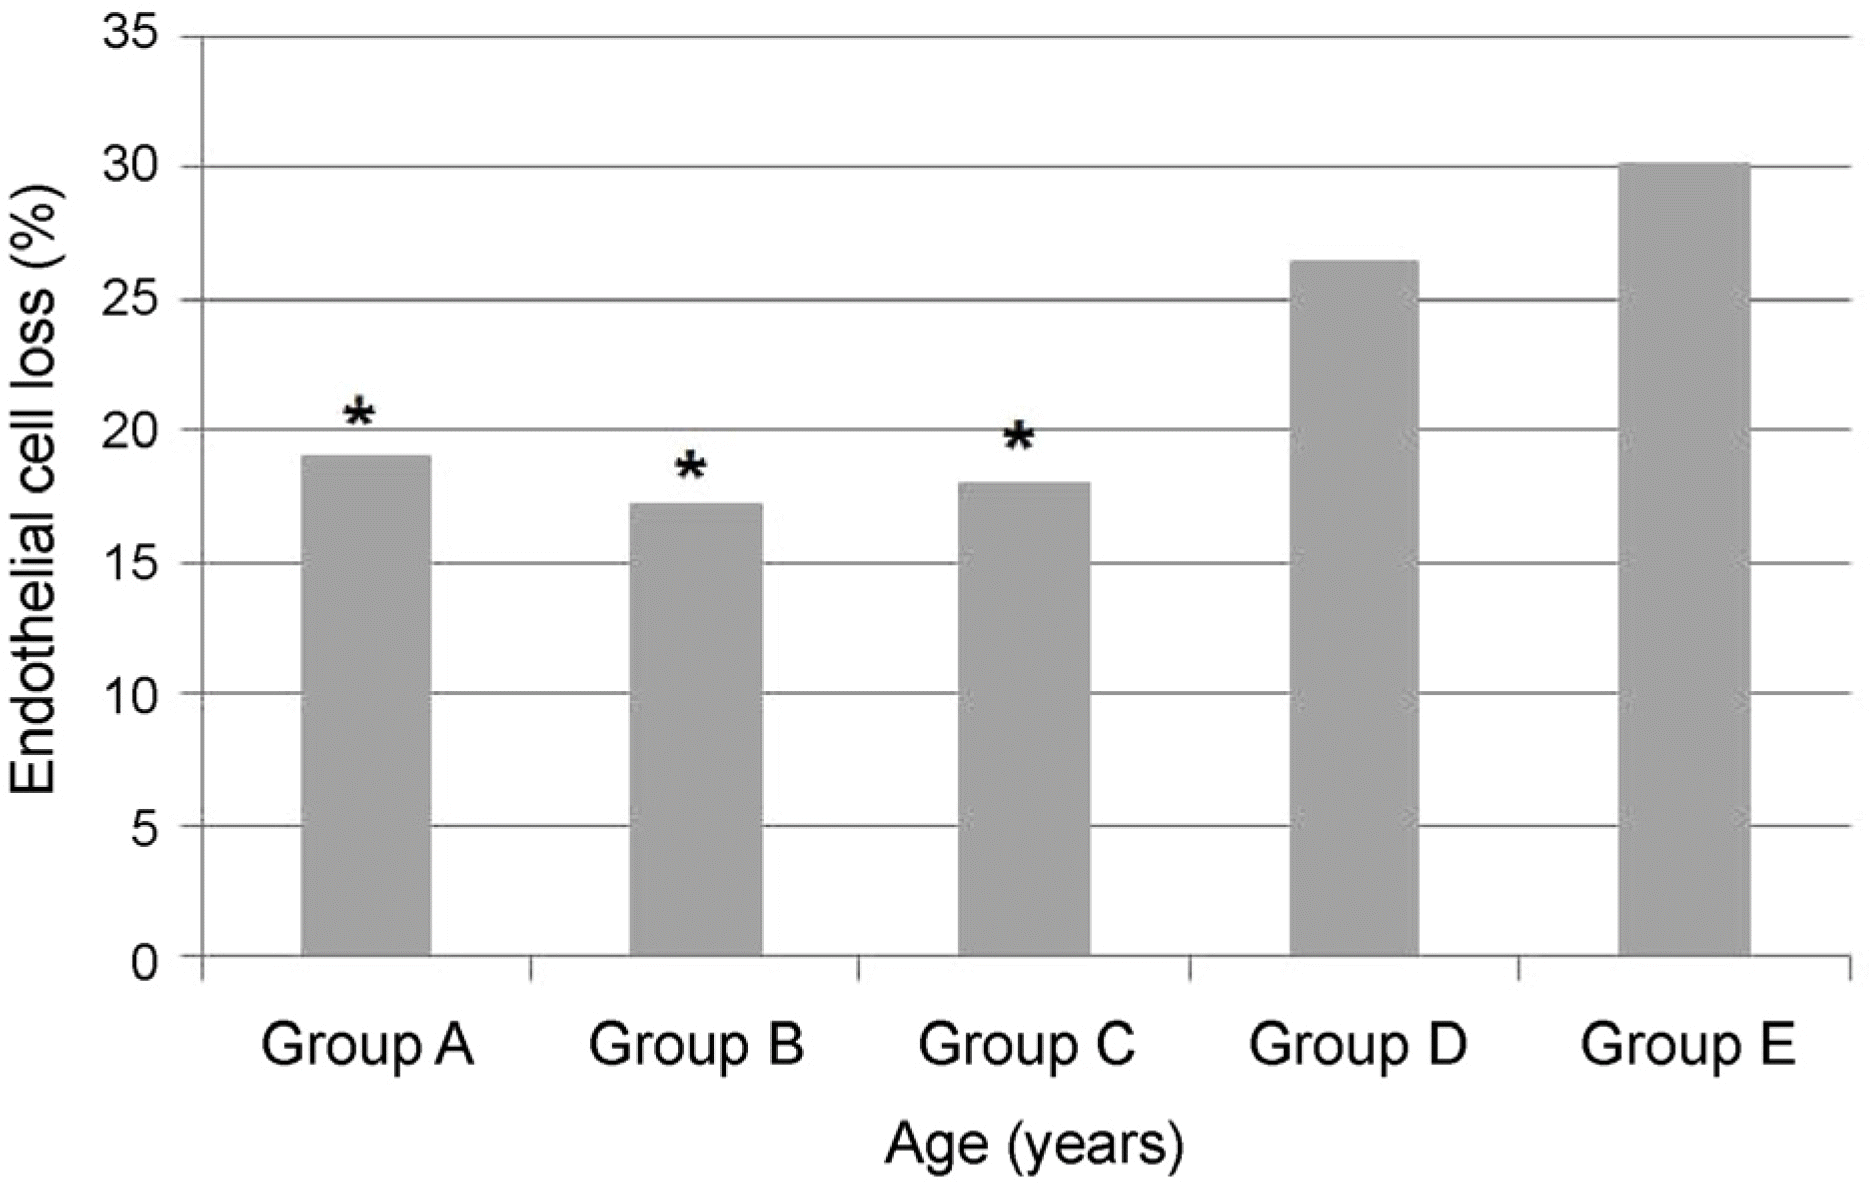
 | Figure 1.Corneal endothelial cell loss. * p-values were calculated using one-way analysis of variance (ANOVA). The one-way ANOVA was used to check if there is the difference of corneal endothelial cell loss among the five groups; Group A (n = 30): 40–49 years, Group B (n = 30): 50–59 years, Group C (n = 30): 60–69 years, Group D (n = 30): 70–79 years, Group E (n = 30): 80–89 years. |
Table 1.
| Group A | Group B | Group C | Group D | Group E | |
|---|---|---|---|---|---|
| Age (years) | 45.90 ± 2.46 | 55.40 ± 2.37 | 64.30 ± 3.30 | 74.10 ± 2.54 | 82.30 ± 2.23 |
| UCVA (log MAR) | 0.49 ± 0.21 | 0.46 ± 0.19 | 0.36 ± 0.15 | 0.52 ± 0.19 | 0.59 ± 0.25 |
| BCVA (log MAR) | 0.29 ± 0.15 | 0.35 ± 0.20 | 0.34 ± 0.23 | 0.37 ± 0.15 | 0.39 ± 0.16 |
| ECD (cells/mm²) | 2,875.00 ± 289.61* | 2,528.00 ± 352.36 | 2,664.40 ± 391.86 | 2,686.60 ± 525.27 | 2,630.00 ± 425.34 |
| NO Grade | 2.85 ± 1.05* | 3.20 ± 0.81* | 3.39 ± 0.67* | 4.23 ± 0.68 | 4.47 ± 0.51 |
UCVA = uncorrected visual acuity; BCVA = best corrected visual acuity; ECD = endothelial cell density, NO = nuclear opalescence (Grade 1–6).
* p-values were calculated using one-way analysis of variance (ANOVA). The one-way ANOVA was used to check if there is the difference of each parameters among the five groups; Group A (n = 30): 40–49 years, Group B (n = 30): 50–59 years, Group C (n = 30): 60–69 years, Group D (n = 30): 70–79 years, Group E (n = 30): 80–89 years.
Table 2.
Table 3.
| Group A | Group B | Group C | Group D | Group E | |
|---|---|---|---|---|---|
| UST (seconds) | 10.70 ± 11.65* | 31.90 ± 11.69 | 29.10 ± 9.21 | 32.60 ± 11.00 | 33.70 ± 12.85 |
| CDE (%) (seconds) | 10.10 ± 3.20* | 11.20 ± 3.20* | 12.40 ± 3.50* | 15.10 ± 3.80 | 16.70 ± 3.90 |
| Used BSS volume (mL) | 34.20 ± 20.34* | 47.90 ± 36.10* | 49.50 ± 27.14* | 87.70 ± 54.47 | 104.40 ± 65.32 |
* p-values were calculated using one-way analysis of variance (ANOVA). The one-way ANOVA was used to check if there is the difference of each parameters among the five groups; Group A (n = 30): 40–49 years, Group B (n = 30): 50–59 years, Group C (n = 30): 60–69 years, Group D (n = 30): 70–79 years, Group E (n = 30): 80–89 years.
Table 4.
| Group A | Group B | Group C | Group D | Group E | |
|---|---|---|---|---|---|
| UCVA (log MAR) | 0.06 ± 0.01* | 0.09 ± 0.01 | 0.12 ± 0.02 | 0.15 ± 0.02 | 0.15 ± 0.03 |
| BCVA (log MAR) | 0.03 ± 0.01 | 0.04 ± 0.01 | 0.04 ± 0.01 | 0.04 ± 0.01 | 0.04 ± 0.01 |
| ECD loss (%) | 17.94 ± 13.50* | 17.46 ± 9.08* | 19.12 ± 16.01* | 26.36 ± 10.82 | 31.80 ± 16.86 |
UCVA = uncorrected visual acuity; BCVA = best corrected visual acuity; ECD = endothelial cell density.
* p-values were calculated using one-way analysis of variance (ANOVA). The one-way ANOVA was used to check if there is the difference of each parameters among the five groups; Group A (n = 30): 40–49 years, Group B (n = 30): 50–59 years, Group C (n = 30): 60–69 years, Group D (n = 30): 70–79 years, Group E (n = 30): 80–89 years.


 PDF
PDF ePub
ePub Citation
 Print
Print


 XML Download