초록
Purpose:
To investigate the clinical characteristics of first-degree relatives with primary open-angle glaucoma (POAG).
Methods:
Forty-four POAG patients (22 pairs of eyes from 2 first-degree relatives) were followed for an average of 3.3 years. Baseline characteristics and follow-up data were analyzed. Baseline data consisted of baseline intraocular pressure (IOP), central corneal thickness (CCT), spherical equivalent, visual field mean deviation (VF MD) and average retinal nerve fiber layer (RNFL) thickness measured using optical coherence tomography (OCT). Follow-up data consisted of mean follow-up IOP, mean IOP reduction from baseline (%) and progression rates determined by linear regression analysis of either VF MD value or OCT RNFL thickness. Mean data of both eyes and the worse eye were compared between first-degree relatives of the same family.
Results:
Among the 22 families, 16 pairs of eyes were from parent/offspring and 6 from siblings. No difference in mean baseline IOP and CCT were found between first-degree relatives. The older patients in parent-offspring families showed significantly more advanced glaucoma in terms of both VF and RNFL thickness, but were less myopic; however, no differences in variables were found between relatives in the 6 families composed of siblings. Among the 22 families, worse baseline VF MD was observed in younger patients compared with the older patients in 4 families. Mean follow-up IOP, mean IOP reduction from baseline, and progression rate did not differ between the older and the younger patient in each family.
Conclusions:
In our study, similar characteristics in terms of baseline IOP, IOP response to medication, and glaucoma progression rate were found in members of the same family. However, in some of the families, the younger patient had poorer baseline severity and more aggressive characteristics compared with the older patient, suggesting the clinical course of the disease may vary among first-degree relatives.
Go to : 
References
3. Wolfs RC, Klaver CC, Ramrattan RS, et al. Genetic risk of primary open-angle glaucoma. Population-based familial aggregation study. Arch Ophthalmol. 1998; 116:1640–5.
4. Hulsman CA, Houwing-Duistermaat JJ, Van Duijn CM, et al. Family score as an indicator of genetic risk of primary open-angle glaucoma. Arch Ophthalmol. 2002; 120:1726–31.

5. Klein BE, Klein R, Lee KE. Heritability of risk factors for primary open-angle glaucoma: the Beaver Dam Eye Study. Invest Ophthalmol Vis Sci. 2004; 45:59–62.

6. Chang TC, Congdon NG, Wojciechowski R, et al. Determinants and heritability of intraocular pressure and cup-to-disc ratio in a defined older population. Ophthalmology. 2005; 112:1186–91.

7. Viswanathan AC, Hitchings RA, Indar A, et al. Commingling analysis of intraocular pressure and glaucoma in an older Australian population. Ann Hum Genet. 2004; 68(Pt 5):489–97.

8. Heijl A, Leske MC, Bengtsson B, et al. Measuring visual field progression in the Early Manifest Glaucoma Trial. Acta Ophthalmol Scand. 2003; 81:286–93.

9. Charlesworth J, Kramer PL, Dyer T, et al. The path to open-angle glaucoma gene discovery: endophenotypic status of intraocular pressure, cup-to-disc ratio, and central corneal thickness. Invest Ophthalmol Vis Sci. 2010; 51:3509–14.

10. Lee MK, Woo SJ, Kim JI, et al. Replication of a glaucoma candi-date gene on 5q22.1 for intraocular pressure in mongolian pop-ulations: the GENDISCAN Project. Invest Ophthalmol Vis Sci. 2010; 51:1335–40.

11. Carbonaro F, Andrew T, Mackey DA, et al. Heritability of intraocular pressure: a classical twin study. Br J Ophthalmol. 2008; 92:1125–8.

12. Zheng Y, Xiang F, Huang W, et al. Distribution and heritability of intraocular pressure in chinese children: the Guangzhou twin eye study. Invest Ophthalmol Vis Sci. 2009; 50:2040–3.

13. Pärssinen O, Era P, Tolvanen A, et al. Heritability of intraocular pressure in older female twins. Ophthalmology. 2007; 114:2227–31.

14. van Koolwijk LM, Despriet DD, van Duijn CM, et al. Genetic con-tributions to glaucoma: heritability of intraocular pressure, retinal nerve fiber layer thickness, and optic disc morphology. Invest Ophthalmol Vis Sci. 2007; 48:3669–76.

15. Landers JA, Hewitt AW, Dimasi DP, et al. Heritability of central corneal thickness in nuclear families. Invest Ophthalmol Vis Sci. 2009; 50:4087–90.

16. Dimasi DP, Burdon KP, Craig JE. The genetics of central corneal thickness. Br J Ophthalmol. 2010; 94:971–6.

17. Freeman EE, Roy-Gagnon MH, Descovich D, et al. The heritability of glaucoma-related traits corneal hysteresis, central corneal thickness, intraocular pressure, and choroidal blood flow pulsatility. PLoS One. 2013; 8:e55573.

18. Tielsch JM, Sommer A, Katz J, et al. Racial variations in the prevalence of primary open-angle glaucoma. The Baltimore Eye Survey. JAMA. 1991; 266:369–74.

19. Klein BE, Klein R, Sponsel WE, et al. Prevalence of glaucoma. The Beaver Dam Eye Study. Ophthalmology. 1992; 99:1499–504.
21. Kim YJ, Yun SC, Na JH, et al. Glaucoma progression in eyes with a history of refractive corneal surgery. Invest Ophthalmol Vis Sci. 2012; 53:4485–9.

22. Lee JH, Jee D, Kwon JW, Lee WK. Prevalence and risk factors for myopia in a rural Korean population. Invest Ophthalmol Vis Sci. 2013; 54:5466–71.

23. Leske MC, Rosenthal J. Epidemiologic aspects of open-angle glaucoma. Am J Epidemiol. 1979; 109:250–72.

24. Perkins ES, Phelps CD. Open angle glaucoma, ocular hypertension, low-tension glaucoma, and refraction. Arch Ophthalmol. 1982; 100:1464–7.

25. Mastropasqua L, Lobefalo L, Mancini A, et al. Prevalence of myopia in open angle glaucoma. Eur J Ophthalmol. 1992; 2:33–5.

26. Sakata R, Aihara M, Murata H, et al. Contributing factors for progression of visual field loss in normal-tension glaucoma patients with medical treatment. J Glaucoma. 2013; 22:250–4.

Go to : 
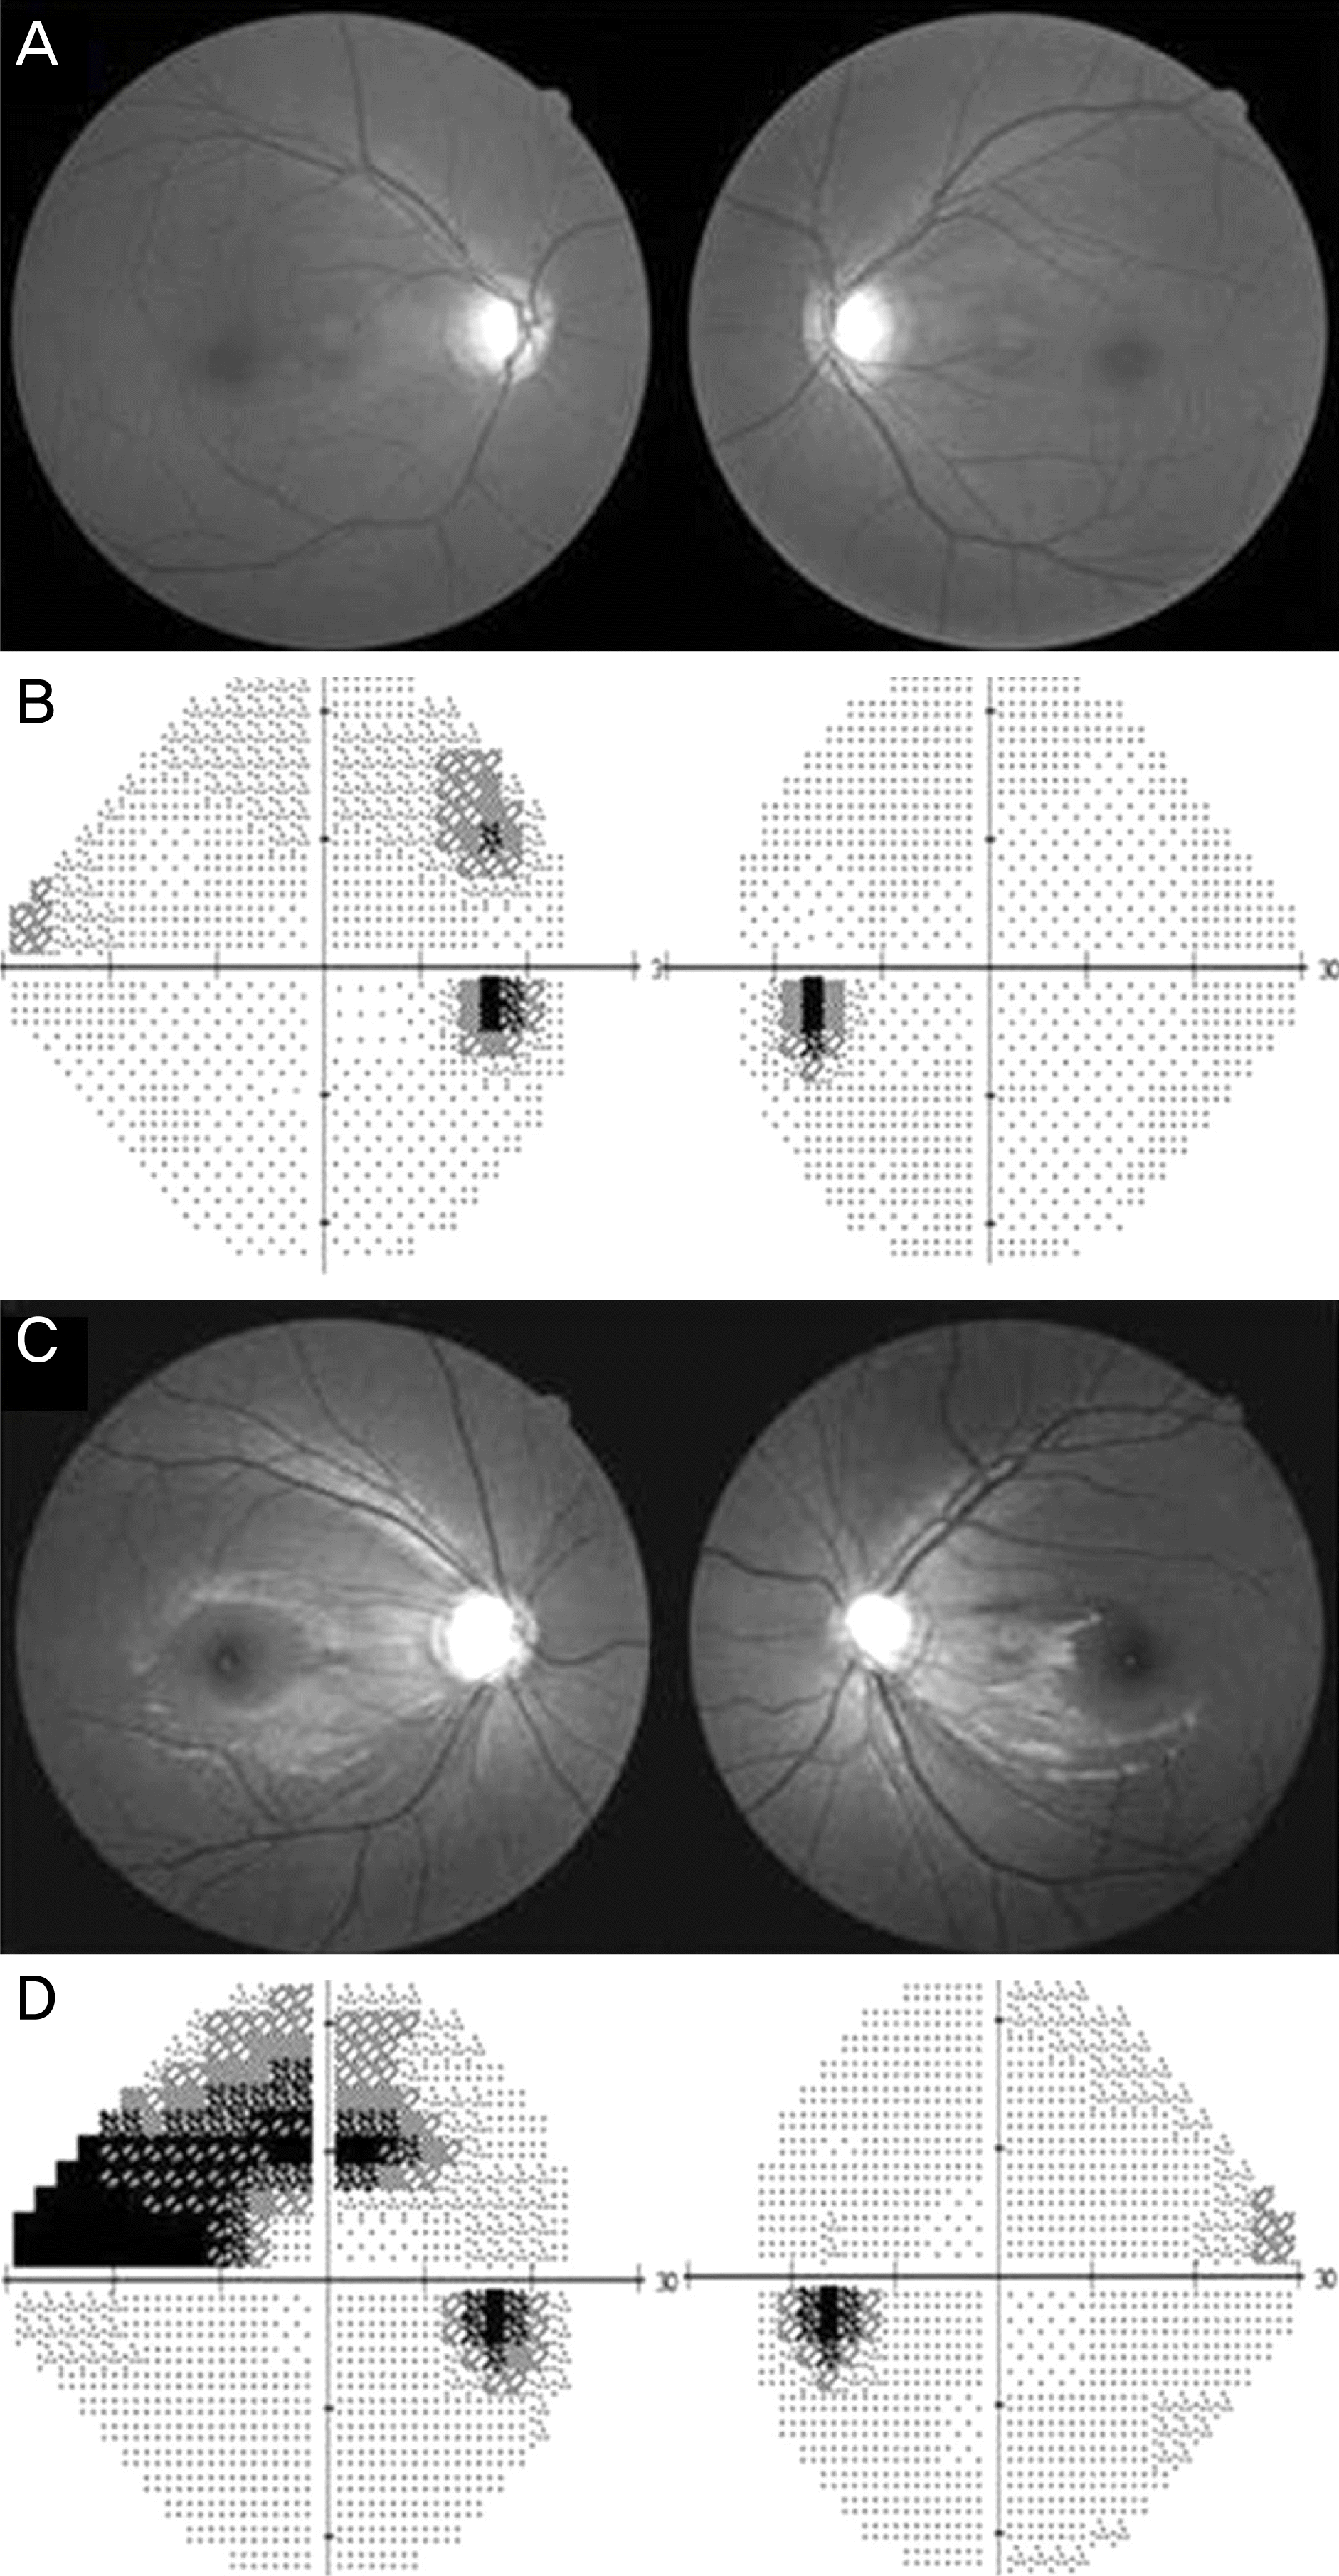
 | Figure 1.A 54-year-old man showed a mild RNFL defect in the supeotemporal and inferotemporal area of the right eye and the superotemporal area of the left eye (A), and an early VF defect in his right eye, with no definite VF change in the left eye (B). In contrast, his 24-year-old daughter showed more severe RNFL defects (C), and advanced VF defects in both eyes (D). RNFL = retinal nerve fiber layer; VF = visual field. |
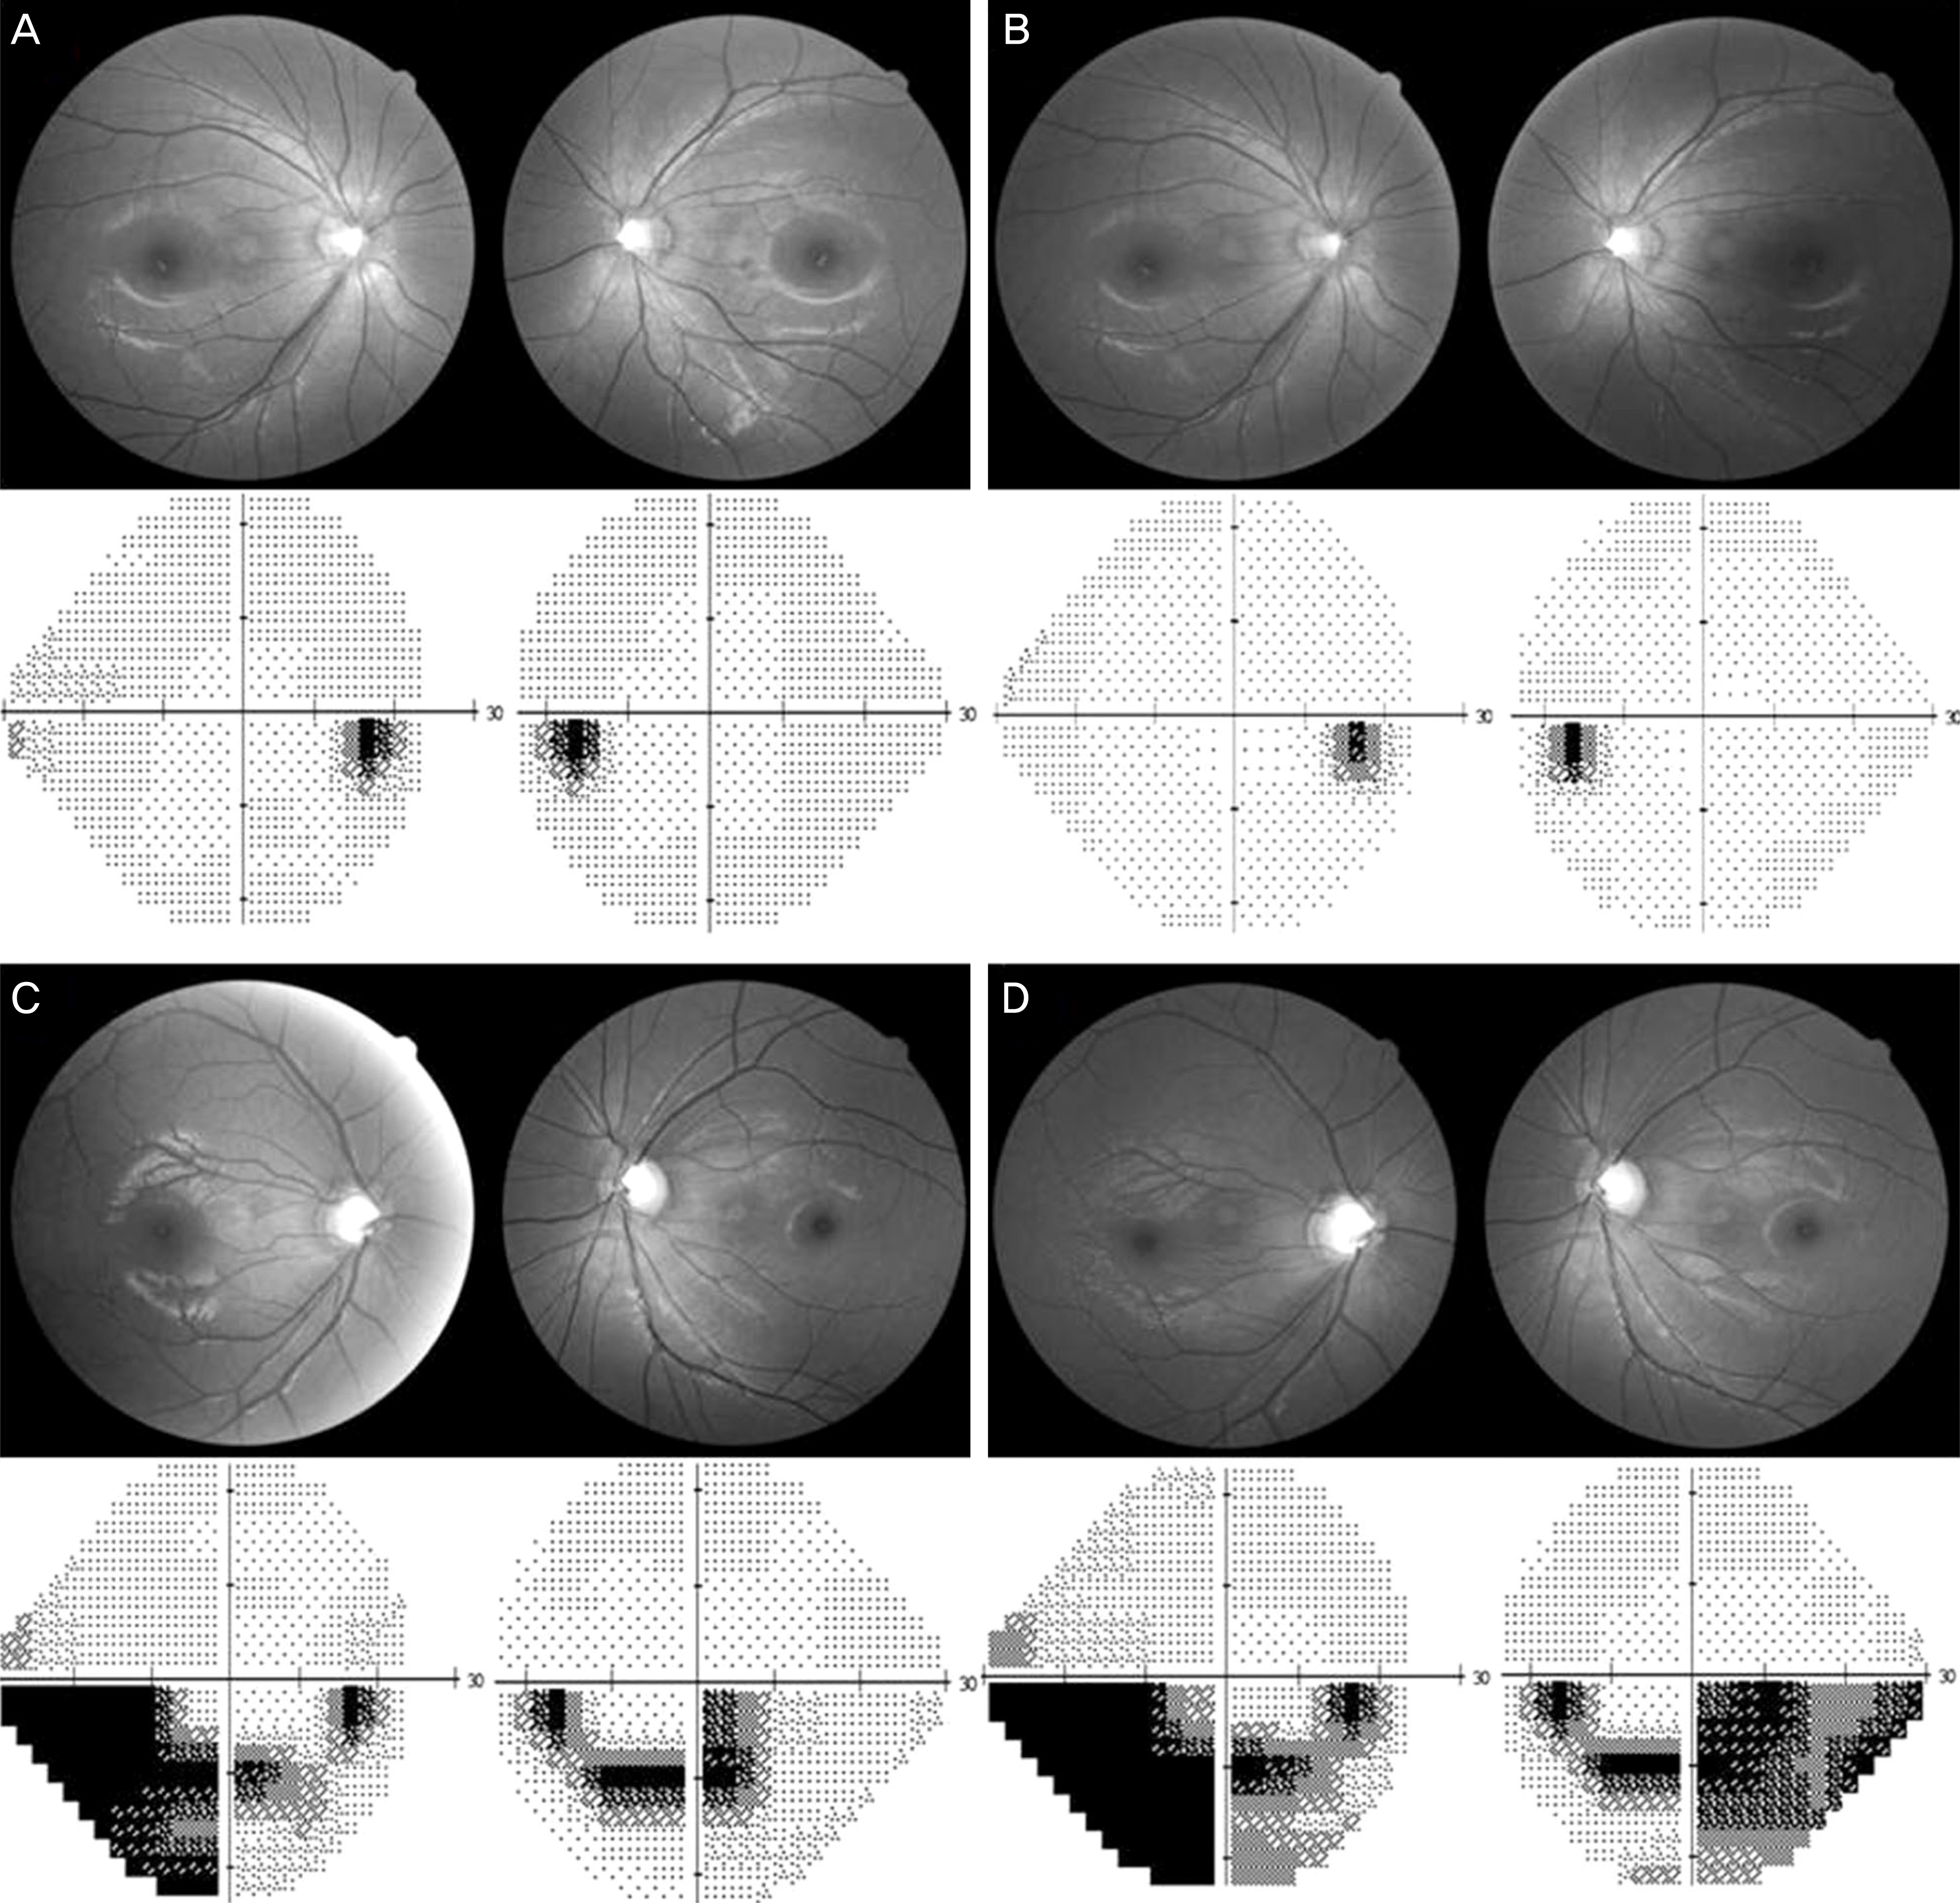
 | Figure 2.A 30-year-old woman who did not show progression in her optic disc/RNFL/VF exams during follow-up period (baseline (A) and 3 years later (B)); however, her younger brother showed significant progression in the right eye during the same follow-up period (baseline (C) and 3 years later (D)). RNFL = retinal nerve fiber layer; VF = visual field. |
Table 1.
Comparison of baseline characteristics between older and younger patients within the same family
| Older patient (n = 22) | Younger patient (n = 22) | p-value* | |
|---|---|---|---|
| Age (years) | 62.4 ± 12.7 | 40.9 ± 14.2 | 0.003 |
| SE (mean of both eyes, diopter) | -1.09 ± 2.36 | -4.03 ± 3.50 | 0.008 |
| SE (worse eye, diopter) | -1.38 ± 2.56 | -4.21 ± 3.57 | 0.014 |
| Baseline IOP (mean of both eyes, mm Hg) | 19.7 ± 7.5 | 17.7 ± 3.7 | 0.246 |
| Baseline IOP (worse eye, mm Hg) | 21.4 ± 10.3 | 18.8 ± 6.6 | 0.328 |
| Baseline CCT (mean of both eyes, micron) | 528.6 ± 34.8 | 546.9 ± 31.7 | 0.167 |
| Baseline CCT (worse eye, micron) | 525.5 ± 36.1 | 544.7 ± 31.8 | 0.165 |
| Baseline VF MD (mean of both eyes, decibel) | -7.0 ± 7.2 | -4.3 ± 4.0 | 0.045 |
| Baseline VF MD (worse eye, decibel) | -9.4 ± 9.6 | -6.3 ± 6.1 | 0.129 |
| OCT RNFL thickness (mean of both eyes, micron) | 66.9 ± 18.0 | 78.0 ± 12.8 | 0.014 |
| OCT RNFL thickness (worse eye, micron) | 64.1 ± 18.5 | 74.2 ± 13.6 | 0.036 |
| Antiglaucoma medication (mean of both eye, number) | 1.1 ± 0.8 | 0.7 ± 0.6 | 0.331 |
| Axial length (mean of both eyes, mm) | 23.91 ± 1.34 | 25.13 ± 2.27 | 0.111 |
Table 2.
Comparison of baseline characteristics between older and younger patients within the same family according to subgroup (parent-offspring group and sibling group)
|
Parent– offspring relationship (n = 16) |
Sibling relationship (n = 6) |
|||||
|---|---|---|---|---|---|---|
| Parent | Offspring | p-value* | Older sibling | Younger sibling | p-value* | |
| Age (years) | 65.3 ± 5.3l | 36.8 ± 12.8 | <0.001 | 54.8 ± 13.8 | 51.7 ± 12.7 | 0.026 |
| SE (mean of both eyes) | -0.49 ± 0.49 | -4.68 ± 4.68 | 0.001 | -2.90 ± 3.48 | -2.09 ± 2.63 | 0.686 |
| SE (myopic one between two eyes) | -0.77 ± 0.77 | -4.88 ± 3.66 | 0.002 | -3.20 ± 3.93 | -2.20 ± 2.63 | 0.686 |
| Baseline IOP (mean of both eyes) | 20.9 ± 0.9 | 17.6 ± 7.6 | 0.083 | 16.7 ± 4.5 | 18.1 ± 6.1 | 0.753 |
| Baseline IOP (higher one between two eyes) | 23.0 ± 3.0 | 18.0 ± 8.0 | 0.073 | 17.0 ± 4.6 | 21.0 ± 12.5 | 0.752 |
| Baseline CCT (mean of both eyes) | 515.3 ± 34.8 | 549.2 ± 49.2 | 0.020 | 558.6 ± 13.2 | 541.8 ± 51.1 | 0.465 |
| Baseline CCT (less one between two eyes) | 512.2 ± 33.2 | 546.8 ± 46.8 | 0.028 | 555.3 ± 16.6 | 540.0 ± 51.1 | 0.465 |
| Baseline VF MD (mean of both eyes) | -7.0 ± 7.9 | -3.7 ± 3.0 | 0.140 | -7.3 ± 5.5 | -5.9 ± 6.2 | 0.500 |
| Baseline VF MD (worse one between two eyes) | -9.5 ± 9.5l | -5.1 ± 5.1 | 0.177 | -9.2 ± 7.4 | -9.5 ± 9.0 | 0.893 |
| OCT RNFL thickness (mean of both eyes) | 66.2 ± 16.6 | 80.5 ± 13.0 | 0.007 | 68.7 ± 23.7 | 71.1 ± 10.0 | 0.686 |
| OCT RNFL thickness (lowest one between two eyes) | 63.4 ± 16.9 | 77.6 ± 13.9 | 0.011 | 65.8 ± 24.7 | 64.6 ± 6.9 | 0.686 |
Table 3.
Comparison of follow-up data between older and younger patients within the same family
| Older patient | Younger patient | p-value* | |
|---|---|---|---|
| Mean F/U IOP (mean of both eyes, mm Hg) | 14.1 ± 2.1 | 14.0 ± 1.9 | 0.785 |
| Mean IOP reduction from baseline (mean of both eyes, %) | 19.9 ± 19.1 | 18.6 ± 11.1 | 0.444 |
| MD rate (mean of both eyes, decibel) | -0.36 ± 0.78 | -0.35 ± 0.75 | 0.631 |
| OCT RNFL progression rate (mean of both eyes, micron) | -0.67 ± 3.13 | -0.57 ± 2.71 | 0.570 |
Table 4.
Comparison of follow-up data between older and younger patients within the same family according to subgroup (parent-offspring group and sibling group)
|
Parent– offspring relationship |
Sibling relationship |
|||||
|---|---|---|---|---|---|---|
| Parent | Offspring | p-value* | Older sibling | Younger sibling | p-value* | |
| Mean F/U IOP (mean of both eyes, mm Hg) | 14.5 ± 2.8 | 13.9 ± 1.9 | 0.412 | 14.1 ± 3.0 | 14.2 ± 3.3 | 0.776 |
| Mean IOP reduction from baseline (mean of both eyes, %) | 20.2 ± 22.1 | 18.3 ± 11.0 | 0.341 | 19.5 ± 14.5 | 19.3 ± 15.1 | 0.811 |
| MD rate (mean of both eyes, decibel) | -0.43 ± 1.1 | -0.33 ± 0.7 | 0.354 | -0.36 ± 0.48 | -0.37 ± 2.63 | 0.656 |
| OCT RNFL progression rate (mean of both eyes, micron) | -0.67 ± 3.13 | -0.57 ± 2.71 | 0.289 | -0.66 ± 3.93 | -0.65 ± 3.01 | 0.654 |


 PDF
PDF ePub
ePub Citation
 Print
Print


 XML Download