초록
Purpose:
To investigate the cross sectional study association of intraocular pressure (IOP) with anthropometric obesity indices.
Methods:
We classified study subjects into three groups‐‐ normal, overweight and obesity, and investigated the correlation of IOP with age, gender and anthropometric obesity indices such as obesity Index, body mass index (BMI), a body shape index (ABSI) and waist to height ratio (WHtR) on healthy subjects.
Results:
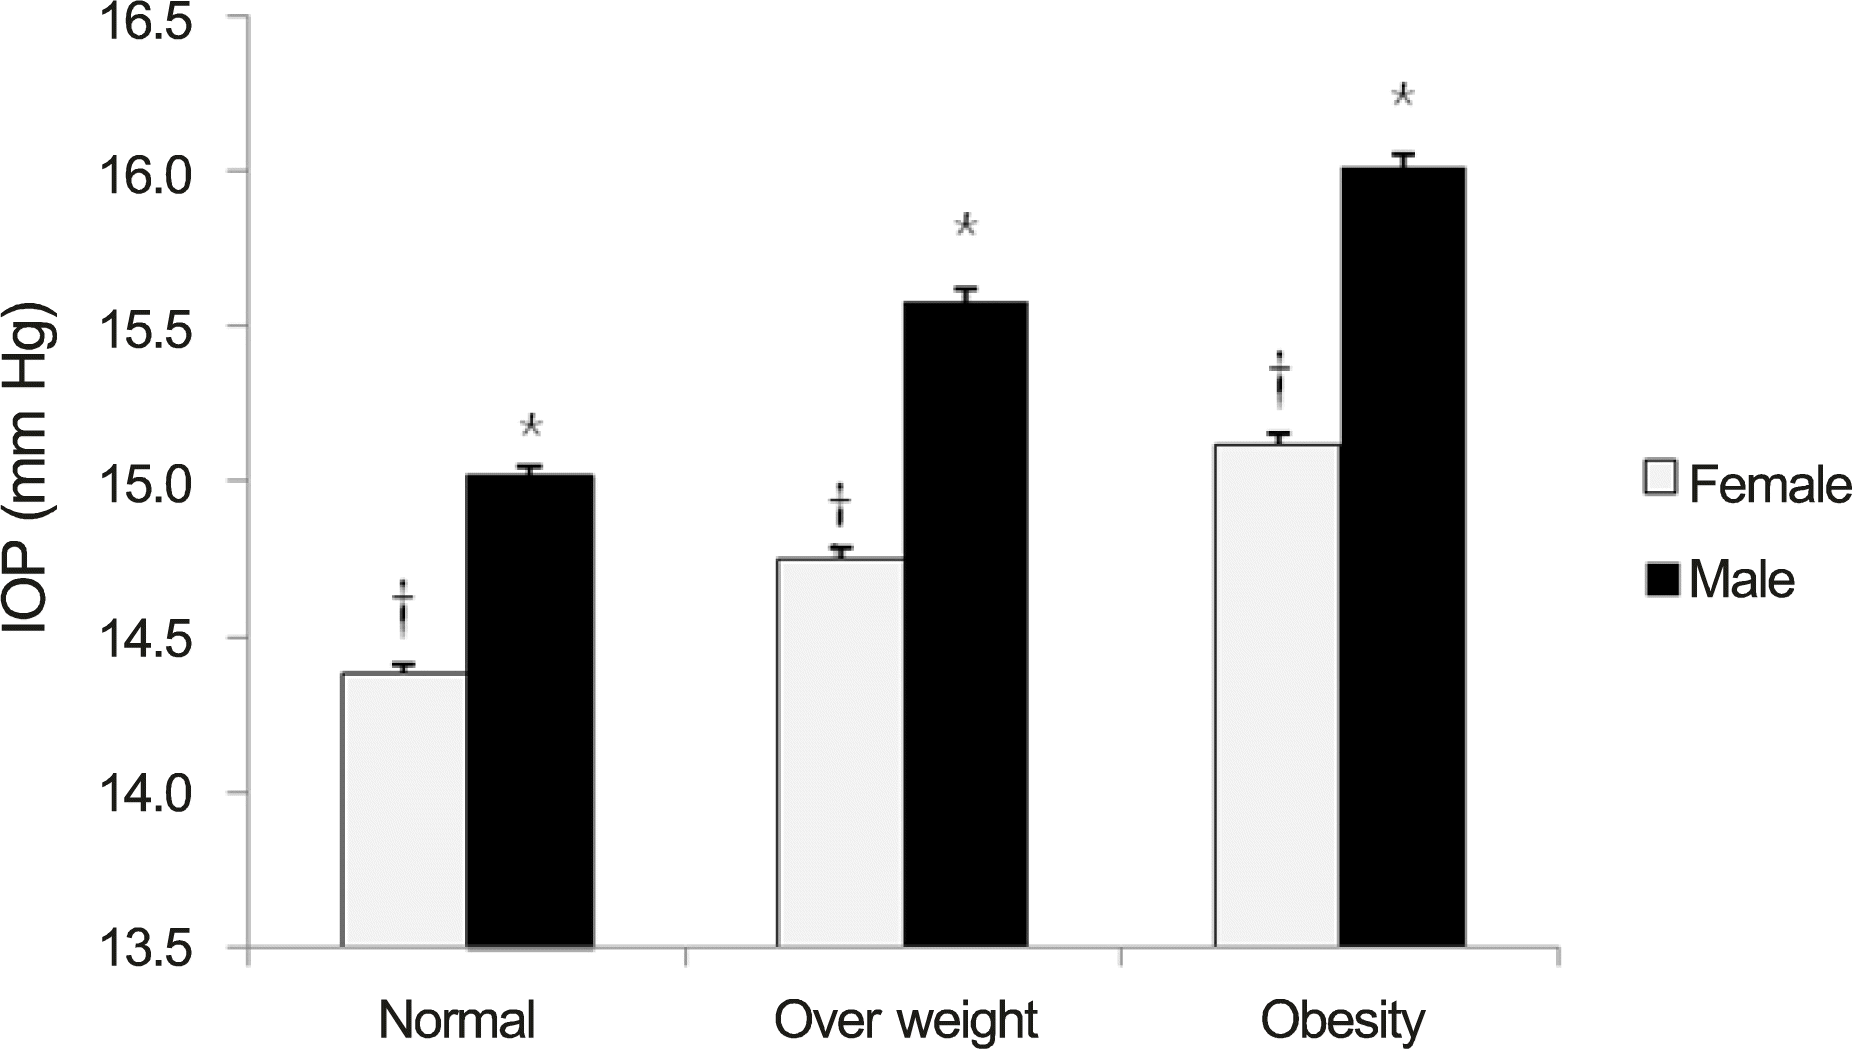
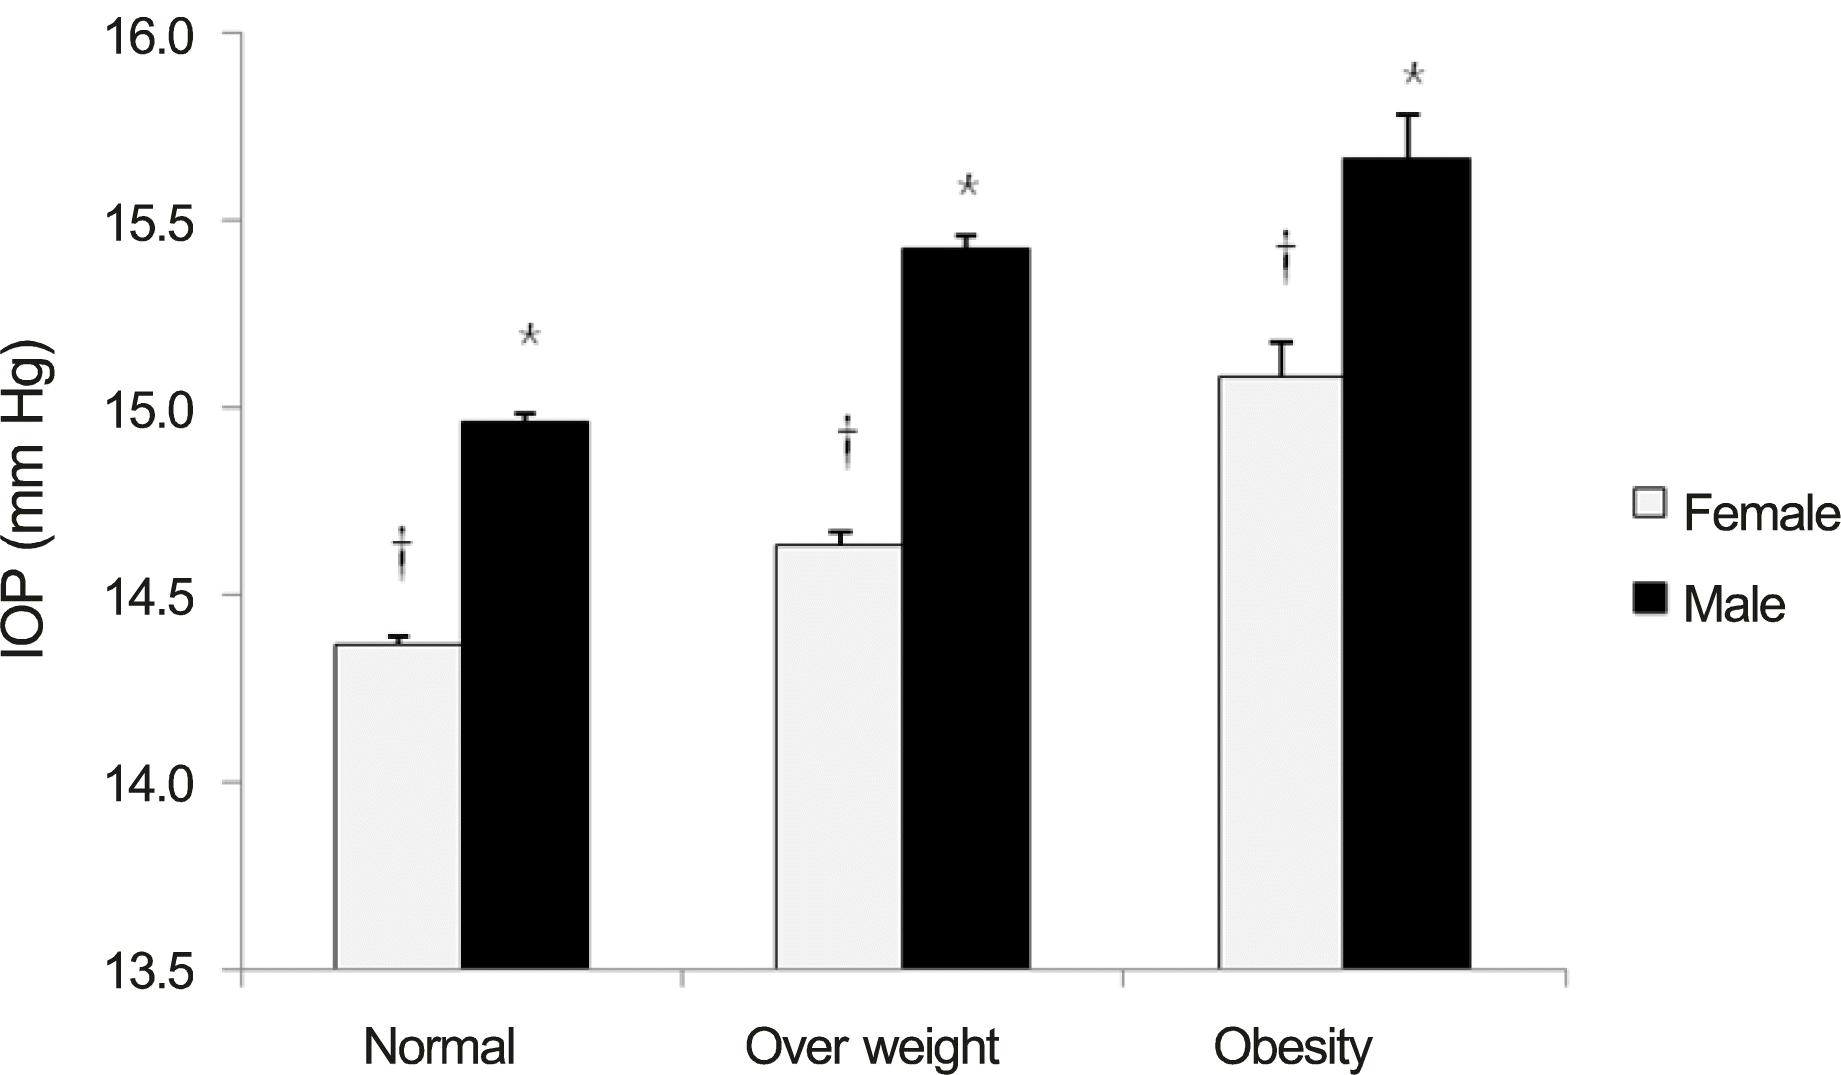
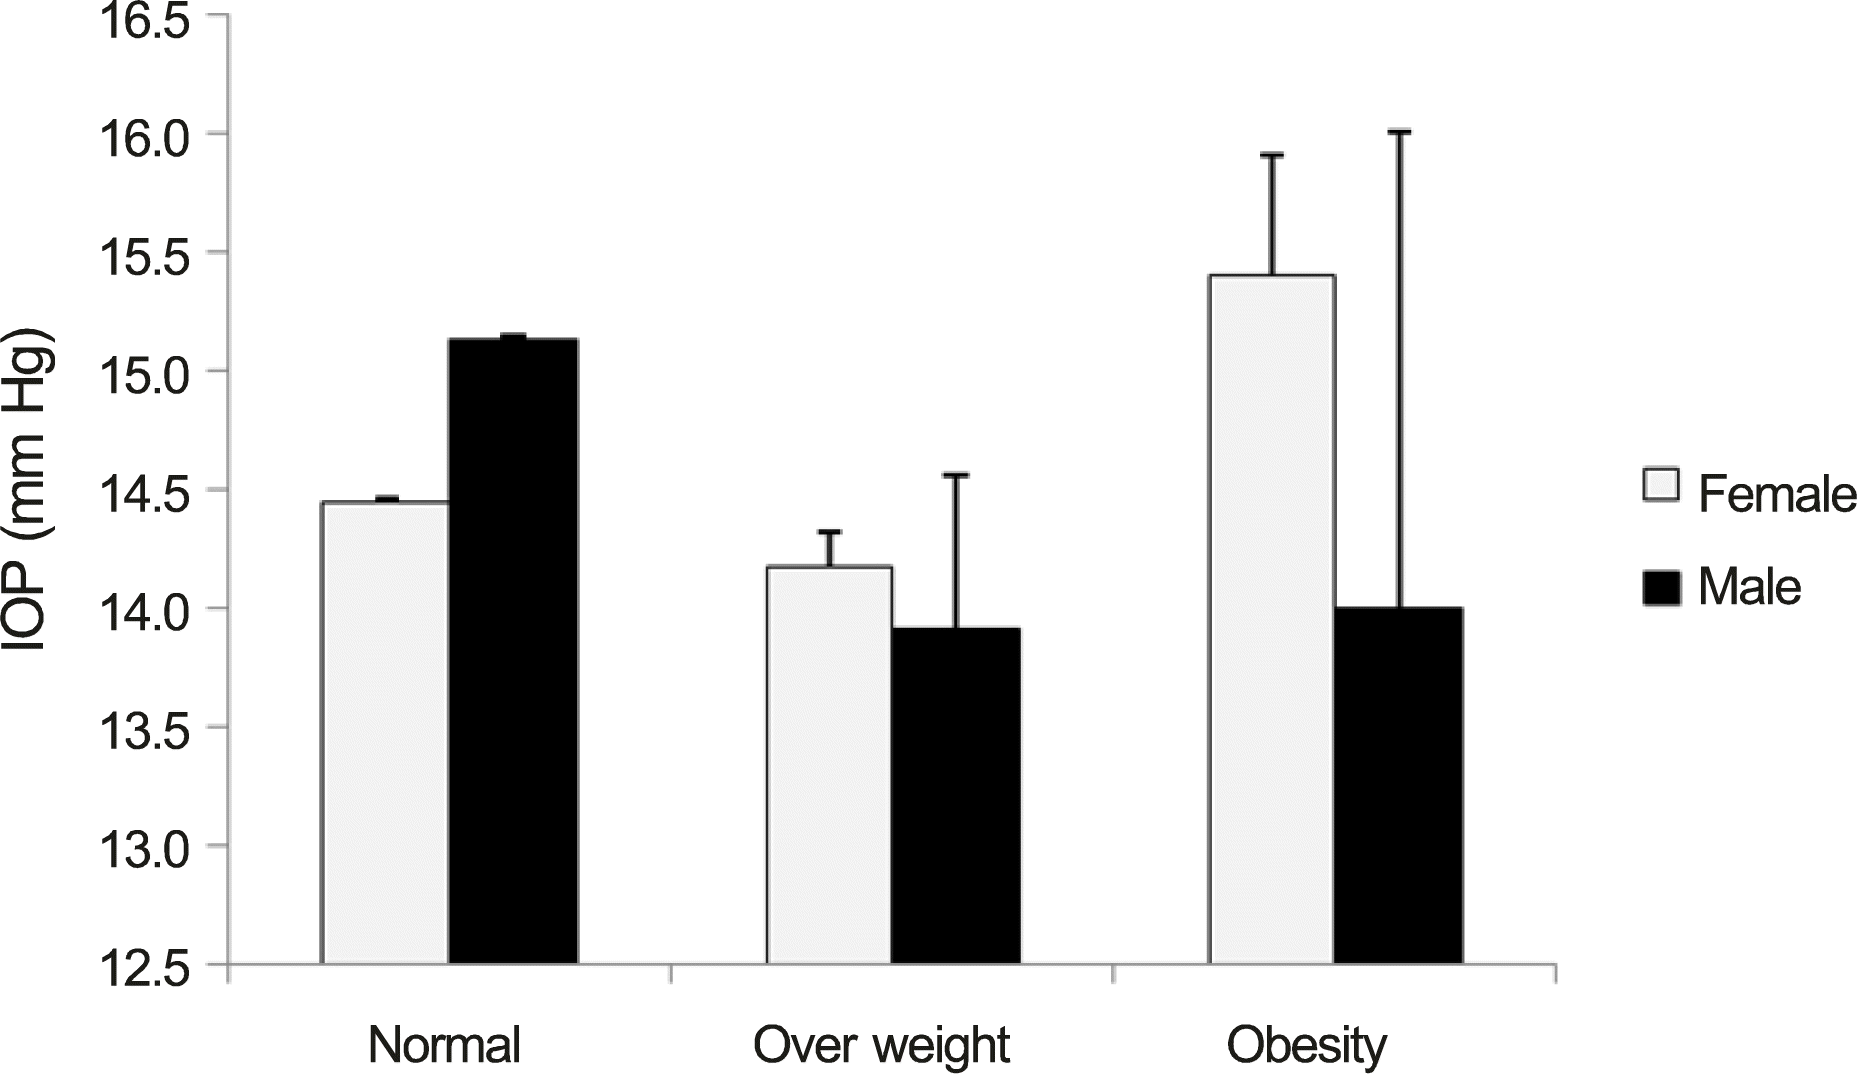
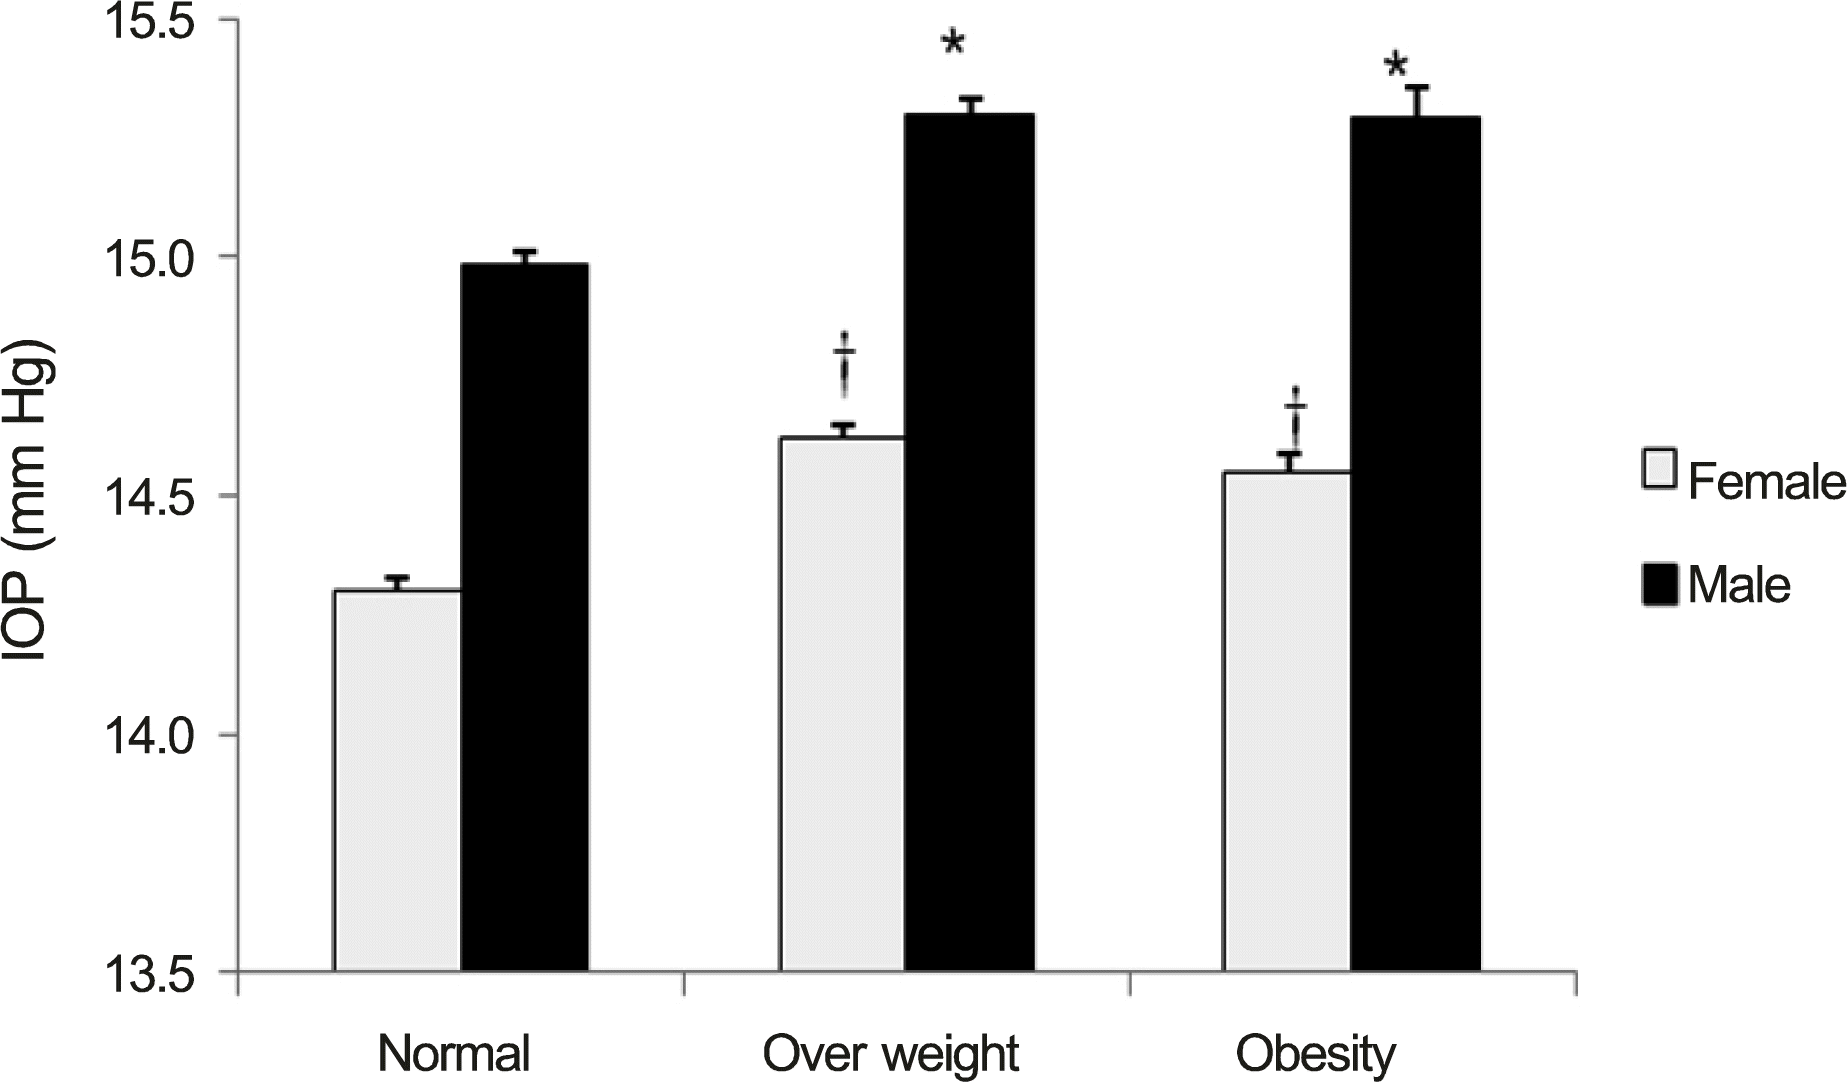
Of a total of 63,385 participants, 30,288 were male and 33,097 were female. Mean IOP was 15.13 ± 3.24 mm Hg for men and 14.44 ± 3.02 mm Hg for women. The obesity index and BMI in the normal, overweight and obesity groups were significantly different in both men and women ( p < 0.05). Mean IOP increased to a higher degree in the obesity group. In the normal, overweight and obesity group divided by ABSI, there were no significant differences in both men ( p = 0.66) and women ( p = 0.28). Between the normal and overweight group and the normal and obesity group divided by WHtR, there were significant differences in men ( p < 0.05) and women ( p < 0.05). Multiple linear regression analysis showed the significant relationship between obesity index, BMI, ABSI, WHtR and IOP in men and women. Receiver operating characteristic curve showed that the obesity index was the highest value following BMI, WHtR and ABSI.
Go to : 
References
1. Meckenzie W. Practical treatise on the disease of the eye. 2nd ed.London: Longman;1835. p. 822.
2. Lee JK, Han YS, Lee JS, Kim YK. The relationship between intraocular pressure and age, hypertension and obesity index in ocular hypertensive patients. J Korean Ophthalmol Soc. 2009; 50:1082–7.

3. Lee JK, Lee JS, Kim YK. The relationship between intraocular pressure and health parameters. J Korean Ophthalmol Soc. 2009; 50:105–12.

4. Nevill AM, Stewart AD, Olds T, Holder R. Relationship between adiposity and body size reveals limitations of BMI. Am J Phys Anthropol. 2006; 129:151–6.

5. Heymsfield SB, Scherzer R, Pietrobelli A, et al. Body mass index as a phenotypic expression of adiposity: quantitative contribution of muscularity in a population-based sample. Int J Obes (Lond). 2009; 33:1363–73.

6. Gómez-Ambrosi J, Silva C, Galofré JC, et al. Body mass index classification misses subjects with increased cardiometabolic risk factors related to elevated adiposity. Int J Obes (Lond). 2012; 36:286–94.

7. Bray GA, Smith SR, de Jonge L, et al. Effect of dietary protein con-tent on weight gain, energy expenditure, and body composition during overeating: a randomized controlled trial. JAMA. 2012; 307:47–55.
8. Krakauer NY, Krakauer JC. A new body shape index predicts mor-tality hazard independently of body mass index. PLoS One. 2012; 7:e39504.

9. Clinical guidelines on the identification, evaluation, and treatment of overweight and obesity in adults: executive summary. Expert Panel on the Identification, Evaluation, and Treatment of Overweight in Adults. Am J Clin Nutr. 1998; 68:899–917.
10. Browning LM, Hsieh SD, Ashwell M. A systematic review of waist-to-height ratio as a screening tool for the prediction of cardiovascular disease and diabetes: 0·5 could be a suitable global boundary value. Nutr Res Rev. 2010; 23:247–69.

11. Shiose Y, Kawase Y. A new approach to stratified normal intraocular pressure in a general population. Am J Ophthalmol. 1986; 101:714–21.

12. Bulpitt CJ, Hodes C, Everitt MG. Intraocular pressure and systemic blood pressure in the elderly. Br J Ophthalmol. 1975; 59:717–20.

13. Carel RS, Korczyn AD, Rock M, Goya I. Association between ocular pressure and certain health parameters. Ophthalmology. 1984; 91:311–4.

14. Klein BE, Klein R, Linton KL. Intraocular pressure in an American community. The Beaver Dam Eye Study. Invest Ophthalmol Vis Sci. 1992; 33:2224–8.
15. Bulpitt CJ, Hodes C, Everitt MG. Intraocular pressure and systemic blood pressure in the elderly. Br J Ophthalmol. 1975; 59:717–20.

16. Mori K, Ando F, Nomura H, et al. Relationship between intraocular pressure and obesity in Japan. Int J Epidemiol. 2000; 29:661–6.

17. Perry AC, Applegate EB, Allison ML, et al. Relation between anthropometric measures of fat distribution and cardiovascular risk factors in overweight pre- and postmenopausal women. Am J Clin Nutr. 1997; 66:829–36.

18. Seidell JC, Han TS, Feskens EJ, Lean ME. Narrow hips and broad waist circumferences independently contribute to increased risk of non-insulin-dependent diabetes mellitus. J Intern Med. 1997; 242:401–6.

19. Flegal KM, Shepherd JA, Looker AC, et al. Comparisons of percentage body fat, body mass index, waist circumference, and waist-stature ratio in adults. Am J Clin Nutr. 2009; 89:500–8.

20. Mitchell P, Smith W, Attebo K, Healey PR. Prevalence of open-angle glaucoma in Australia. The Blue Mountains Eye Study. Ophthalmology. 1996; 103:1661–9.
21. Klein BE, Klein R. Intraocular pressure and cardiovascular risk variables. Arch Ophthalmol. 1981; 99:837–9.

22. Bengtsson B. Some factors affecting the distribution of intraocular pressures in a population. Acta Ophthalmol (Copenh). 1972; 50:33–46.

23. Dielemans I, Vingerling JR, Algra D, et al. Primary open-angle glaucoma, intraocular pressure, and systemic blood pressure in the general elderly population. The Rotterdam Study. Ophthalmology. 1995; 102:54–60.
24. Armaly MF. On the distribution of applanation pressure. I. statistical features and the effect of age, sex, and family history of glaucoma. Arch Ophthalmol. 1965; 73:11–8.
26. Martin MJ, Sommer A, Gold EB, Diamond EL. Race and primary open-angle glaucoma. Am J Ophthalmol. 1985; 99:383–7.

27. Hollows FC, Graham PA. intraocular pressure, glaucoma, and glaucoma suspects in a defined population. Br J Ophthalmol. 1966; 50:570–86.

28. Klein BE, Klein R, Moss SE. Intraocular pressure in diabetic persons. Ophthalmology. 1984; 91:1356–60.

29. Seddon JM, Schwartz B, Flowerdew G. Case-control study of ocular hypertension. Arch Ophthalmol. 1983; 101:891–4.

30. Shiose Y. The aging effect on intraocular pressure in an apparently normal population. Arch Ophthalmol. 1984; 102:883–7.

31. Shiose Y, Kawase Y. A new approach to stratified normal intraocular pressure in a general population. Am J Ophthalmol. 1986; 101:714–21.

32. Kurokawa M. [Studies on the normal intraocular pressure. I. The average distribution and difference of both sexes and the aging of the normal intraocular pressure]. Nihon Ganka Gakkai Zasshi. 1969; 73:112–22.
34. Kass MA, Zimmerman TJ, Alton E, et al. Intraocular pressure and glaucoma in the Zuni indians. Arch Ophthalmol. 1978; 96:2212–3.

35. Jung SC, Choi YR, Lee JS. The Relationship between intraocular pressure and cardiovascular risk factors. J Korean Ophthalmol Soc. 2005; 46:1518–25.
36. Schteingart DE, Conn JW. Characteristics of the increased adreno-cortical function observed in many obese patients. Ann N Y Acad Sci. 1965; 131:388–403.

37. Katavisto M, Sammalkivi J. Tonometry among persons over 40 years of age. (results of a mass examination at the north karelian central hospital). Acta Ophthalmol (Copenh). 1964; 42:370–7.

38. Qureshi IA. Intraocular pressure: a comparative analysis in two sexes. Clin Physiol. 1997; 17:247–55.

39. Nomura H, Shimokata H, Ando F, et al. Age-related changes in intraocular pressure in a large Japanese population: a cross-sectional and longitudinal study. Ophthalmology. 1999; 106:2016–22.
41. Norgan NG, Ferro-Luzzi A. Weight-height indices as estimators of fatness in men. Hum Nutr Clin Nutr. 1982; 36:363–72.
42. Oshaug A, Bugge KH, Bjønnes CH, Ryg M. Use of anthropometric measurements in assessing risk for coronary heart disease: a useful tool in worksite health screening? Int Arch Occup Environ Health. 1995; 67:359–66.

43. Schreiner PJ, Pitkäniemi J, Pekkanen J, Salomaa VV. Reliability of near-infrared interactance body fat assessment relative to standard anthropometric techniques. J Clin Epidemiol. 1995; 48:1361–7.

44. Janssen I, Katzmarzyk PT, Ross R. Body mass index, waist circum-ference, and health risk: evidence in support of current National Institutes of Health guidelines. Arch Intern Med. 2002; 162:2074–9.
Go to : 
 | Figure 1.Intraocular pressure according to the group divided by obesity index. * p < 0.001 compared with each other in men; †p < 0.001 compared with each other in women. IOP = intraocular pressure. |
 | Figure 2.Intraocular pressure according to the group divided by BMI. * p < 0.001 compared with each other in men;†p < 0.001 compared with each other in women. IOP = intraocular pressure; BMI = body mass index. |
 | Figure 3.Intraocular pressure according to the group divided by ABSI. IOP = intraocular pressure; ABSI = a body shape index. |
 | Figure 4.Intraocular pressure according to the group divided by WHtR. * p < 0.001 compared with normal in men; †p < 0.001 compared with normal in women. IOP = intraocular pressure; WHtR = waist-to-height ratio. |
Table 1.
Mean of intraocular pressure and number of ocular hypertension cases in each gender group
Table 2.
Numbers and general features of study participants in men and women
Table 3.
Comparison of percentage of high intraocular pressure in obesity index, BMI, ABSI and WHtR
Table 4.
The relationship between intraocular pressure and obesity index, BMI, ABSI, WHtR according to the age group
Table 5.
Univariate linear regression analysis for relationship between intraocular pressure and anthropometric obesity indices
Table 6.
Area under curve values with 95% confidence intervals for anthropometric obesity indices in men and women in each age group


 PDF
PDF ePub
ePub Citation
 Print
Print


 XML Download