Abstract
Purpose
To analyze the changes of higher order aberration (HOA) measured serially by KR-1WⓇ wavefront at every second for 10 seconds between, before, and after phacoemulsification and to evaluate the relationships between HOA and the ocular surface indicators (Schirmer test, tear break-up time, superficial punctate keratitis).
Methods
Corneal HOA was measured in 47 eyes of 30 patients pre- and postoperatively at 2, 4, 6, and 8 weeks by KR-1WⓇ using the continuous measurement mode. The patients were divided into 2 groups according to their Schirmer test (above 10 mm or under 10 mm), tear break-up time (above 5 seconds or less than 5 seconds), and superficial punctate keratitis (any keratitis, none) for analysis of relationships between HOA and ocular surface indicators, and we also analyzed the correlation coefficient.
Results
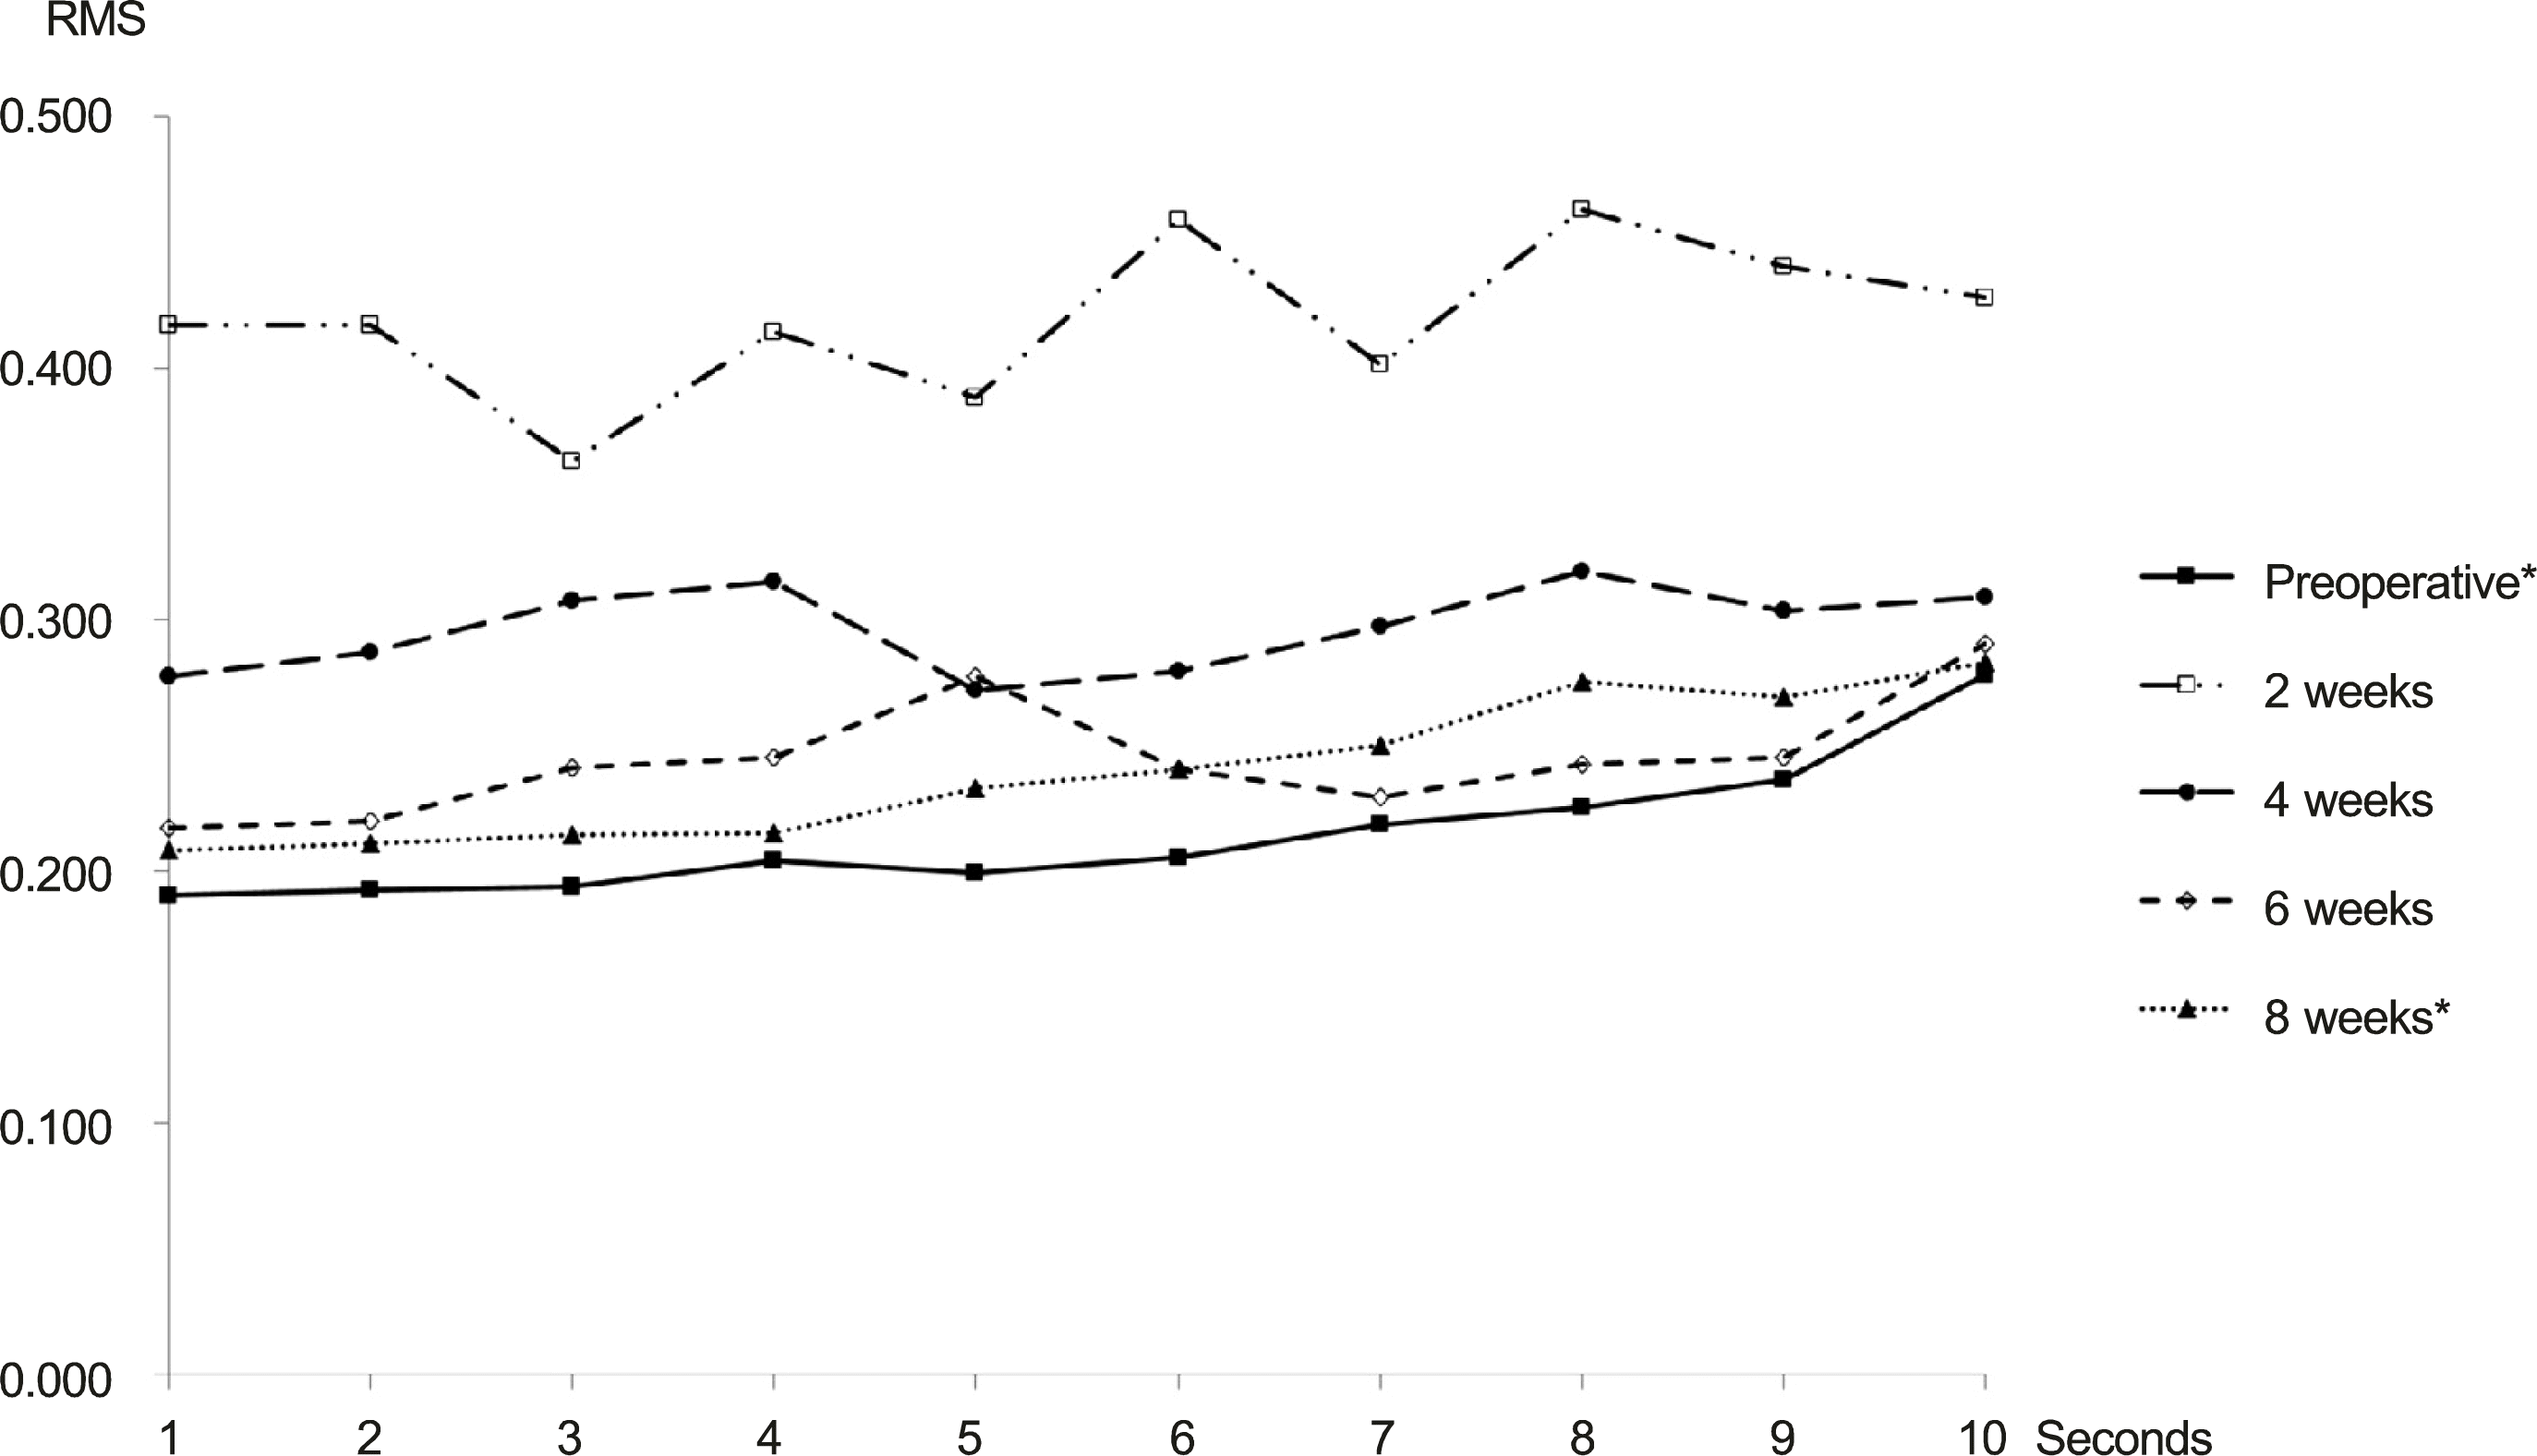
Short-term follow up after phacoemulsification revealed that corneal HOA rapidly increased at 2 weeks and recovered to the preoperative level 8 weeks after surgery. Corneal HOA values showed increasing tendency depending on time at preop and 8 weeks after phacoemulsification, and the differences were statistically significant (preop: p < 0.001, 8 weeks: p = 0.027). There were no significant differences of HOA between the 2 groups divided according to their ocular surface indicators, and there were no significant correlations between HOA and ocular surface indicators at any time point.
Conclusions
The HOA of the cornea was restored to its preoperative values at 8 weeks after surgery. Preoperative ocular surface indicators are not significantly influenced on postoperative corneal HOA. The surgical factors are more significant in post-operative corneal HOA than preoperative ocular surface indicators.
References
1. Kelman CD. Phaco-emulsification and aspiration. A new technique of cataract removal. A preliminary report. Am J Ophthalmol. 1967; 64:23–35.
2. Hiroko BM. Cataract surgery in the presence of other ocular comorbidities. Steinert RF, editor. Cataract Surgery: Technique, Complication and Management. Saunders;2004. chap. 32.
3. Ram J, Gupta A, Brar G. . Outcomes of phacoemulsification in patients with dry eye. J Cataract Refract Surg. 2002; 28:1386–9.

4. Koenig SB, Berkowitz RA, Beuerman RW, McDonald MB. Corneal sensitivity after epikeratophakia. Ophthalmology. 1983; 90:1213–8.

5. Tervo K, Latvala TM, Tervo TM. Recovery of corneal innervation following photorefractive keratoablation. Arch Ophthalmol. 1994; 112:1466–70.

6. Benitez-del-Castillo JM, del Rio T, Iradier T. . Decrease in tear secretion and corneal sensitivity after laser in situ keratomileusis. Cornea. 2001; 20:30–2.

7. Park YK, Choi NY, Bae SR, Joo CK. The change of tear flim after laser epithelial keratomileusis and laser in situ keratomileusis. J Korean Ophthalmol Soc. 2002; 43:1145–51.
8. Quinto GG, Camacho W, Behrens A. Postrefractive surgery dry eye. Curr Opin Ophthalmol. 2008; 19:335–41.

9. Hagyó K, Csákány B, Lang Z, Németh J. Variability of higher order wavefront aberrations after blinks. J Refract Surg. 2009; 25:59–68.

10. Choi SH, Shin YI. Changes in higher order aberration according to tear-film instability analyzed by continuous measurement using wavefront. J Korean Ophthalmol Soc. 2012; 53:1076–80.

11. Donnenfeld ED, Solomon K, Perry HD. . The effect of hinge position on corneal sensation and dry eye after LASIK. Ophthalmology. 2003; 110:1023–9. discussion 1029-30.

12. Mencucci R, Ambrosini S, Ponchietti C. . Ultrasound thermal damage to rabbit corneas after simulated phacoemulsification. J Cataract Refract Surg. 2005; 31:2180–6.

13. Oh T, Jung Y, Chang D. . Changes in the tear film and ocular surface after cataract surgery. Jpn J Ophthalmol. 2012; 56:113–8.

14. Tutt R, Bradley A, Begley C, Thibos LN. Optical and visual impact of tear break-up in human eyes. Invest Ophthalmol Vis Sci. 2000; 41:4117–23.
15. Hagyó K, Csákány B, Lang Z, Németh J. Variability of higher order wavefront aberrations after blinks. J Refract Surg. 2009; 25:59–68.

16. Thibos LN, Hong X. Clinical applications of the Shack-Hartmann aberrometer. Optom Vis Sci. 1999; 76:817–25.

17. Koh S, Maeda N, Kuroda T. . Effect of tear film break-up on higher-order aberrations measured with wavefront sensor. Am J Ophthalmol. 2002; 134:115–7.

18. Montés-Micó R, Alió JL, Muñoz G. . Postblink changes in total and corneal ocular aberrations. Ophthalmology. 2004; 111:758–67.
19. Khanal S, Tomlinson A, Esakowitz L. . Changes in corneal sensitivity and tear physiology after phacoemulsification. Ophthalmic Physiol Opt. 2008; 28:127–34.

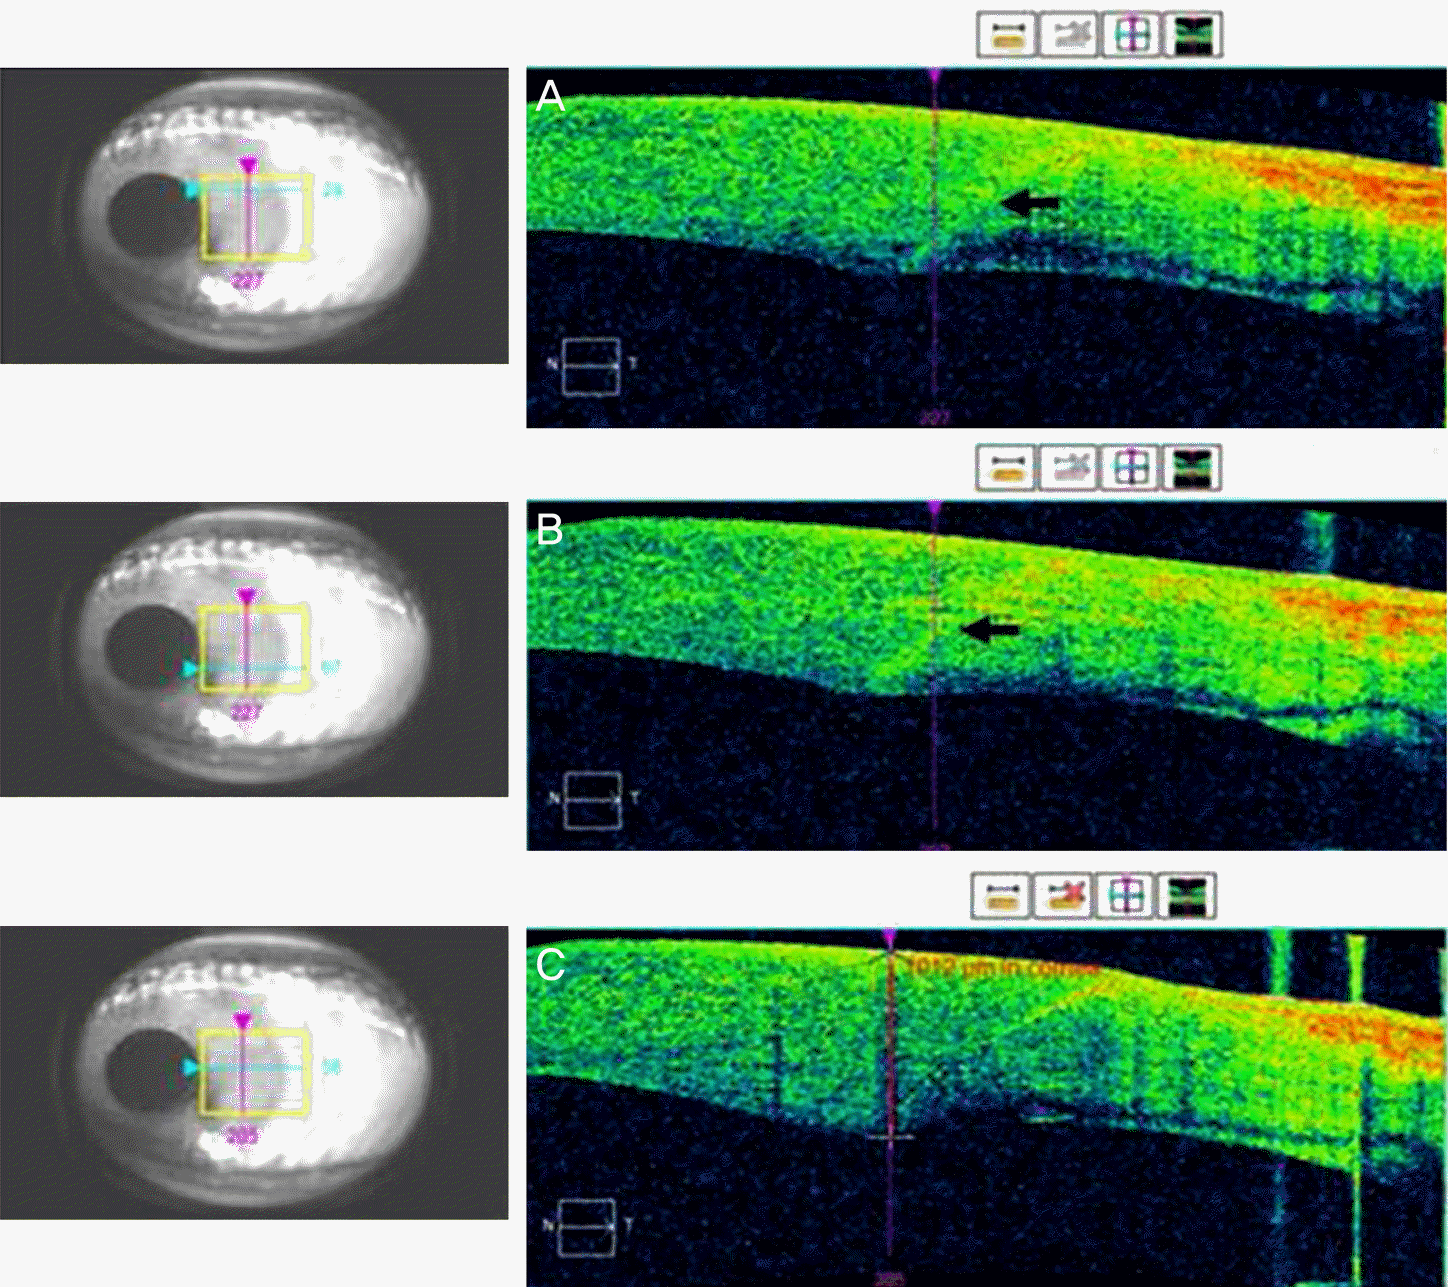
Figure 1.
Continuous measurement mode using KR-1W Ⓡ wavefront analyzer. HOA = higher order aberration; RMS = root mean square.

Figure 2.
Serial changes in corneal higher order aberration (HOA) over time. Short-term follow up after pha-coemulsification reveals that corneal HOA recovers to the preoperative level at 8 weeks after surgery. RMS = root mean square. * p < 0.05; p-value from repeated measure ANOVA.

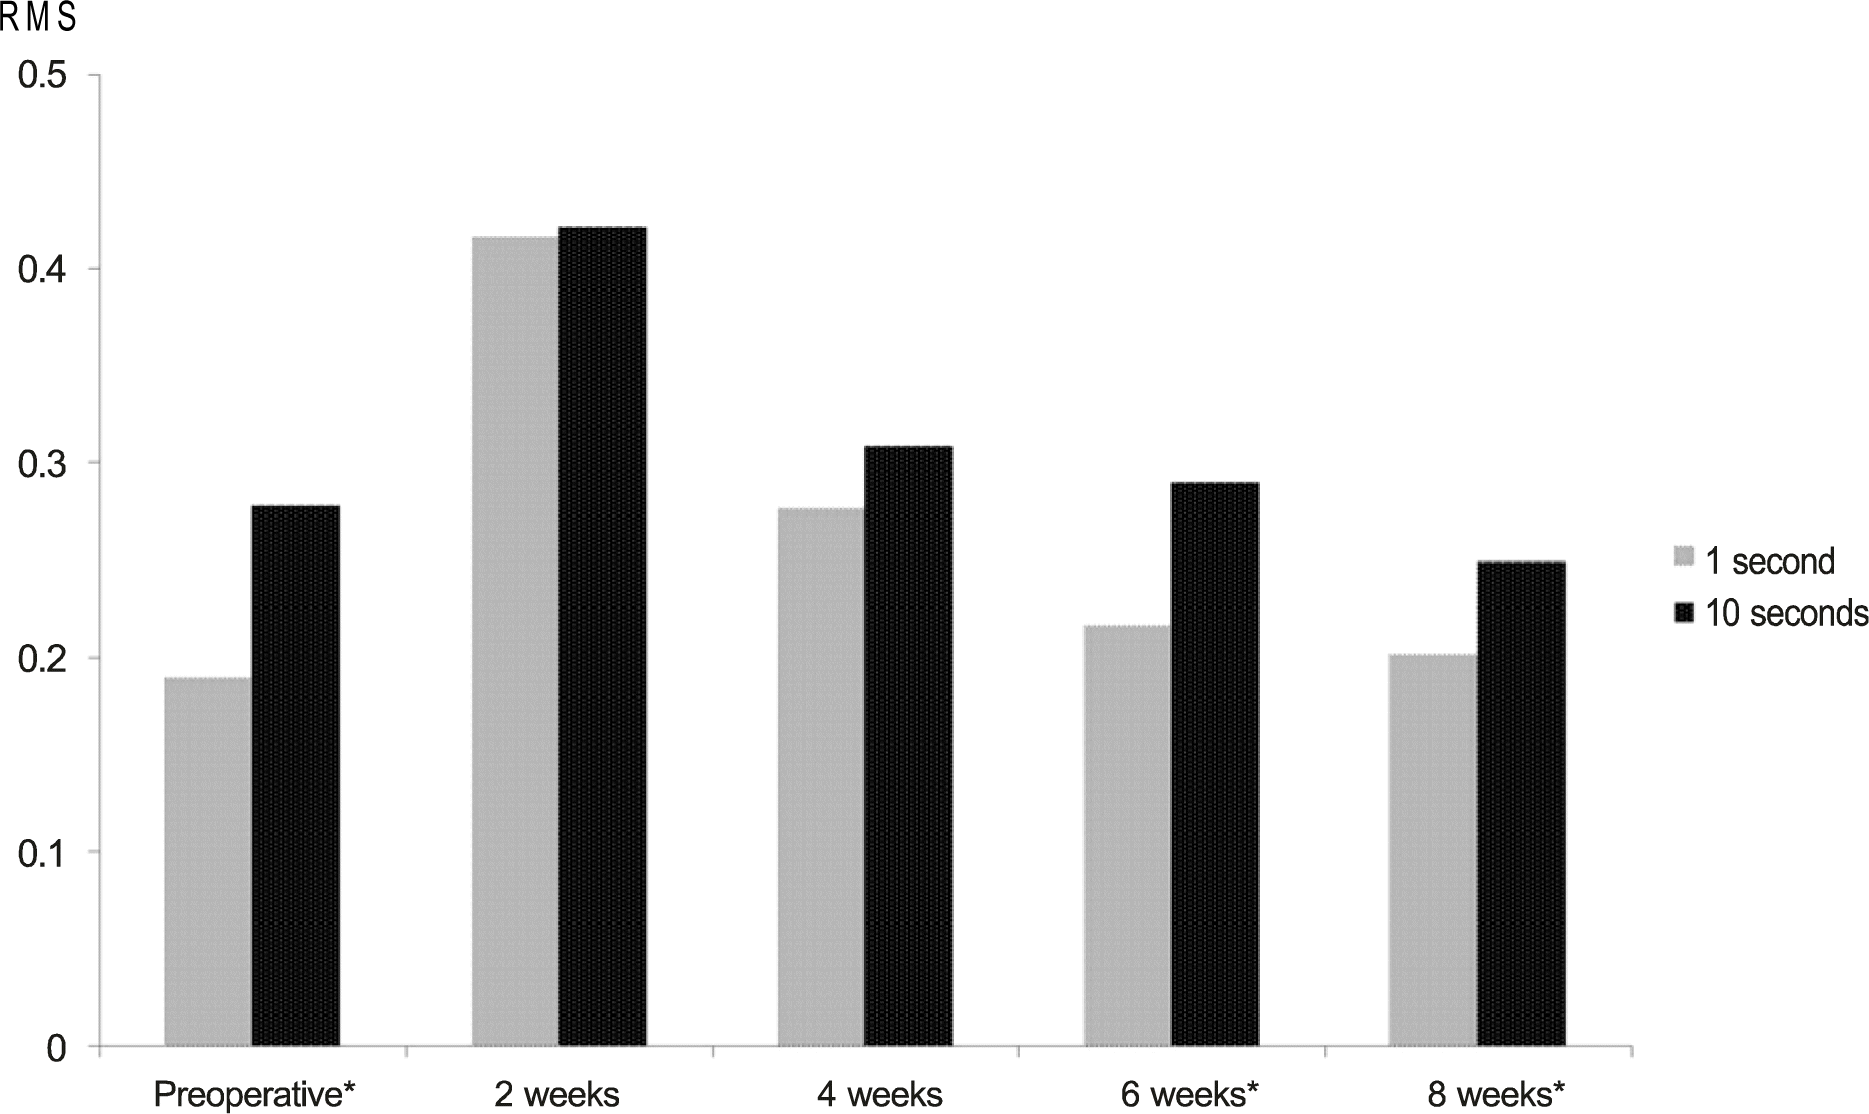
Figure 3.
Changes of corneal higher order aberration (HOA) between 1 and 10 seconds after blinking. Corneal HOA of the 1 and 10 seconds are both similarly high on the 2 weeks after surgery, however, as time passed to 4th, 6th, and 8th weeks, as like before surgery, values show increasing tendency depending on time. * p < 0.05; p-value from paired t-test.

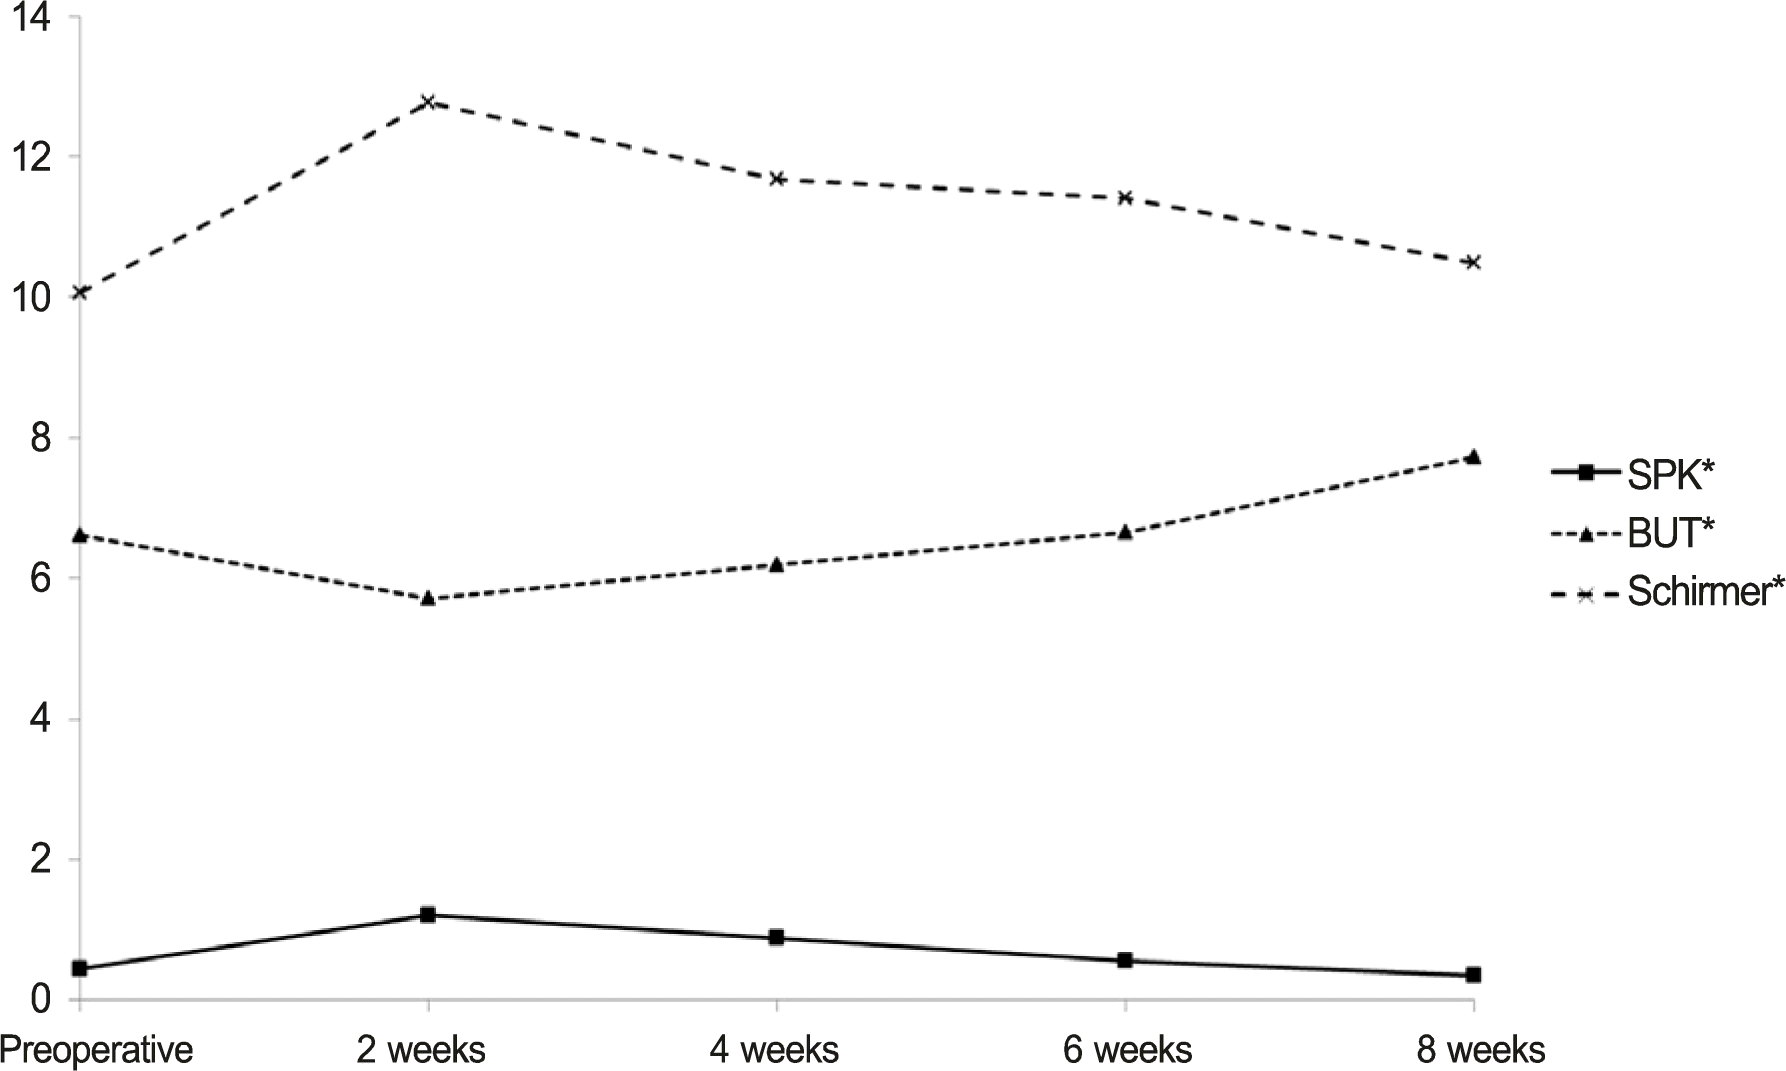
Figure 4.
Serial changes in ocular surface indicators. All factors recovered to preoperative levels at 8 weeks after surgery. SPK = superficial punctate keratitis; BUT = break up time. * p < 0.05; p-value from repeated measure ANOVA.

Table 1.
Baseline characteristics of patients
Table 2.
Mean values and changes in HOA at 1 and 10 seconds in each group classified according to the preoperative Schirmer test
|
Group A (>10 mm, n = 13) |
Group B (≤10 mm, n = 34) |
p-value‡ | p-value§ | |||
|---|---|---|---|---|---|---|
| AVG∗ | Δ HOA | AVG∗ | Δ HOA† | |||
| Preop | 0.210 | 0.051 | 0.225 | 0.103 | 0.035 | 0.111 |
| POD 2 weeks | 0.412 | -0.026 | 0.414 | 0.017 | 0.858 | 0.712 |
| POD 4 weeks | 0.287 | 0.098 | 0.300 | 0.006 | 0.943 | 0.140 |
| POD 6 weeks | 0.192 | 0.003 | 0.265 | 0.100 | 0.295 | 0.057 |
| POD 8 weeks | 0.236 | 0.023 | 0.245 | 0.057 | 0.784 | 0.372 |
Table 3.
Mean values and changes in HOA at 1 and 10 seconds in each group classified according to the preoperative BUT
|
Group A (>5 seconds, n = 30) |
Group B (≤5 seconds, n = 17) |
p-value‡ | p-value§ | |||
|---|---|---|---|---|---|---|
| AVG∗ | Δ HOA | AVG∗ | Δ HOA† | |||
| Preop | 0.207 | 0.098 | 0.218 | 0.073 | 0.043 | 0.412 |
| POD 2 weeks | 0.400 | -0.003 | 0.436 | 0.019 | 0.765 | 0.406 |
| POD 4 weeks | 0.294 | 0.010 | 0.301 | 0.070 | 0.595 | 0.080 |
| POD 6 weeks | 0.250 | 0.057 | 0.235 | 0.102 | 0.425 | 0.674 |
| POD 8 weeks | 0.246 | 0.033 | 0.236 | 0.073 | 0.782 | 0.170 |
Table 4.
Changes in HOA at 1 and 10 seconds in each group classified according to the preoperative SPK
|
Group A (SPK (-), n = 34) |
Group B (SPK (+), n = 13) |
p-value‡ | p-value§ | |||
|---|---|---|---|---|---|---|
| AVG∗ | Δ HOA | AVG∗ | Δ HOA† | |||
| Preop | 0.211 | 0.073 | 0.221 | 0.130 | 0.049 | 0.379 |
| POD 2 weeks | 0.423 | -0.001 | 0.388 | 0.021 | 0.432 | 0.175 |
| POD 4 weeks | 0.300 | 0.014 | 0.287 | 0.079 | 0.794 | 0.116 |
| POD 6 weeks | 0.251 | 0.045 | 0.229 | 0.146 | 0.335 | 0.877 |
| POD 8 weeks | 0.240 | 0.037 | 0.248 | 0.076 | 0.195 | 0.398 |
Table 5.
Pearson’s correlation coefficients of preoperative ocular surface indicators values and average HOA during 10 seconds


 PDF
PDF ePub
ePub Citation
 Print
Print


 XML Download