Abstract
Purpose
Methods
References
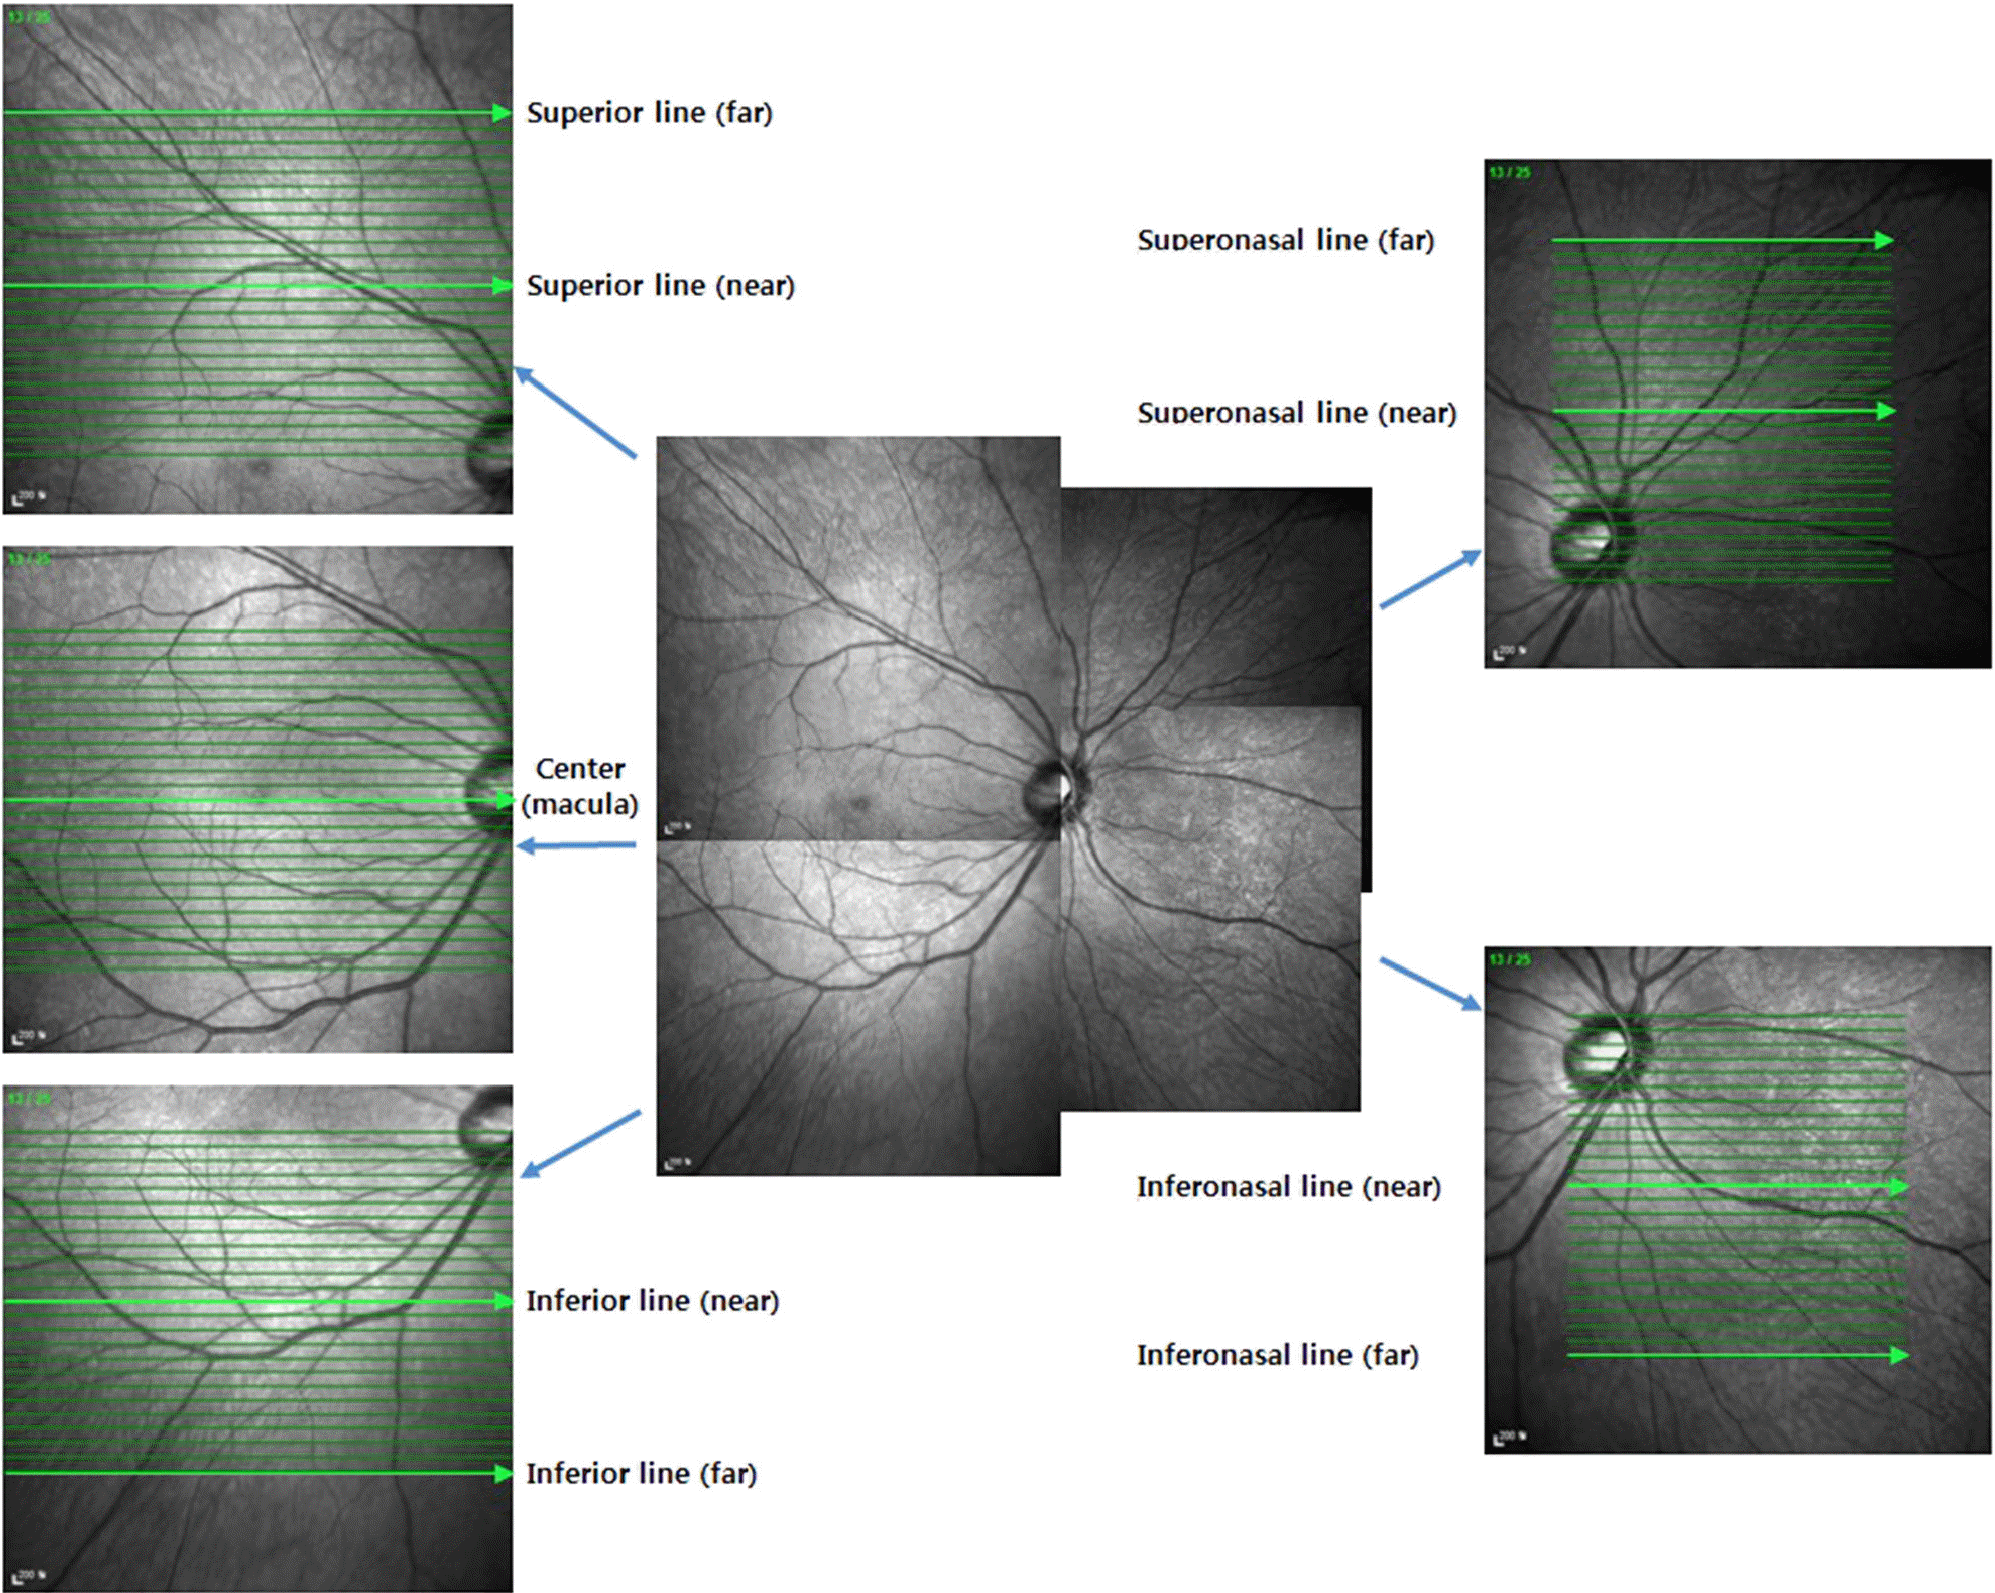
 | Figure 1.The study model about choroidal thickness of the fovea and posterior perivascular area. Choroidal thickness was measured at not only the fovea but also the superior, inferior, superonasal, inferonasal area from the fovea. |
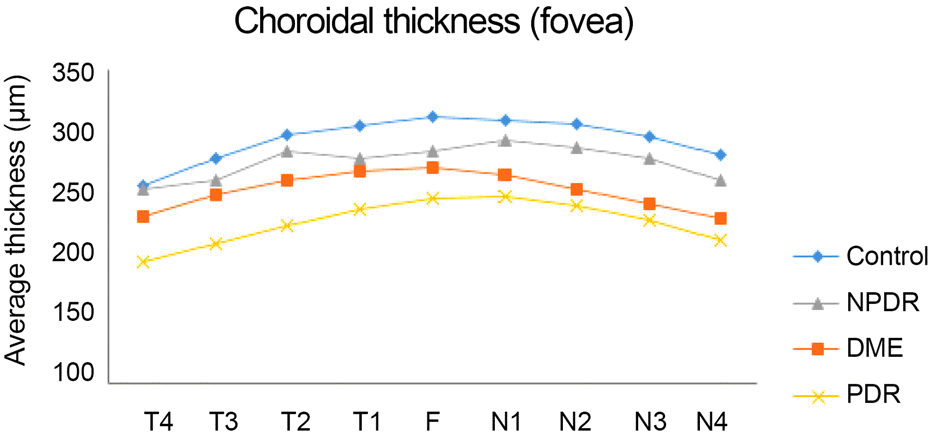
 | Figure 2.Graph of the average choroidal thickness under the fo-vea in normal subjects and patients with diabetic retinopathy (T1-4: 0.5/1.0/1.5/2.0 mm temporally apart from the fovea; N1-4: 0.5/1.0/1.5/2.0 mm nasally apart from the fovea). F = fo-vea; NPDR = nonproliferative diabetic retinopathy; DME = di-abetic macular edema; PDR = proliferative diabetic retinopathy. |
Table 1.
Table 2.
Values are presented as mean ± SD unless otherwise indicated. T1-4 is 0.5/1.0/1.5/2.0 mm temporally apart from the fovea, and N1-4 is 0.5/1.0/1.5/2.0 mm nasally apart from the fovea. NPDR = nonproliferative diabetic retinopathy; ME = macular edema; PDR = proliferative diabetic retinopathy; F = fovea.* p-value represent the results of posttest comparison on with Tukey multiple test (N3: p = 0.044; N4: p = 0.048 in NPDR/ME vs. PDR group).
Table 3.
Values are presented as mean ± SD unless otherwise indicated. Comparison of choroidal thickness of the fovea and outside of the fovea. Choroidal thickness was calculated by an average of 9 points in each line. NPDR = nonproliferative diabetic retinopathy; ME = macular edema; PDR = proliferative diabetic retinopathy.* p-value represent the results of posttest comparison on with Tukey multiple test. Tukey multiple test: Center; PDR vs. normal ( p = 0.024), superior (near); NPDR/ME+ vs. normal ( p = 0.05), PDR vs. normal ( p = 0.015), superior (far); NPDR/ME+ vs. normal ( p = 0.041), PDR vs. normal ( p = 0.004).


 PDF
PDF ePub
ePub Citation
 Print
Print


 XML Download