Abstract
Purpose
This study compared tear meniscus parameters between normal control, aqueous tear deficient dry eye, and meibo-mein gland dysfunction groups using Fourier-domain optical coherence tomography (FD-OCT).
Methods
This study included 33 normal eyes, 79 aqueous tear-deficient dry eyes (ATD), and 48 meibomein gland dysfunction dry eyes (MGD). Following routine examination including Schirmer test, tear break-up time, corneal staining, and tear meniscus parameters such as tear meniscus height (TMH), tear meniscus depth (TMD), and tear meniscus area (TMA) were obtained us-ing FD-OCT. The differences among groups were assessed.
Results
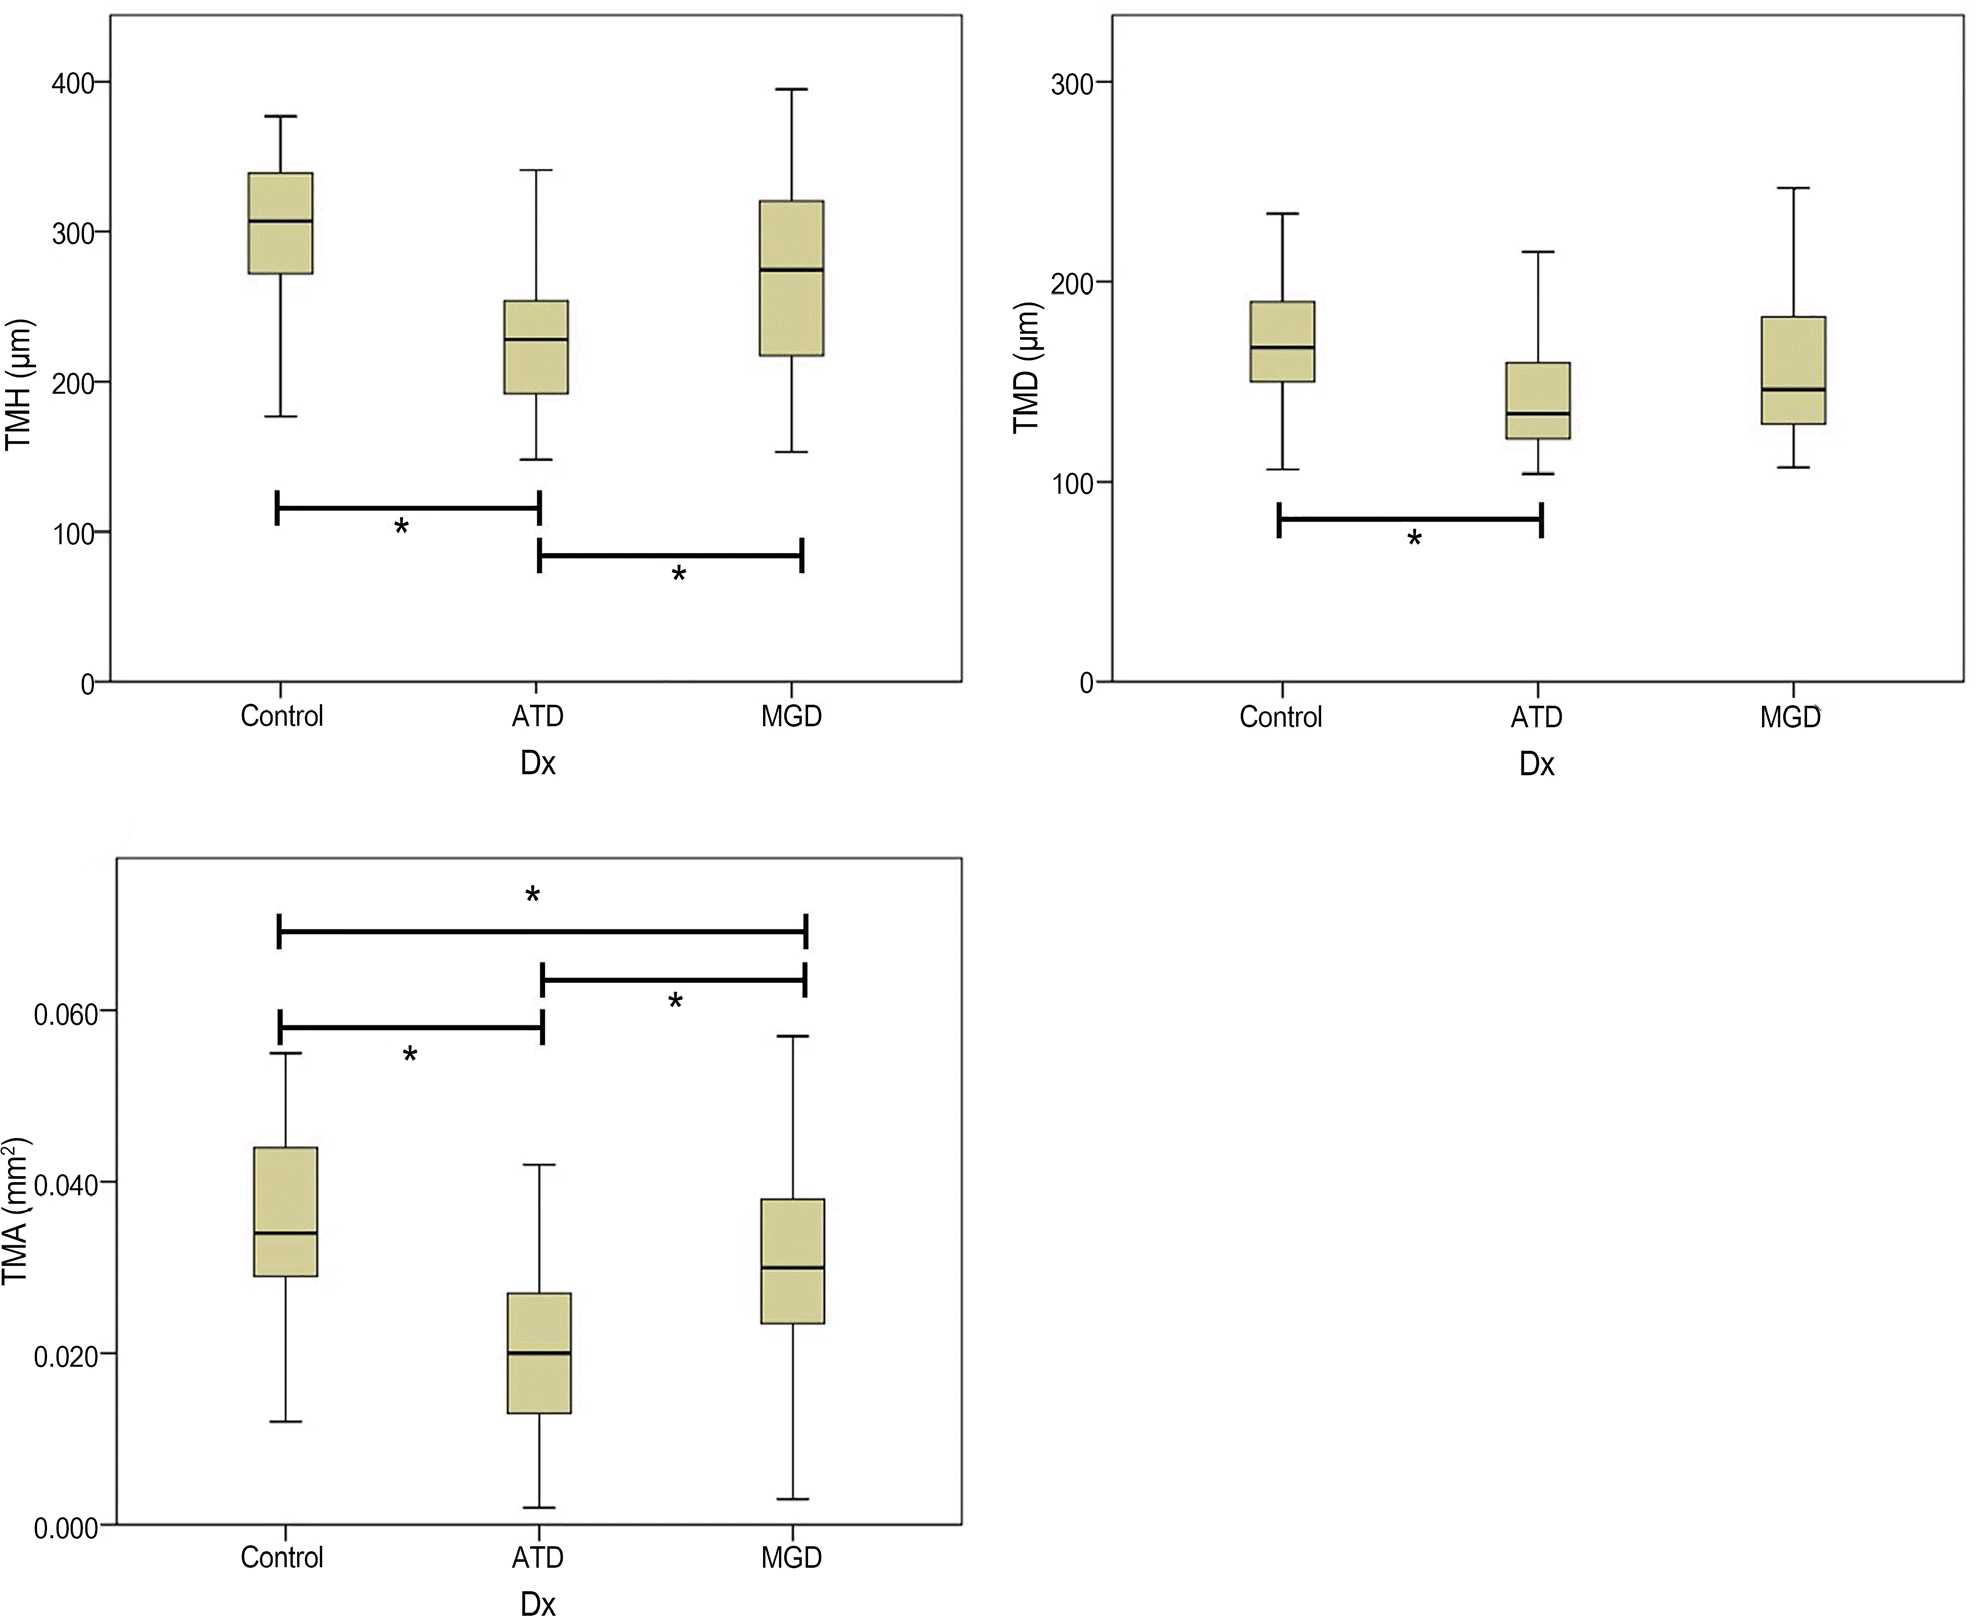
The averages of TMH, TMD, and TMA were 295.58 ± 58.36 μ m, 166.67 ± 30.43 μ m, and 0.0360 ± 0.01100 mm2 in nor-mal eyes, respectively, 226.43 ± 42.18 μ m, 147.44 ± 38.38 μ m, and 0.0209 ± 0.01015 mm2 in ATD, respectively, 272.81 ± 64.21 μ m, 159.37 ± 44.05 μ m, and 0.0295 ± 0.01271 mm2 in MGD, respectively. Tear meniscus parameters were significantly lower in ATD. Tear meniscus parameters in MGD were higher than ATD and lower than normal eyes, but the TMA was the only statisti-cally significant value.
References
1. The definition and classification of dry eye disease: report of the Definition and Classification Subcommittee of the International Dry Eye Workshop (2007). Ocul Surf. 2007; 5:75–92.
2. Fukuda R, Usui T, Miyai T. . Tear meniscus evaluation by ante-rior segment swept-source optical coherence tomography. Am J Ophthalmol. 2013; 155:620–4. 624.e1-2.

3. Holly FJ. Physical chemistry of the normal and disordered tear film. Trans Ophthalmol Soc U K. 1985; 104:(Pt 4). 374–80.
4. Yokoi N, Bron AJ, Tiffany JM. . Relationship between tear vol-ume and tear meniscus curvature. Arch Ophthalmol. 2004; 122:1265–9.

5. Mainstone JC, Bruce AS, Golding TR. Tear meniscus measure-ment in the diagnosis of dry eye. Curr Eye Res. 1996; 15:653–61.

6. Yokoi N, Bron AJ, Tiffany JM, Kinoshita S. Reflective meniscom-etry: a new field of dry eye assessment. Cornea. 2000; 19:(3 Suppl). S37–43.
7. Altan-Yaycioglu R, Sizmaz S, Canan H, Coban-Karatas M. Optical coherence tomography for measuring the tear film meniscus: cor-relation with schirmer test and tear-film breakup time. Curr Eye Res. 2013; 38:736–42.

8. Wang J, Palakuru JR, Aquavella JV. Correlations among upper and lower tear menisci, noninvasive tear break-up time, and the Schirmer test. Am J Ophthalmol. 2008; 145:795–800.

9. Ibrahim OM, Dogru M, Takano Y. . Application of visante op-tical coherence tomography tear meniscus height measurement in the diagnosis of dry eye disease. Ophthalmology. 2010; 117:1923–9.

10. Nguyen P, Huang D, Li Y. . Correlation between optical coher-ence tomography-derived assessments of lower tear meniscus pa-rameters and clinical features of dry eye disease. Cornea. 2012; 31:680–5.

11. Tung CI, Perin AF, Gumus K, Pflugfelder SC. Tear meniscus di-mensions in tear dysfunction and their correlation with clinical parameters. Am J Ophthalmol. 2014; 157:301–10.e1.

12. Qiu X, Gong L, Sun X, Jin H. Age-related variations of human tear meniscus and diagnosis of dry eye with Fourier-domain anterior segment optical coherence tomography. Cornea. 2011; 30:543–9.

13. Sahai A, Malik P. Dry eye: prevalence and attributable risk factors in a hospital-based population. Indian J Ophthalmol. 2005; 53:87–91.

14. Calonge M, Diebold Y, Sáez V. . Impression cytology of the oc-ular surface: a review. Exp Eye Res. 2004; 78:457–72.

15. Nelson JD, Shimazaki J, Benitez-del-Castillo JM. . The inter-national workshop on meibomian gland dysfunction: report of the definition and classification subcommittee. Invest Ophthalmol Vis Sci. 2011; 52:1930–7.

16. Halberg GP, Berens C. Standardized Schirmer tear test kit. Am J Ophthalmol. 1961; 51:840–2.
17. Clinch TE, Benedetto DA, Felberg NT, Laibson PR. Schirmer’s test. A closer look. Arch Ophthalmol. 1983; 101:1383–6.
18. Maurice D. The Charles Prentice award lecture 1989: the physiol-ogy of tears. Optom Vis Sci. 1990; 67:391–9.

19. Pflugfelder SC, Tseng SC, Sanabria O. . Evaluation of sub-jective assessments and objective diagnostic tests for diagnosing tear-film disorders known to cause ocular irritation. Cornea 1998; 17. 38–56.

20. Kojima T, Ishida R, Dogru M. . A new noninvasive tear stabil-ity analysis system for the assessment of dry eyes. Invest Ophthal-mol Vis Sci. 2004; 45:1369–74.

21. Zhou S, Li Y, Lu AT. . Reproducibility of tear meniscus meas-urement by Fourier-domain optical coherence tomography: a pilot study. Ophthalmic Surg Lasers Imaging. 2009; 40:442–7.

22. Shen M, Wang J, Tao A. . Diurnal variation of upper and lower tear menisci. Am J Ophthalmol. 2008; 145:801–6.

23. Savini G, Barboni P, Zanini M. Tear meniscus evaluation by optical coherence tomography. Ophthalmic Surg Lasers Imaging. 2006; 37:112–8.

Figure 1.
Measurement of optical coherence tomography (OCT) parameters of tear meniscus. (A) Tear meniscus heights (TMH) in-dicates vertical linear length between upper end of tear meniscus reaching the cornea and lower end of the tear meniscus reaching the lower conjunctiva. Tear meniscus depth (TMD) indicates horizontal linear length between the outer limit of the tear meniscus and apex. (B) Tear meniscus area (TMA) indicates the entire selection of tear meniscus shown in OCT image (arrow). Measurements of TMH, TMA, and TMD were performed using RTVue-100 software.

Figure 2.
Mean values of TMH, TMD, and TMA for each group. When compared to the control group, statistically sig-nificant differences existed in all tear meniscus parameters in the ATD group ( p = 0.000, p = 0.047, p = 0.000), but in the MGD group, only TMA was significantly low ( p = 0.030). In the MGD group, the mean TMH, TMD, and TMA was higher than the ATD group, and only TMH and TMA are statistically significant ( p = 0.000, p = 0.000). TMH = tear meniscus heights; TMD = tear meniscus depth; TMA = tear meniscus area; ATD = aqueous tear deficiency; MGD = meibomian gland dysfunction; Dx = diagnosis. * Denotes statistically sig-nificance compared between groups indicated.

Figure 3.
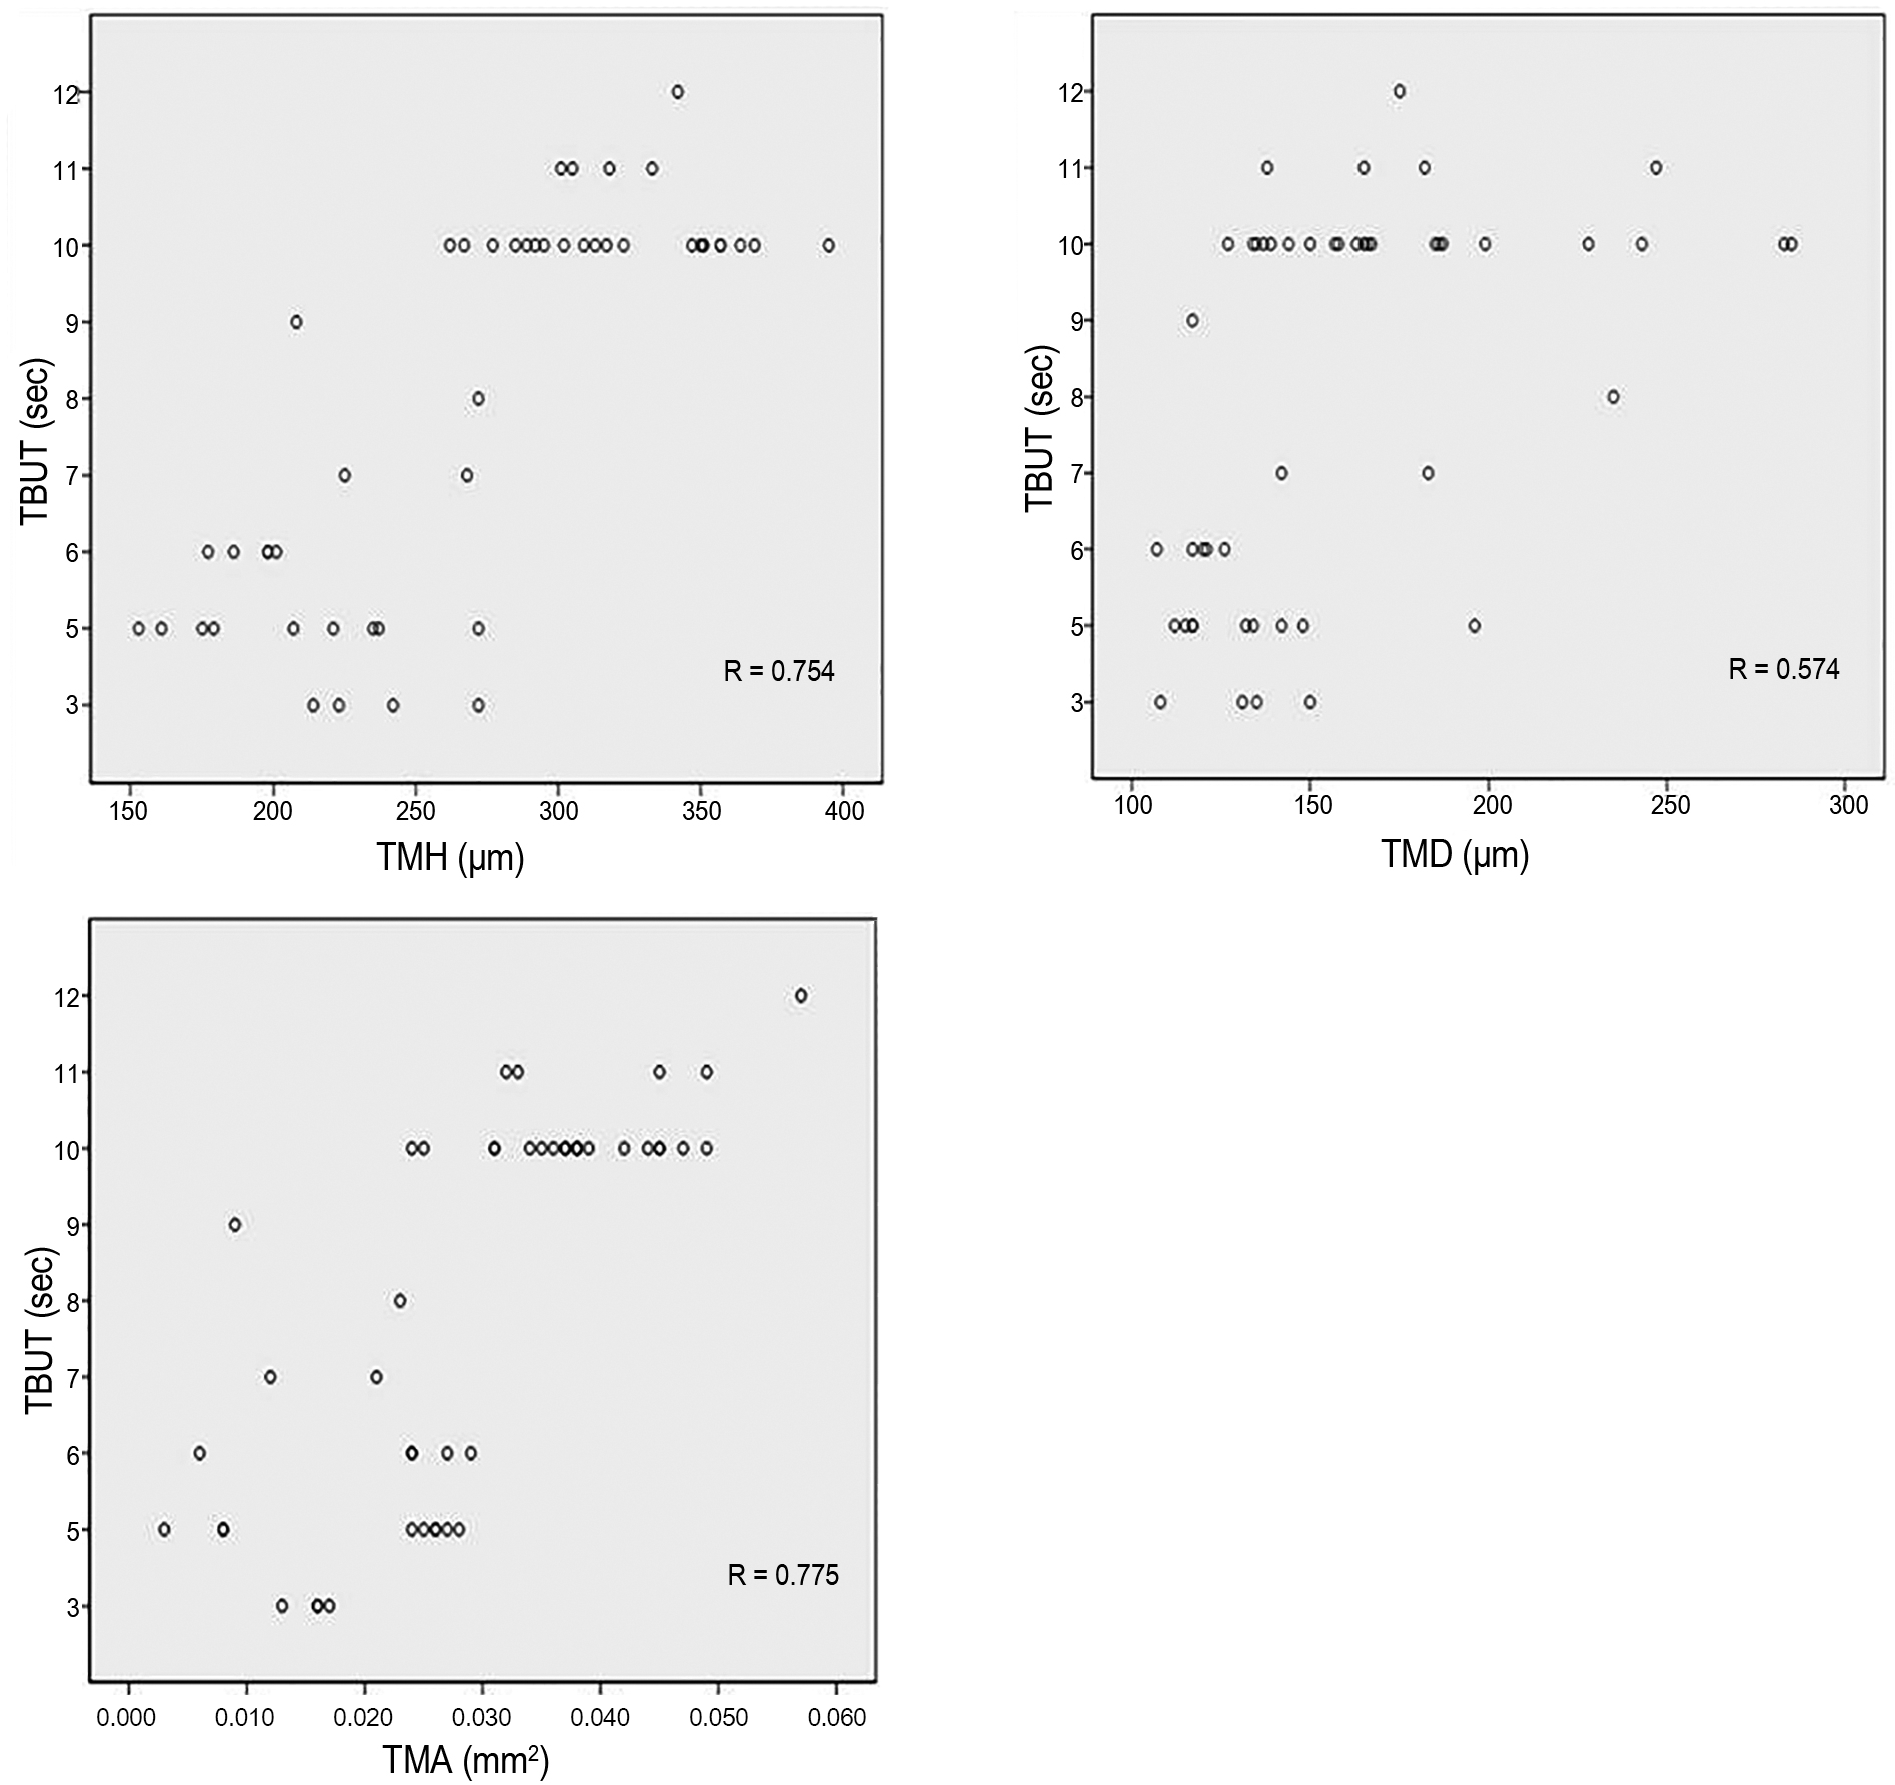
Spearman correlation between tear meniscus parame-ters and TBUT in meibomian gland dysfunction patients. Correlation graphs between TBUT and (A) TMH, (B) TMD, and (C) TMA. TBUT = tear break-up time; TMH = tear meniscus heights; TMD = tear meniscus depth; TMA = tear meniscus area.

Figure 4.
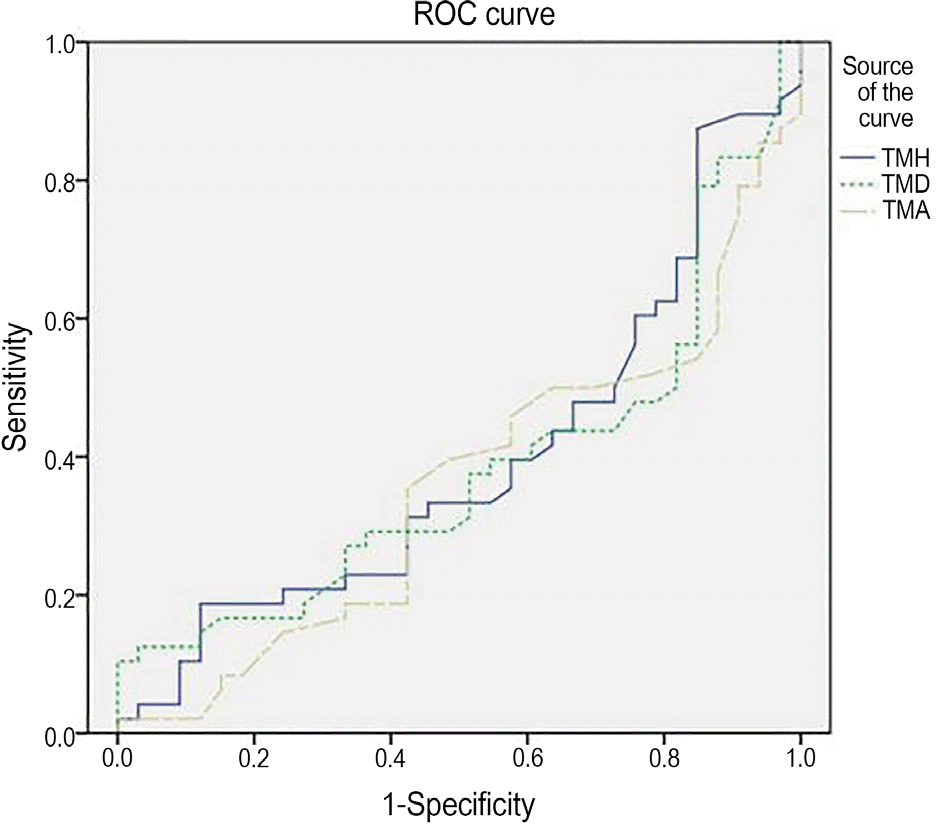
The ROC curves of TMH, TMD, and TMA in meibo-mian gland dysfunction group. Area under the ROC of TMH, TMD, and TMA is 0.396, 0.384, 0.357, respectively. ROC = receiver operator characteristic; TMH = tear meniscus heights; TMD = tear meniscus depth; TMA = tear meniscus area.

Table 1.
Demographic characteristics of dry eye patients and control groups
| Groups | Control | ATD | MGD | Total | p-value* |
|---|---|---|---|---|---|
| N (eyes) | 33 | 79 | 48 | 160 | |
| Age (years) | 54.24 (±11.42) | 56.34 (±3.73) | 59.35 (±12.25) | 56.81 (±12.90) | 0.061 |
| Male/female ratio | 0.57 | 0.46 | 0.33 | 0.44 |
Table 2.
Tear meniscus parameters measured by Fourier domain optical coherence tomography
|
Control |
ATD (n = 79) |
MGD (n = 48) |
|||
|---|---|---|---|---|---|
| Mean ± SD | Mean ± SD | p-value* | Mean ± SD | p-value* | |
| TMH (μ m) | 295.58 ± 58.363 | 226.43 ± 42.177 | 0.000 | 272.81 ± 64.206 | 0.143 |
| TMD (μ m) | 166.67 ± 30.426 | 147.44 ± 38.379 | 0.047 | 159.38 ± 44.054 | 0.684 |
| TMA (mm2) | 0.0360 ± 0.01100 | 0.0209 ± 0.01015 | 0.000 | 0.0295 ± 0.01271 | 0.030 |
Table 3.
Clinical tear parameters in the dry eye and control groups
|
Control |
ATD (n = 79) |
MGD (n = 48) |
|||
|---|---|---|---|---|---|
| Mean ± SD | Mean ± SD | p-value* | Mean ± SD | p-value* | |
| ST (mm) | 10.61 ± 3.240 | 5.82 ± 1.998 | 0.000 | 8.58 ± 3.718 | 0.022 |
| TBUT (second) | 9.88 ± 1.867 | 5.23 ± 1.867 | 0.000 | 8.00 ± 2.690 | 0.000 |
| Corneal staining (score) | 0.33 ± 0.467 | 1.56 ± 0.729 | 0.000 | 0.75 ± 0.863 | 0.015 |


 PDF
PDF ePub
ePub Citation
 Print
Print


 XML Download