Abstract
Purpose
Although various sampling methods of tears from conjunctival sac have been reported, no previous study compared their effectiveness or efficiency based on protein extraction. By comparing the compliance, volume and protein concentration of each tear sampling method, we searched for the most efficient tear collection method.
Methods
Resting tear samples of 14 eyes of normal subjects were collected using Schirmer paper, capillary tube, cellolose ace-tate rod and 3 different ophthalmic sponges made of different materials and density (Merocel®, KeraCel® and Weck-Cel®). After centrifugation of the collected tear samples, the tear volume and protein concentration were measured for each method. Additionally, the compliance of each tear sampling method was analyzed by numerically representing the amount of discomfort experienced during resting tear collection.
Results
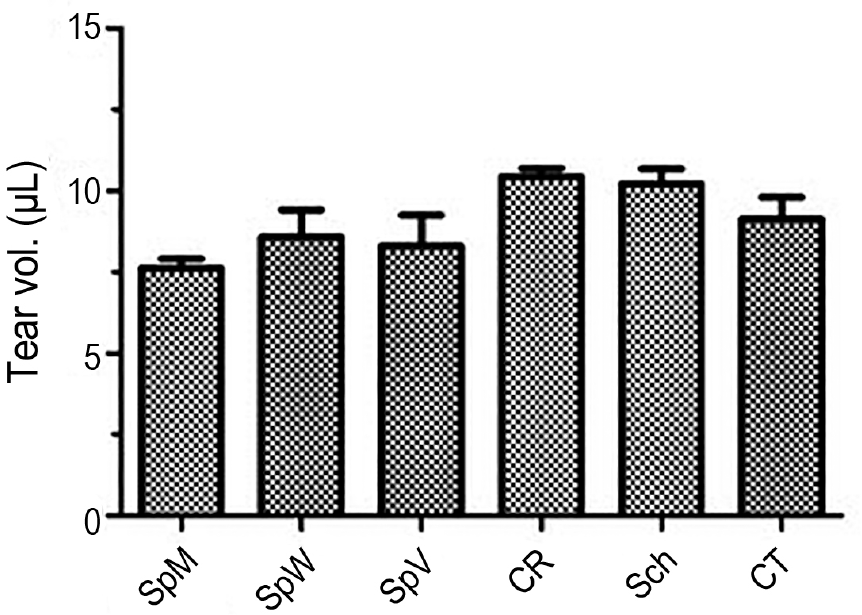
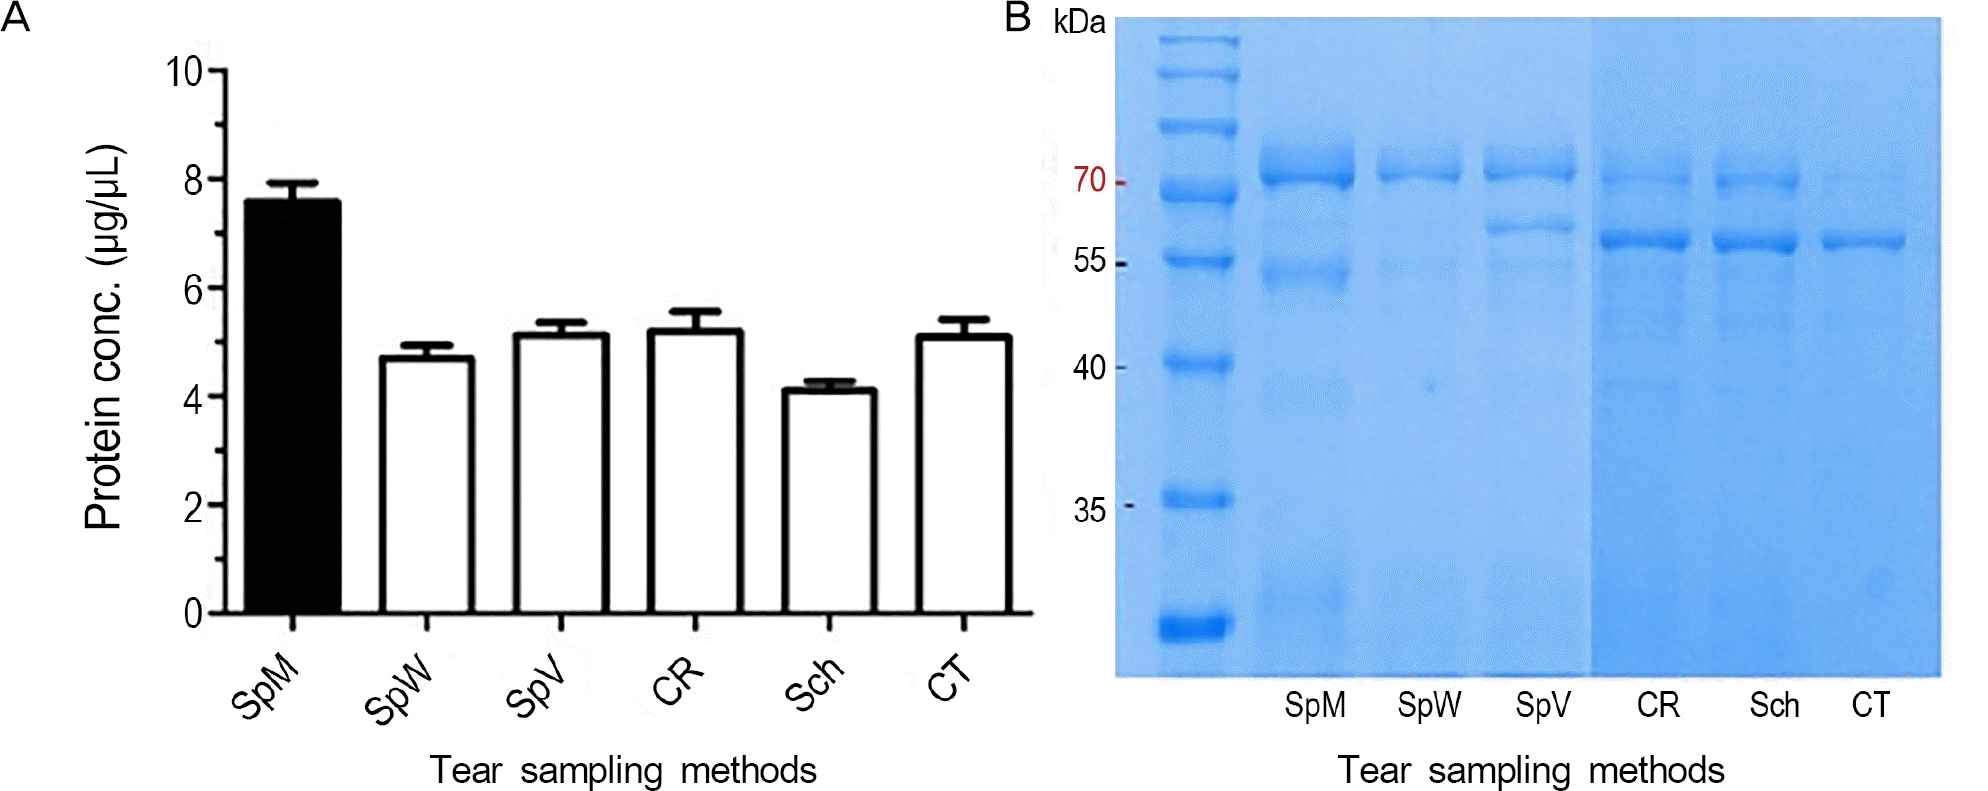
The average volume retrieved by each tear sampling method was 9.0 ± 1.1 µL with no significant differences between groups. The average concentration of protein retrieved by each tear sampling method was 5.3 ± 1.2 µg/µL. Merocel® retrieved 7.6 ± 0.61 µg/µL, which was significantly higher than other sampling methods ( p < 0.05). The compliance of Merocel® and the ca-pillary tube were the highest, while KeraCel® showed the lowest compliance.
Go to : 
References
1. Ohashi Y, Dogru M, Tsubota K. Laboratory findings in tear fluid analysis. Clin Chim Acta. 2006; 369:17–28.

2. Wu K, Zhang Y. Clinical application of tear proteomics: present and future prospects. Proteomics Clin Appl. 2007; 1:972–82.

3. Lam SM, Tong L, Duan X. . Extensive characterization of hu-man tear fluid collected using different techniques unravels the presence of novel lipid amphiphiles. J Lipid Res. 2014; 55:289–98.

4. de Souza GA, Godoy LM, Mann M. Identification of 491 proteins in the tear fluid proteome reveals a large number of proteases and protease inhibitors. Genome Biol. 2006; 7:R72.
5. Soria J, Durán JA, Etxebarria J. . Tear proteome and protein network analyses reveal a novel pentamarker panel for tear film characterization in dry eye and meibomian gland dysfunction. J Proteomics. 2013; 78:94–112.

6. Li B, Sheng M, Li J. . Tear proteomic analysis of Sjögren syn-drome patients with dry eye syndrome by two-dimensional- nano-liquid chromatography coupled with tandem mass spectrometry. Sci Rep. 2014; 4:5772.

7. Versura P, Nanni P, Bavelloni A. . Tear proteomics in evapo-rative dry eye disease. Eye (Lond). 2010; 24:1396–402.

8. Chae JK, Park SP, Choi TH. Comparative analysis of the tear pro-tein expression after photorefractive keratectomy using two-di-mensional electrophoresis. J Korean Ophthalmol Soc. 2009; 50:762–8.

9. Zhou L, Beuerman RW, Chan CM. . Identification of tear fluid biomarkers in dry eye syndrome using iTRAQ quantitative proteomics. J Proteome Res. 2009; 8:4889–905.

10. Labbé A, Brignole-Baudouin F, Baudouin C. Ocular surface inves-tigations in dry eye. J Fr Ophtalmol. 2007; 30:76–97.
11. Quah JH, Tong L, Barbier S. Patient acceptability of tear collection in the primary healthcare setting. Optom Vis Sci. 2014; 91:452–8.

12. Posa A, Bräuer L, Schicht M. . Schirmer strip vs. capillary tube method: non-invasive methods of obtaining proteins from tear fluid. Ann Anat. 2013; 195:137–42.

13. Esmaeelpour M, Cai J, Watts P. . Tear sample collection using cellulose acetate absorbent filters. Ophthalmic Physiol Opt. 2008; 28:577–83.

14. Inic-Kanada A, Nussbaumer A, Montanaro J. . Comparison of ophthalmic sponges and extraction buffers for quantifying cyto-kine profiles in tears using Luminex technology. Mol Vis. 2012; 18:2717–25.
15. The definition and classification of dry eye disease: report of the Definition and Classification Subcommittee of the International Dry Eye WorkShop (2007). Ocul Surf. 2007; 5:75–92.
16. Stuchell RN, Feldman JJ, Farris RL, Mandel ID. The effect of col-lection technique on tear composition. Invest Ophthalmol Vis Sci. 1984; 25:374–7.
17. Gachon AM, Richard J, Dastugue B. Human tears: normal protein pattern and individual protein determinations in adults. Curr Eye Res 1982-1983. 2:301–8.

18. Ng V, Cho P, To C. Tear proteins of normal young Hong Kong Chinese. Graefes Arch Clin Exp Ophthalmol. 2000; 238:738–45.

19. López-Cisternas J, Castillo-Díaz J, Traipe-Castro L, López-Solís RO. Use of polyurethane minisponges to collect human tear fluid. Cornea. 2006; 25:312–8.

20. Zhou L, Beuerman RW. Tear analysis in ocular surface diseases. Prog Retin Eye Res. 2012; 31:527–50.

21. Hyon SH, Cha WI, Ikada Y. . Poly(vinyl alcohol) hydrogels as soft contact lens material. J Biomater Sci Polym Ed. 1994; 5:397–406.

Go to : 
 | Figure 1.Schematic diagram of the protocol for tear collection by Merocel® ophthalmic sponge. (A) One drop of topical anes-thesia was applied on both eyes. (B) After five seconds, 50 mi-croliters of normal saline was dropped at the lateral con-junctival sac (white arrow). (C) Tear fluid was collected at the lateral conjunctival sac immediately after applying normal saline. There was at least three day interval between each method of tear film collection. |
 | Figure 2.Centrifuging method for collected tear samples. (A) Tear fluid containing samples were fixed in a pin-holed 0.2 mL eppen-dorf tube. (B) The 0.2 mL eppendorf tube containing tear sample was fixed in a half-cut pipette tip. (C) The half-cut pipette tip was fixed in a 1.5 mL eppendorf tube. Paraffin taping was done to prevent loss of tear fluid samples. After, that the sample was centri-fuged at 13,000 rpm, 4°C for 5 minutes. |
 | Figure 4.Comparison of protein concentration of extracted tear fluid by electrophoresis. (A) Quantitative comparison of protein concentration of extracted tear fluid by electrophoresis. SpM showed significantly higher concentration of protein compared to other methods ( p < 0.05). (B) Electrophoresis was performed for each tear samples collected by different methods. SpM = Merocel®; SpW = Weck-Cel®; SpV = KeraCel®; CR = cellolose acetate rod; Sch = Schirmer; CT = capillary tube; conc. = concentration. |
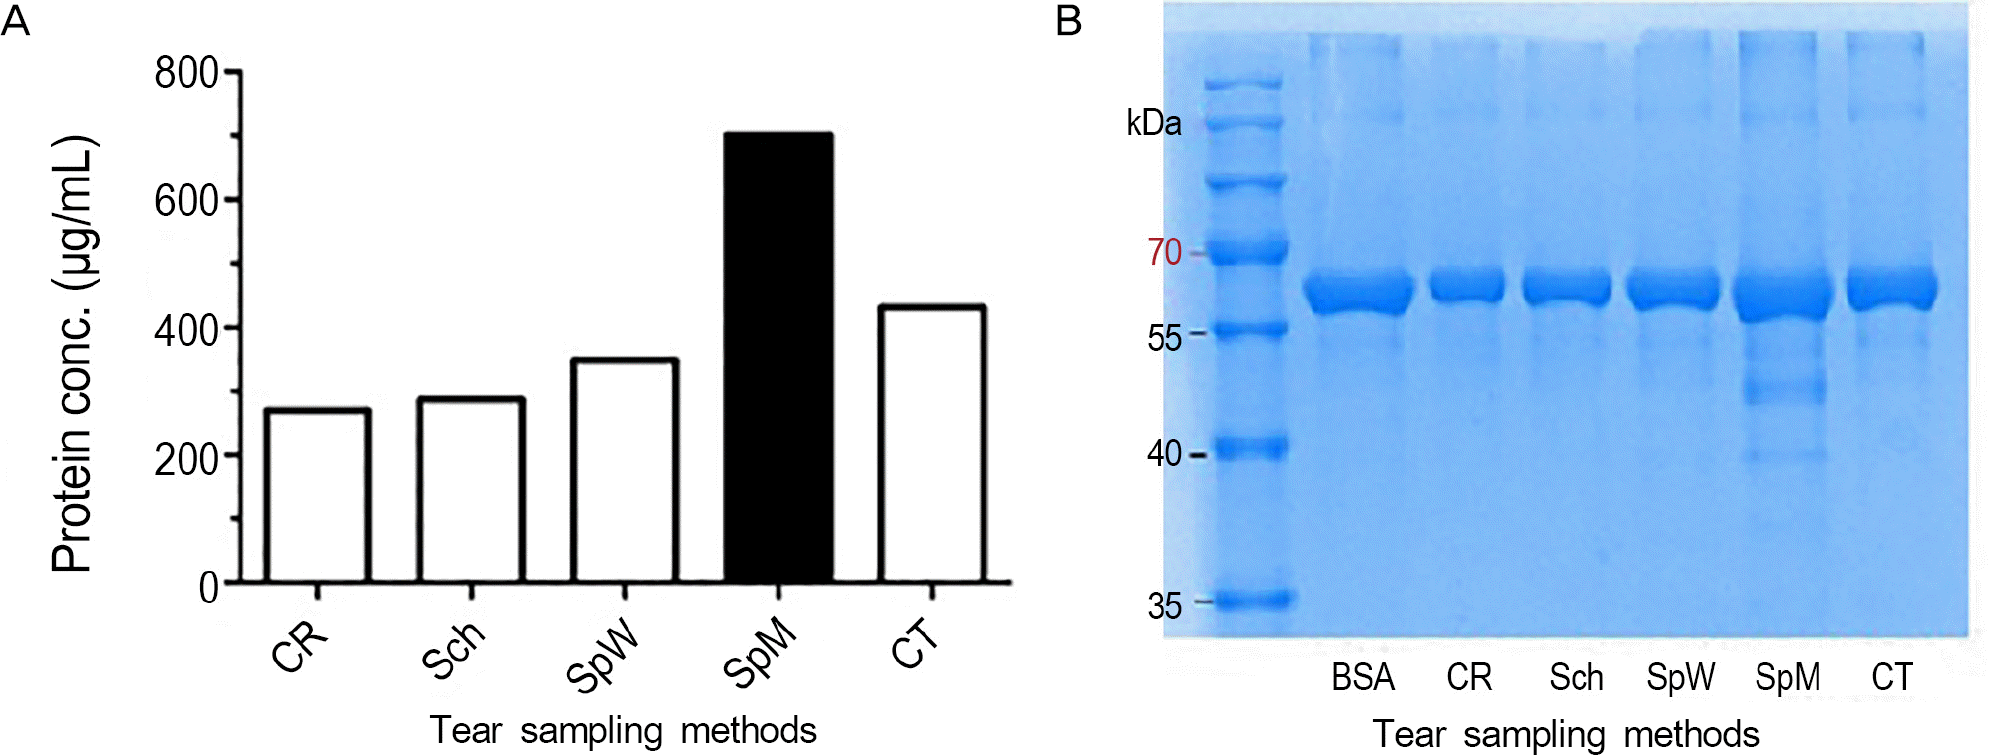
 | Figure 5.Comparison of protein concentration of 0.5% Bovine serum albumin after collection and extraction. (A) Quantitative com-parison of protein concentration of 0.5% Bovine serum albumin after collection and extraction. SpM showed significantly higher concentration of protein concentration compared to other methods ( p < 0.05). (B) Electrophoresis was performed for each samples collected by different methods. CR = cellolose acetate rod; Sch = Schirmer; SpW = Weck-Cel®; SpM = Merocel®; CT = capil-lary tube; conc. = concentration; BSA = bovine serum albumin. |
 | Figure 5.Comparison of protein concentration of 0.5% Bovine serum albumin after collection and extraction. (A) Quantitative comparison of protein concentration of 0.5% Bovine serum albumin after collection and extraction. SpM showed significantly higher concentration of protein concentration compared to other methods (p < 0.05). (B) Electrophoresis was performed for each samples collected by different methods. CR = cellolose acetate rod; Sch = Schirmer; SpW = Weck-Cel®; SpM = Merocel®; CT = capillary tube; conc. = concentration; BSA = bovine serum albumin. |
Table 1.
Pain scoring during tear sampling
| CR | Sch | SpM | SpW | SpV | CT | |
|---|---|---|---|---|---|---|
| Average pain score | 2.6 | 1.8 | 1.5 | 1.8 | 3.0 | 1.6 |
Pain score grading; 1: No discomfort during the procedure, 2: Moderate discomfort during the procedure, 3: Severe discomfort during the procedure. CR = cellolose acetate rod; Sch = Schirmer; SpM = Merocel®; SpW = Weck-Cel®; SpV = KeraCel®; CT = capillary tube.
CR = cellolose acetate rod; Sch = Schirmer; SpM = Merocel®; SpW = Weck-Cel®; SpV = KeraCel®; CT = capillary tube.


 PDF
PDF ePub
ePub Citation
 Print
Print


 XML Download