Abstract
Purpose:
In the present study, we evaluated the learning curve of strabismus surgery performed by a single surgeon.
Methods:
We reviewed the data of 62 patients with exodeviation who underwent strabismus surgery and were followed up for at least 3 months between March 2011 and November 2014. Patients were divided into 3 groups classified chronologically and the success rate in each group was investigated. Additionally, the results of exotropia surgery were analyzed using cumulative sum (CUSUM) analysis. We compared 5 m distal angle deviation preoperatively and 3 months after strabismus surgery.
Results:
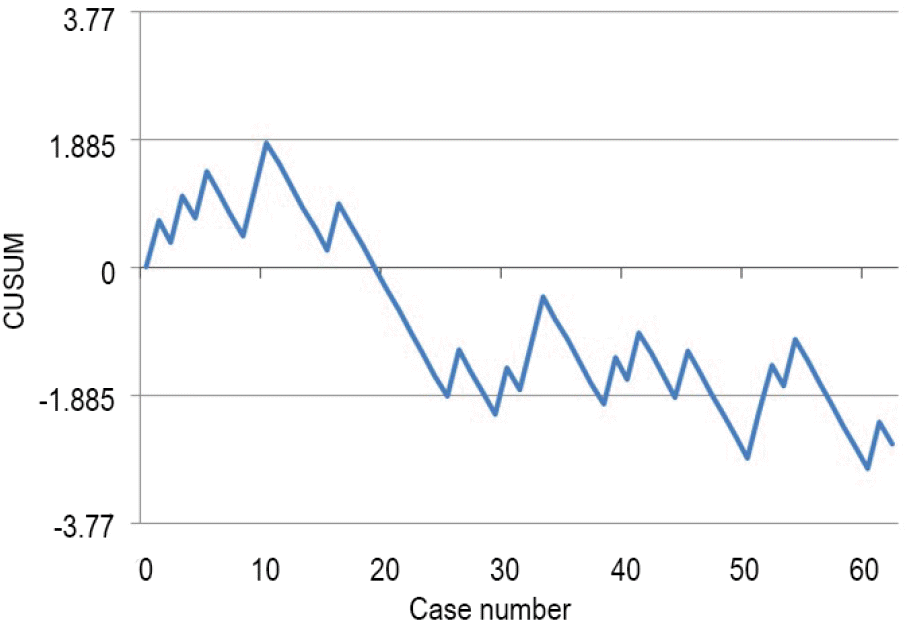
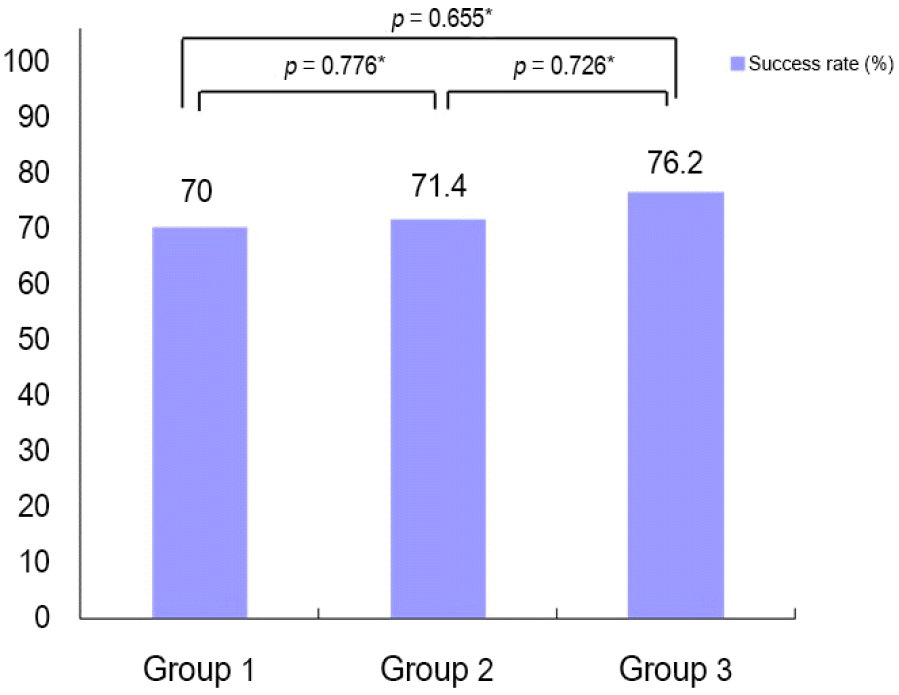
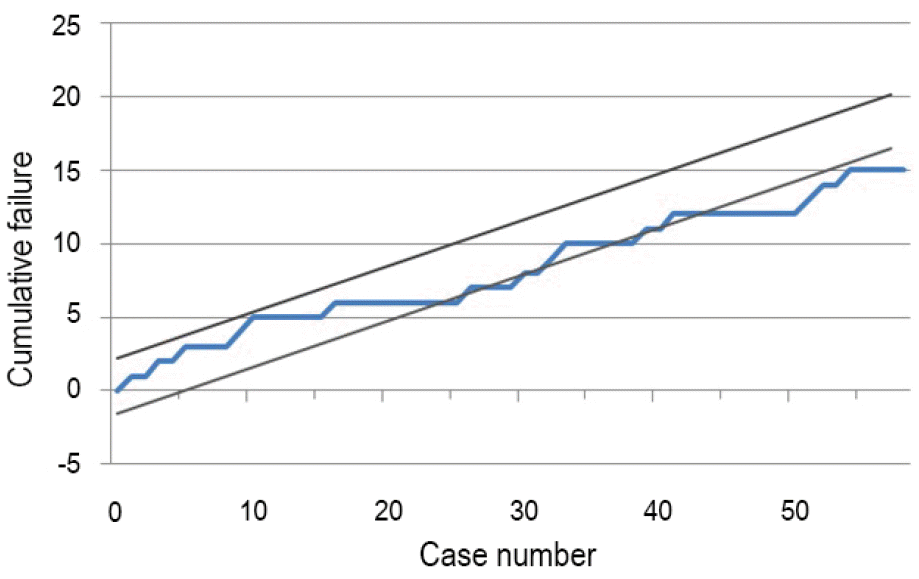
The overall surgical success rate of 62 patients was 72.6% (45/62). Success rates were 70% (14/20) in the first group, 71.4% (15/21) in the second group and 76.2% (16/21) in the third group. CUSUM analysis indicated that a surgeon’s perform-ance begins to improve at attempt number 11 and cumulative failure chart suggested the surgeon had achieved acceptable level of performance after 44 surgeries.
Conclusions:
A novice strabismus surgeon showed performance improvement after 11 cases and achieved acceptable level of performance after 44 strabismus surgeries. Although additional statistical data using more cases is needed, we suggest sur-geons should perform at least 50 strabismus surgeries to ensure a high success rate.
Go to : 
References
1. Remy C, Aracil P. History of strabismus surgery. J Fr Ophtalmol. 1984; 7:493–8.
2. Parks MM, Mirchell PR. Concomittant exodeviations. Duane TD, Jaeger EA, editors. Clinical Ophthalmology. 1. Philadelphia: JB Lippincott;1999. p. 1–12.
3. Kim HS, Suh YW, Kim SH, Cho YA. Consecutive esotropia in in-termittent exotropia patients with immediate postoperative over-correction more than 17 prism diopters. Korean J Ophthalmol. 2007; 21:155–8.
4. Yap CH, Colson ME, Watters DA. Cumulative sum techniques for surgeons: a brief review. ANZ J Surg. 2007; 77:583–6.

5. Seo KY, Sohn YD, Ahn JY, et al. Evaluation of proficiency in chest compression by learning curve-cumulative sum analysis. J Korean Soc Emerg Med. 2010; 21:293–8.
6. Mills MD, Coats DK, Donahue SP, et al. Strabismus surgery for adults: a report by the American Academy of Ophthalmology. Ophthalmology. 2004; 111:1255–62.
7. Keech RV, Stewart SA. The surgical overcorrection of intermittent exophoria. J Pediatr Ophthalmol Strabismus. 1990; 27:218–20.
8. Gu BY, Kim WJ, Son JH. Learning curve for endonasal dacryocystorhinostomy. J Korean Ophthalmol Soc. 2011; 52:519–23.

9. Martin KR, Burton RL. The phacoemulsification learning curve: per-operative complications in the first 3000 cases of an experi-enced surgeon. Eye (Lond). 2000; 14((Pt 2)):190–5.

Go to : 
 | Figure 3.Cumulative sum (CUSUM) chart for strabismus surgery. Blue line represent learning curve of surgeon. Upper and lower limits are represented by the lines h0 (-1.855) and h1(1.855). Line crossing h0 from above indicate failure rates not significantly different from the acceptable failure rate. |
 | Figure 1.Success rates of strabismus surgery classified * p-values were calculated using chi-square chronologically. test. |
 | Figure 2.Cumulative failure (CF) graph of a series of 62 stra-bismus surgery by single surgeon from March 2011 to November 2014. CF acceptable rate set at 0.20, CF unacceptable failure rate set at 0.45. Type Ⅰ and Ⅱ error rates set at 0.10. |
Table 1.
Formulas and values involved in CUSUM curve
| Variables | Value |
|---|---|
| α∗ | 0.1 |
| β† | 0.1 |
| ρ0 | 0.2 |
| ρ1 | 0.45 |
| P = ln ρ1/ρ0 | 0.811 |
| Q = ln (1-ρ0)/(1-ρ1) | 0.375 |
| S = Q/(P+Q) | 0.316 |
| a = ln (1-β)/α | 2.197 |
| b = ln (1-α)/β | 2.197 |
| h = a/(P+Q) | 1.855 |
Table 2.
Basal characteristic of subjects
| Group 1 | Group 2 | Group 3 | p-value | |
|---|---|---|---|---|
| No. (n, %) | 20 (32.3) | 21 (33.9) | 21 (33.9) | |
| Age (years) | 42.9 ± 26.4 | 45.4 ± 27.7 | 45.4 ± 25.5 | 0.667∗ |
| Sex (M:F) | 15:5 | 14:7 | 12:9 | 0.481† |
| Diagnosis | 0.219† | |||
| Intermittent exotropia | 9 | 15 | 13 | |
| Sensory exotropia | 11 | 6 | 8 | |
| Mean deviation (PD) | ||||
| Intermittent exotropia | 31.7 ± 7.5 | 34.7 ±10.1 | 32.0 ± 11.5 | 0.696∗ |
| Sensory exotropia | 35.0 ± 9.2 | 30.0 ± 6.12 | 29.3 ± 14.6 | 0.486∗ |
| Surgery type | ||||
| R & R | 18 | 11 | 8 | |
| Both LR recession | 1 | 8 | 7 | |
| Single LR recession | 1 | 2 | 6 | |


 PDF
PDF ePub
ePub Citation
 Print
Print


 XML Download