Abstract
Purpose:
To compare the accuracy of refractive outcome measured by Ultrascan® (Alcon, Fort Worth, TX, USA) and partial co-herence interferometers after phacovitrectomy.
Methods:
We performed a retrospective study in 74 eyes of 74 patients who underwent phacovitrectomy. SRK-T formula was used to predict intraocular lens (IOL) power. The difference between the predicted and postoperative refractive outcomes for the 2 methodologies (Ultrascan® and IOL Master® [Zeiss, Carl Zeiss, Jena, Germany]) were compared. The predicted refractive out-come was defined as the estimated refractive error when the selected IOL was inserted.
Results:
The axial length measured using IOL Master® was statistically longer than when measured using Ultrascan® (23.85 ±0.15 mm, 23.56 ± 0.15 mm, p < 0.001). Based on keratometry, statistically significant difference between the 2 groups was not observed. The postoperative refractive error was more accurate when using the IOL Master® than Ultrascan® (0.08 ± 0.74, 0.47 ± 0.69, p < 0.001). However, in cases of vitreous hemorrhage, the postoperative refractive error was 0.42 ± 0.49 with the IOL Master® and 0.07 ± 0.54 with the Ultrascan®.
Go to : 
References
1. Koenig SB, Han DP, Mieler WF, et al. Combined phacoemulsifica-tion and pars plana vitrectomy. Arch Opthalmol. 1990; 108:362–4.

2. Scharwey K, Pavlovic S, Jacobi KW. Combined clear corneal pha-coemulsification, vitreoretinal surgery, and intraocular lens implantation. J Cataract Refract Surg. 1999; 25:693–8.

3. Han NS, Lee SB, Kim YB, Jo YJ. Results of triple surgery: cataract extraction, intraocular lens implantation and vitrectomy for retinal detachment. J Korean Ophthalmol Soc. 2004; 45:2041–6.
4. Giers U, Epple C. Comparison of A-scan device accuracy. J Cataract Refract Surg. 1990; 16:235–42.

5. Findle O, Drexler W, Menapace R, et al. Improved prediction of in-traocular lens power using partial coherence interferometry. J Cataract Refract Surg. 2001; 27:861–7.
6. Tehrani M, Krummenauer F, Blom E, Dick HB. Evaluation of the practicality of optical biometry and applanation ultrasound in 253 eyes. J Cataract Refract Surg. 2003; 29:741–6.

7. Shioya M, Ogino N, Shinjo U. Change in postoperative refractive error when vitrectomy is added to intraocular lens implantation. J Cataract Refract Surg. 1997; 23:1217–20.

8. Kovács I, Ferencz M, Nemes J, et al. Intraocular lens power calcu-lation for combined cataract surgery, vitrectomy and peeling of epi-retinal membranes for macular edema. Acta Ophthalmol Scand. 2007; 85:88–91.
9. Falkner-Radler CI, Benesch T, Binder S. Accuracy of preoperative biometry in vitrectomy combined with cataract surgery for patients with epiretinal membranes and macular holes: results of a pro-spective controlled clinical trial. J Cataract Refract Surg. 2008; 34:1754–60.
10. Gu BY, Sagong M, Chang WH. Phacovitrectomy versus vi-trectomy only for primary rhegmatogenous retinal detachment repair. J Korean Ophthalmol Soc. 2011; 52:537–43.

11. Hurley C, Barry P. Combined endocapsular phacoemulsification, pars plana vitrectomy, and intraocular lens implantation. J Cataract Refract Surg. 1996; 22:462–6.

12. Androudi S, Ahmed M, Fiore T, et al. Combined pars plana vi-trectomy and phacoemulsification to restore visual acuity in pa-tients with chronic uveitis. J Cataract Refract Surg. 2005; 31:472–8.

13. Holladay JT, Prager TC, Ruiz RS, et al. Improving the predict-ability of intraocular lens power calculations. Arch Ophthalmol. 1986; 104:539–41.

14. Haigis W, Lege B, Miller N, Schneider B. Comparison of im-mersion ultrasound biometry and partial coherence interferometry for intraocular lens calculation according to Haigis. Graefes Arch Clin Exp Ophthalmol. 2000; 238:765–73.

15. Rajan MS, Keilhorn I, Bell JA. Partial coherence laser inter-ferometry vs conventional ultrasound biometry in intraocular lens power calculations, Eye (Lond). 2002; 16:552–6.
16. Auffarth GU, Tetz MR, Biazid Y, Völcker HE. Measuring anterior chamber depth with Orbscan Topography system. J Cataract Refract Surg. 1997; 23:1351–5.
17. Manvikar SR, Allen D, Steel DH. Optical biometry in combined phacovitrectomy. J Cataract Refract Surg. 2009; 35:64–9.

18. Kunavisarut P, Poopattanakul P, Intarated C, Pathanapitoon K. Accuracy and reliability of IOL master and A-scan immersion bio-metry in silicone oil-filled eyes. Eye (Lond). 2012; 26:1344–8.

Go to : 
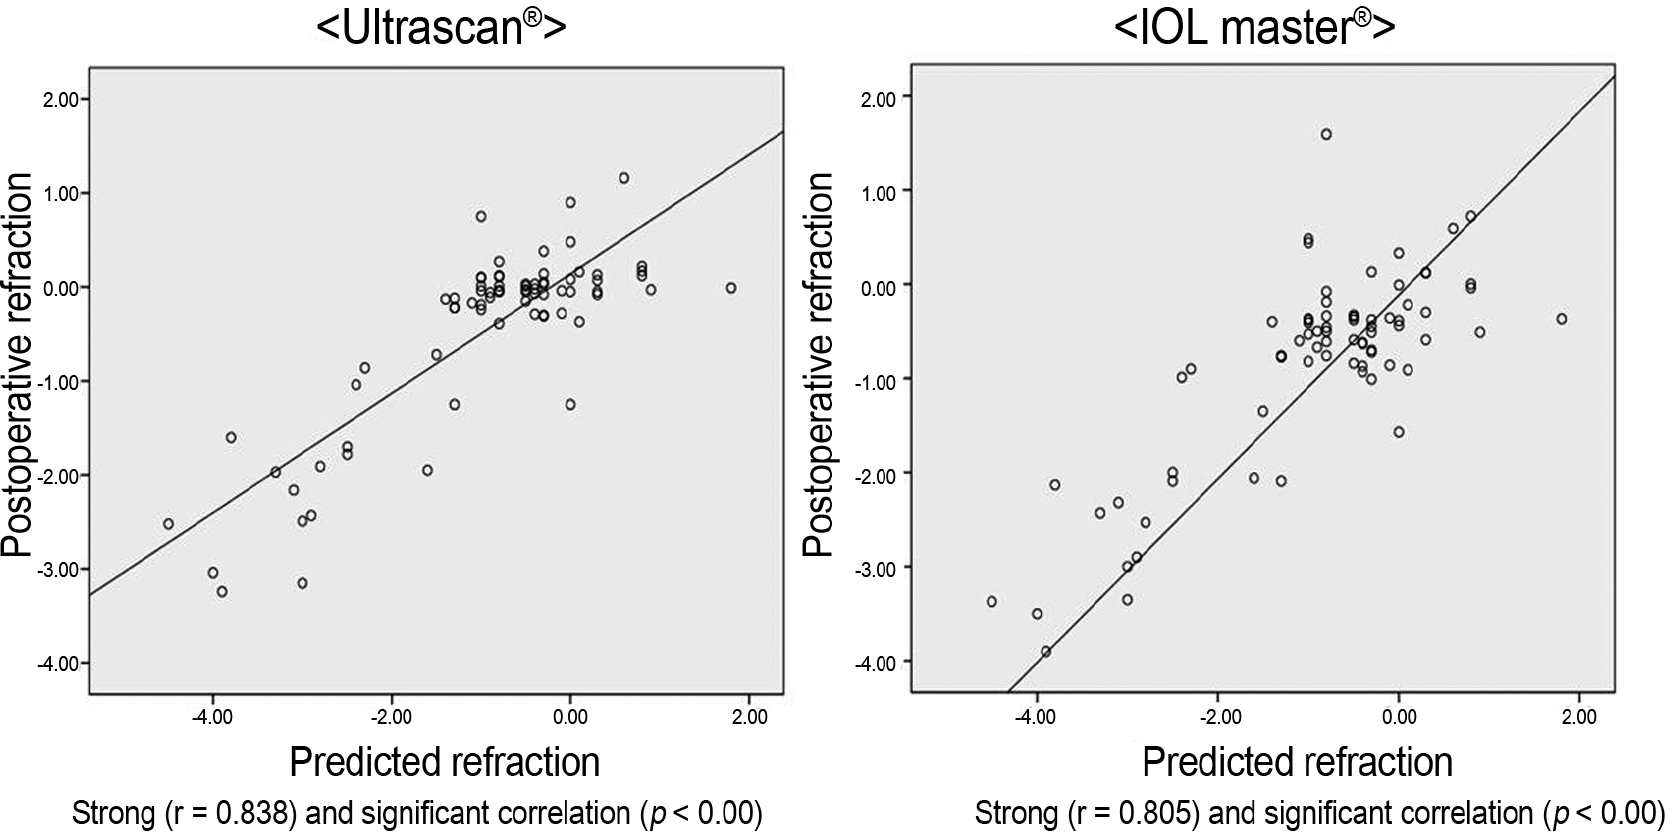
 | Figure 1.Linear regression analysis of postoperative and predictive refraction. IOL = intraocular lens. |
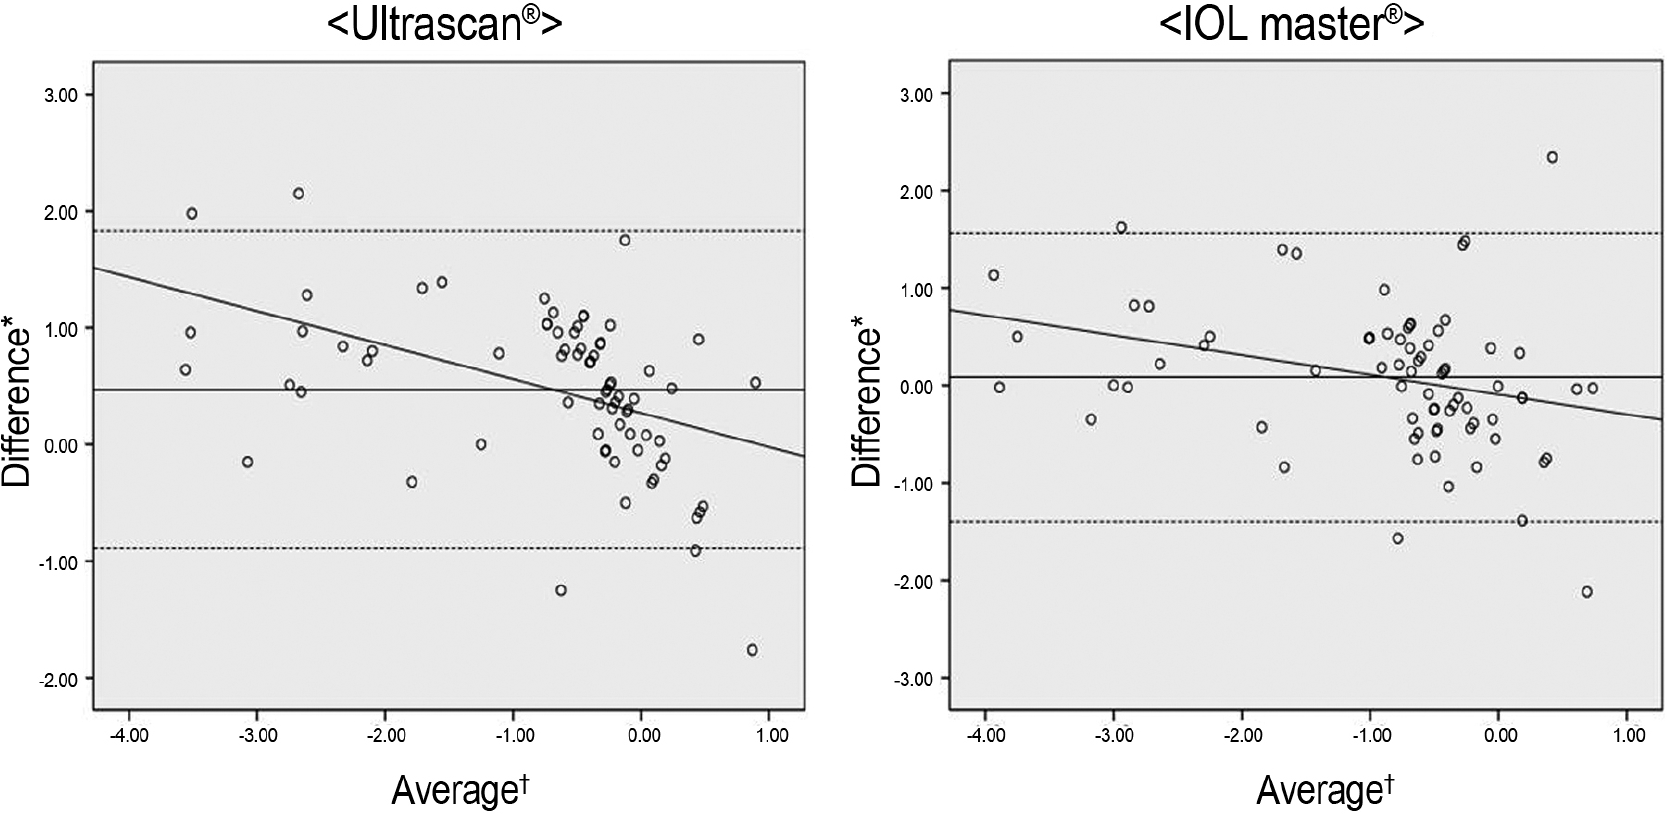
 | Figure 2.Bland-Altman analysis of postoperative and predictive refraction. IOL = intraocular lens. * Average between predictive and postoperative refraction; † Predictive refraction minus postoperative refraction. |
Table 1.
Demographics of the patients
| Value | |
|---|---|
| Number of eyes | 74 |
| Sex (M/F) | 32:42 |
| Age (years) | 62.1 ± 11.00 |
| Follow-up (months) | 10.8 ± 3.4 |
Table 2.
Axial length and keratometry between two groups
| Ultrascan® | IOL master® | p-value | |
|---|---|---|---|
| Axial length (mm) | 23.56 ± 0.15 | 23.85 ± 0.15 | p < 0.001 |
| Keratometry (D) | 44.05 ± 1.33 | 44.03 ± 1.35 | p = 0.33 |
Table 3.
Predictive and achieved refraction in all cases (n = 74)
Table 4.
Predictive and achieved refraction in cases with vitreous hemorrhage (n = 9)


 PDF
PDF ePub
ePub Citation
 Print
Print


 XML Download