

 PDF
PDF ePub
ePub Citation
 Print
Print


Abstract
Purpose
To evaluate the choroidal thickness in patients with primary open-angle glaucoma (POAG) and normal tension glauco-ma (NTG) using spectral-domain optical coherence tomography (SD-OCT), and to explore the relationship between the choroi-dal thickness and glaucoma.
Methods
A retrospective analysis was performed on patients who had been diagnosed with POAG or NTG at Ewha Womans University, Mokdong Hospital. SD-OCT scans were obtained to estimate retinal nerve fiber layer (RNFL) thickness, macular thickness, and subfoveal and peripapillary choroidal thickness in groups of POAG patients, NTG patients, and normal controls.
Results
A total of 21 patients with POAG, 53 patients with NTG, and 42 normal subjects were enrolled in this study. RNFL thick-ness and macular thickness were significantly thinner in the POAG and NTG groups compared to the normal subjects. In contrast, there were no significant differences in subfoveal and peripapillary choroidal thickness among the 3 groups. There was no significant correlations between the peripapillary choroidal thickness and retinal nerve fiber layer thickness.
References
1. Kim CS, Seong GJ, Lee NH, Song KC. Prevalence of primary open-angle glaucoma in central South Korea the Namilstudy. Ophthalmology. 2011; 118:1024–30.
2. Cioffi GA, Wang L, Fortune B, et al. Chronic ischemia induces re-gional axonal damage in experimental primate optic neuropathy. Arch Ophthalmol. 2004; 122:1517–25.
3. Duijm HF, van den Berg TJ, Greve EL. Choroidal haemodynamics in glaucoma. Br J Ophthalmol. 1997; 81:735–42.

4. Fuchsjäger-Mayrl G, Wally B, Georgopoulos M, et al. Ocular blood flow and systemic blood pressure in patients with primary open-angle glaucoma and ocular hypertension. Invest Ophthalmol Vis Sci. 2004; 45:834–9.
5. Hayreh SS. Blood supply of the optic nerve head and its role in op-tic atrophy, glaucoma, and oedema of the optic disc. Br J Ophthalmol. 1969; 53:721–48.
6. Spaide RF, Koizumi H, Pozzoni MC. Enhanced depth imaging spectral-domain optical coherence tomography. Am J Ophthalmol. 2008; 146:496–500.
7. Ehrlich JR, Peterson J, Parlitsis G, et al. Peripapillary choroidal thickness in glaucoma measured with optical coherence tomography. Exp Eye Res. 2011; 92:189–94.
8. Flammer J, Orgül S, Costa VP, et al. The impact of ocular blood flow in glaucoma. Prog Retin Eye Res. 2002; 21:359–93.
9. Spraul CW, Lang GE, Lang GK, Grossniklaus HE. Morphometric changes of the chorio capillaris and the choroidal vasculature in eyes with advanced glaucomatous changes. Vision Res. 2002; 42:923–32.
10. Yin ZQ, Vaegan , Millar TJ, et al. Widespread choroidal insufficiency in primary open-angle glaucoma. J Glaucoma. 1997; 6:23–32.
11. Cristini G, Cennamo G, Daponte P. Choroidal thickness in primary glaucoma. Ophthalmologica. 1991; 202:81–5.
12. Drexler W, Morgner U, Ghanta RK, et al. Ultrahigh-resolution ophthalmic optical coherence tomography. Nat Med. 2001; 7:502–7.
13. Mwanza JC, Hochberg JT, Banitt MR, et al. Lack of association be-tween glaucoma and macular choroidal thickness measured with enhanced depth-imaging optical coherence tomography. Invest Ophthalmol Vis Sci. 2011; 52:3430–5.
14. Maul EA, Friedman DS, Chang DS, et al. Choroidal thickness measured by spectral domain optical coherence tomography: fac-tors affecting thickness in glaucoma patients. Ophthalmology. 2011; 118:1571–9.
15. Usui S, Ikuno Y, Miki A, et al. Evaluation of the choroidal thick-ness using high penetration optical coherence tomography with long wavelength in highly myopic normal-tension glaucoma. Am J Ophthalmol. 2012; 153:10–6.e1.
16. Hirooka K, Tenkumo K, Fujiwara A, et al. Evaluation of peripapil-lary choroidal thickness in patients with normal-tension glaucoma. BMC Ophthalmol. 2012; 12:29.
17. Sogawa K, Nagaoka T, Takahashi A, et al. Relationship between choroidal thickness and choroidal circulation in healthy young subjects. Am J Ophthalmol. 2012; 153:1129–32.e1.
18. Fujiwara A, Shiragami C, Shirakata Y, et al. Enhanced depth imaging spectral domain optical coherence tomography of subfoveal choroidal thickness in normal Japanese eyes. Jpn J Ophthalmol. 2012; 56:230–5.
19. Ho J, Branchini L, Regatieri C, et al. Analysis of normal peripapil-lary choroidal thickness via spectral domain optical coherence tomography. Ophthalmology. 2011; 118:2001–7.
20. Manjunath V, Taha M, Fujimoto JG, Duker JS. Choroidal thickness in normal eyes measured using Cirrus HD optical coherence tomography. Am J Ophthalmol. 2010; 150:325–9.e1.
21. Suh W, Cho HK, Kee C. Evaluation of peripapillary choroidal thickness in unilateral normal-tension glaucoma. Jpn J Ophthalmol. 2014; 58:62–7.
22. Kim JM, Jeoung JW, Bitrian E, et al. Comparison of clinical char-acteristics between Korean and Western normal-tension glaucoma patients. Am J Ophthalmol. 2013; 155:852–7.
23. Mwanza JC, Sayyad FE, Budenz DL. Choroidal thickness in uni-lateral advanced glaucoma. Invest Ophthalmol Vis Sci. 2012; 53:6695–701.
24. Rhew JY, Kim YT, Choi KR. Measurement of subfoveal choroidal thickness in normal-tension glaucoma in Korean patients. J Glaucoma. 2014; 23:46–9.
25. Schuman JS. Spectral domain optical coherence tomography for glaucoma (an AOS thesis). Trans Am Ophthalmol Soc. 2008; 106:426–58.
26. Chung HJ, Park CK. Factors determining the peripapillary retinal nerve fiber distribution. J Glaucoma. 2013; Aug 21. [Epub ahead of print].
27. Kim NR, Hong S, Kim JH, et al. Comparison of macular ganglion cell complex thickness by Fourier-domain OCT in normal tension glaucoma and primary open-angle glaucoma. J Glaucoma. 2013; 22:133–9.
28. Curcio CA, Allen KA. Topography of ganglion cells in human retina. J Comp Neurol. 1990; 300:5–25.
29. Zeimer R, Asrani S, Zou S, et al. Quantitative detection of glau-comatous damage at the posterior pole by retinal thickness mapping. A pilot study. Ophthalmology. 1998; 105:224–31.
30. Leung CK, Chan WM, Yung WH, et al. Comparison of macular and peripapillary measurements for the detection of glaucoma: an optical coherence tomography study. Ophthalmology. 2005; 112:391–400.
Figure 1.
Images from spectral-domain optical coherence tomography (SD-OCT) with enhanced-depth imaging (EDI). (A) Image from subfoveal SD-OCT scan. White line: line of measurements of the subfoveal choroidal thickness. (B) Image from 360-degree peripapillary SD-OCT scan. Examples of image depicting choroidal thickness and demonstrating manual delineation of choroidal vasculature lying between the outer border of the retinal pigment epithelium and the posterior choroidal vessels (white arrow with white dotted line, 0°: temporal, 45°: superotemporal, 90°: superior, 135°: superonasal, 180°: nasal, 225°: inferonasal, 270°: in-ferior, 315°: inferotemporal).
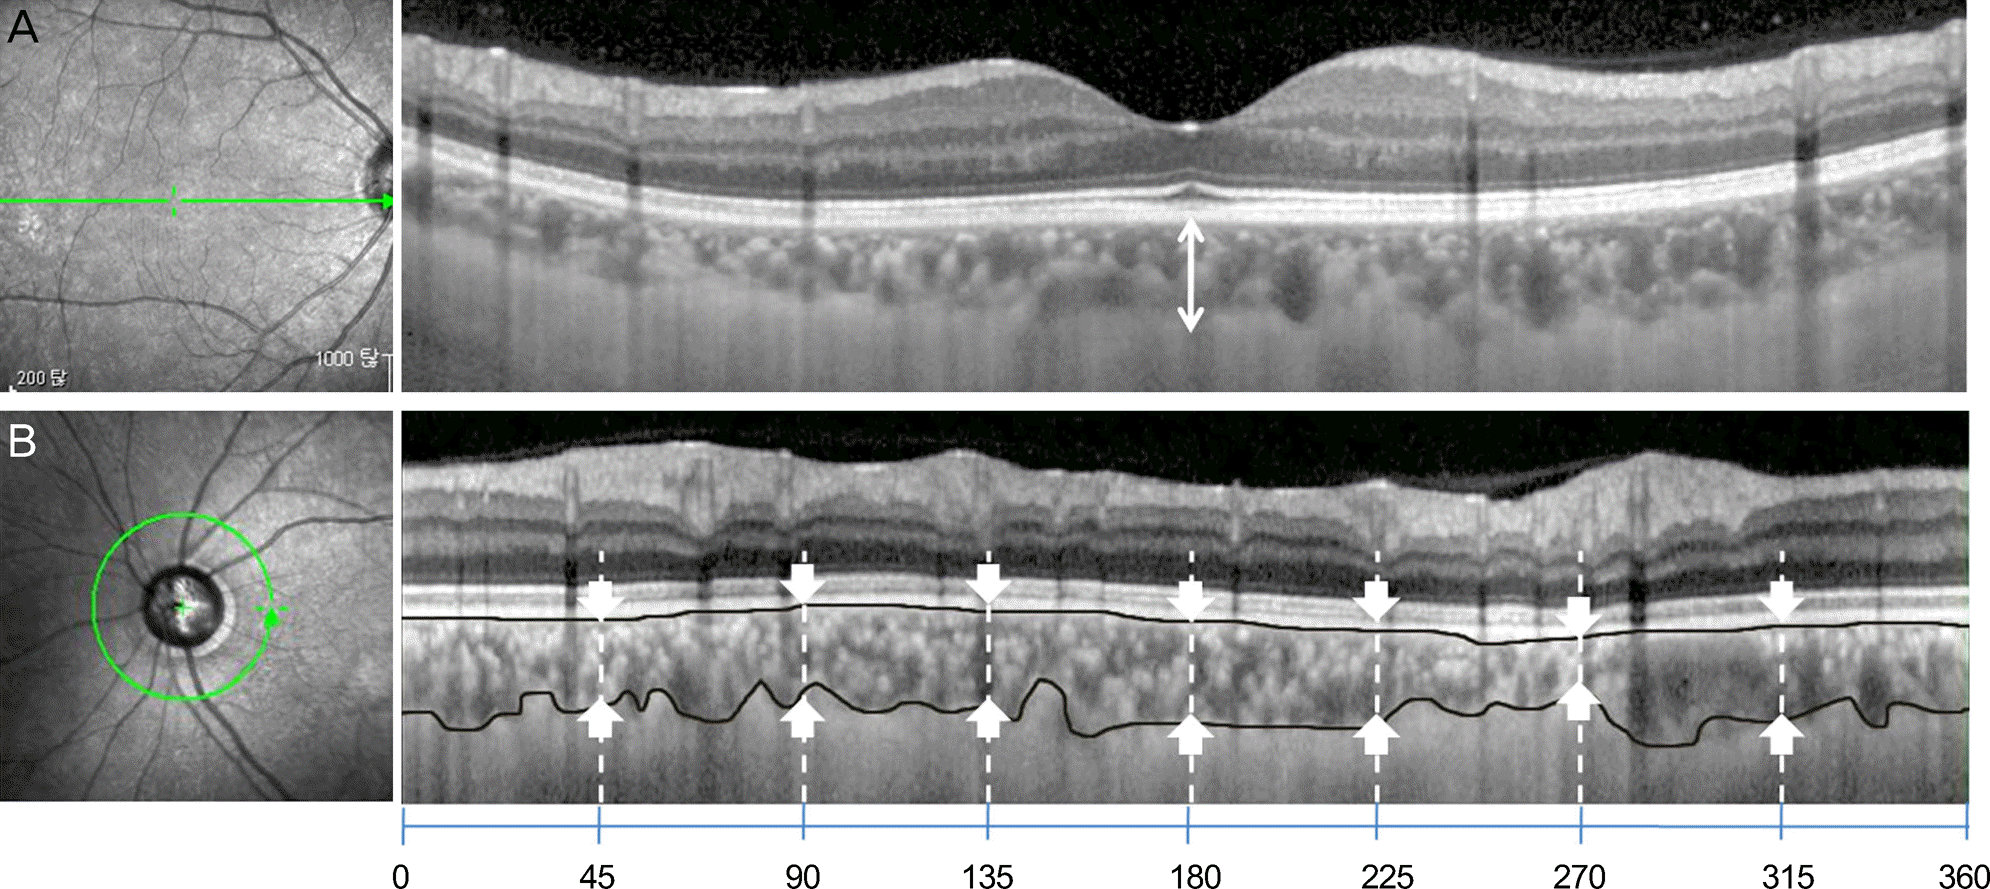
Figure 2.
Graph of choroidal thickness in nor-mal subjects and NTG, POAG patients. Subfoveal and peripapillary choroidal thickness did not change significantly between normal subjects and NTG, POAG patients. NTG = normal tension glaucoma; POAG = primary open angle glaucoma.
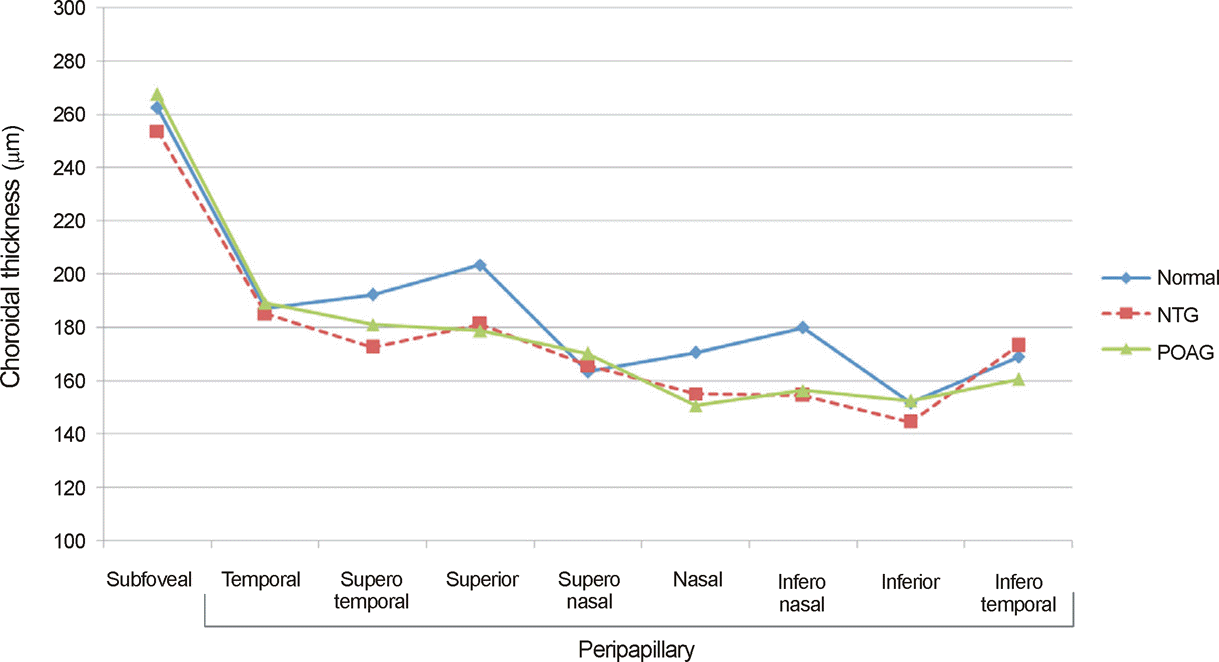
Table 1.
Dermographic characteristics of groups
|
Normal (n = 42) |
NTG (n = 53) |
POAG (n = 21) |
p-value† | p-value‡ | |||
|---|---|---|---|---|---|---|---|
| mean ± SD | mean ± SD | p-value* | mean ± SD | p-value* | |||
| Age (years) | 49.13 ± 17.09 | 52.75 ± 16.60 | 0.919 | 53.98 ± 11.23 | 0.892 | 0.865 | 0.794 |
| Sex (M:F) | 25:17 | 31:22 | 0.998 | 12:9 | 0.900 | 0.987 | 0.853 |
| (percent of female) | (40.5%) | (41.5%) | (42.9%) | ||||
| SE (diopter) | -1.83 ± 3.09 | -2.31 ± 4.04 | 0.570 | -2.15 ± 2.71 | 0.634 | 0.621 | 0.461 |
| AL (mm) | 24.70 ± 1.22 | 25.11 ± 1.43 | 0.744 | 24.93 ± 1.52 | 0.966 | 0.948 | 0.302 |
| MD (dB) | 1.16 ± 1.03 | -2.21 ± 1.95 | <0.001 | -1.97 ± 1.24 | <0.001 | 0.375 | <0.001 |
| PSD (dB) | 1.37 ± 1.10 | 3.31 ± 1.18 | <0.001 | 2.99 ± 1.63 | 0.001 | 0.284 | <0.001 |
NTG = normal tension glaucoma; POAG = primary open angle glaucoma; SD = standard deviation; SE = spherical equivalent; AL= axial length; MD = visual field mean deviation; PSD = pattern standard deviation.
Table 2.
Comparison of RNFL thickness in groups
| Location |
Normal (n = 42) |
NTG (n = 53) |
POAG (n = 21) |
p-value† | p-value‡ | ||
|---|---|---|---|---|---|---|---|
| mean ± SD (μm) | mean ± SD (μm) | p-value* | mean ± SD (μm) | p-value* | |||
| T sector | 99.63 ± 28.08 | 78.08 ± 30.80 | <0.001 | 83.01 ± 29.46 | <0.001 | 0.366 | <0.001 |
| ST sector | 108.67 ± 22.47 | 85.12 ± 24.49 | 0.001 | 87.15 ± 17.63 | 0.001 | 0.732 | <0.001 |
| SN sector | 115.28 ± 18.15 | 82.83 ± 29.95 | <0.001 | 89.99 ± 18.06 | <0.001 | 0.277 | <0.001 |
| N sector | 93.46 ± 15.36 | 68.75 ± 12.93 | <0.001 | 69.29 ± 21.66 | <0.001 | 0.959 | <0.001 |
| IN sector | 112.19 ± 25.65 | 89.34 ± 20.09 | <0.001 | 90.70 ± 19.85 | <0.001 | 0.981 | <0.001 |
| IT sector | 131.88 ± 23.17 | 91.58 ± 32.57 | <0.001 | 93.95 ± 23.74 | <0.001 | 0.904 | <0.001 |
| Average | 110.19 ± 22.15 | 82.62 ± 25.14 | <0.001 | 85.68 ± 21.73 | <0.001 | 0.457 | <0.001 |
RNFL = retinal nerve fiber layer; NTG = normal tension glaucoma; POAG = primary open angle glaucoma; SD = standard deviation; T = temporal; ST = superotemporal; SN = superonasal; N = nasal; IN = inferonasal; IT = inferotemporal.
Table 3.
Comparison of macular thickness in groups
| Location |
Normal (n = 42) |
NTG (n = 53) |
POAG (n = 21) |
p-value† | p-value‡ | ||
|---|---|---|---|---|---|---|---|
| mean ± SD (μm) | mean ± SD (μm) | p-value* | mean ± SD (μm) | p-value* | |||
| Fovea centralis | 266.58 ± 20.10 | 263.67 ± 18.69 | 0.767 | 268.15 ± 17.99 | 0.940 | 0.507 | 0.735 |
| The inner sector of parafovea | |||||||
| Temporal | 330.75 ± 10.87 | 317.42 ± 16.50 | 0.020 | 319.44 ± 15.54 | 0.028 | 0.899 | 0.001 |
| Superior | 343.88 ± 15.41 | 329.75 ± 17.29 | 0.017 | 328.37 ± 13.38 | 0.020 | 0.801 | <0.001 |
| Nasal | 346.04 ± 14.15 | 333.04 ± 17.53 | 0.019 | 340.59 ± 17.11 | 0.025 | 0.893 | <0.001 |
| Inferior | 336.67 ± 20.61 | 325.13 ± 16.99 | 0.022 | 322.96 ± 15.47 | 0.021 | 0.988 | 0.001 |
| Average | 339.34 ± 15.26 | 326.34 ± 17.08 | 0.021 | 327.09 ± 15.36 | 0.025 | 0.984 | <0.001 |
| The outer sector of parafovea | |||||||
| Temporal | 299.28 ± 19.01 | 282.93 ± 16.87 | 0.011 | 283.31 ± 11.45 | 0.015 | 0.774 | <0.001 |
| Superior | 307.63 ± 12.23 | 299.77 ± 17.68 | 0.035 | 296.62 ± 12.95 | 0.029 | 0.521 | 0.001 |
| Nasal | 321.45 ± 11.34 | 309.86 ± 14.16 | 0.010 | 310.23 ± 18.00 | 0.011 | 0.680 | <0.001 |
| Inferior | 301.31 ± 18.42 | 289.21 ± 13.04 | 0.008 | 288.00 ± 11.34 | 0.010 | 0.789 | <0.001 |
| Average | 307.42 ± 15.25 | 295.44 ± 15.44 | 0.024 | 294.54 ± 13.44 | 0.021 | 0.896 | 0.001 |
Table 4.
Comparison of choroidal thickness in groups
| Location |
Normal (n = 42) |
NTG (n = 53) |
POAG (n = 21) |
p-value† | p-value‡ | ||
|---|---|---|---|---|---|---|---|
| mean ± SD (μm) | mean ± SD (μm) | p-value* | mean ± SD (μm) | p-value* | |||
| Subfoveal CT | 262.58 ± 49.53 | 253.79 ± 62.66 | 0.365 | 267.52 ± 60.31 | 0.451 | 0.143 | 0.584 |
| Peripapillary CT | |||||||
| T | 187.04 ± 21.03 | 185.16 ± 65.42 | 0.892 | 189.12 ± 41.61 | 0.803 | 0.738 | 0.831 |
| ST | 192.37 ± 46.25 | 172.63 ± 71.64 | 0.080 | 181.04 ± 59.56 | 0.119 | 0.351 | 0.609 |
| S | 203.54 ± 79.28 | 181.28 ± 69.61 | 0.073 | 178.79 ± 73.33 | 0.061 | 0.829 | 0.112 |
| SN | 163.38 ± 71.28 | 165.75 ± 69.70 | 0.904 | 170.15 ± 68.88 | 0.556 | 0.408 | 0.701 |
| N | 170.58 ± 51.36 | 155.00 ± 56.77 | 0.185 | 150.62 ± 55.41 | 0.080 | 0.777 | 0.126 |
| IN | 179.92 ± 60.46 | 154.42 ± 99.21 | 0.069 | 156.34 ± 67.89 | 0.072 | 0.818 | 0.141 |
| I | 151.63 ± 56.02 | 144.37 ± 72.77 | 0.387 | 152.40 ± 78.75 | 0.965 | 0.240 | 0.740 |
| IT | 168.81 ± 58.61 | 173.17 ± 66.54 | 0.594 | 160.46 ± 59.19 | 0.462 | 0.387 | 0.606 |
| Average | 177.16 ± 55.54 | 166.47 ± 71.46 | 0.213 | 167.37 ± 63.08 | 0.278 | 0.912 | 0.593 |
NTG = normal tension glaucoma; POAG = primary open angle glaucoma; SD = standard deviation; CT = choroidal thickness; T = temporal; ST = superotemporal; S = superior; SN = superonasal; N = nasal; IN = inferonasal; I = inferior; IT = inferotemporal.
Table 5.
Pearson's correlation coefficient between retinal nerve fiber layer thickness and choroidal thickness by peripapillary location in open angle glaucoma patients
| Location | Correlation coefficient (r) | p-value |
|---|---|---|
| Temporal | 0.024 | 0.226 |
| Superotemporal | 0.071 | 0.509 |
| Superonasal | -0.103 | 0.354 |
| Nasal | -0.156 | 0.073 |
| Inferonasal | 0.261 | 0.635 |
| Inferotemporal | -0.037 | 0.148 |
 XML Download