Abstract
Purpose
To evaluate the biometric conditions causing increased disparity in the calculation of intraocular lens (IOL) power between the Hoffer Q and SRK/T formulas.
Methods
A prospective comparative study was conducted on 365 uneventful, cataract surgeries performed at a tertiary care center by one surgeon. The IOL power was calculated using both the Hoffer Q and SRK/T formulas with A-scan biometry. For a selected IOL power, the expected disparity between the 2 formulas (EDF) was measured and the EDF value was used to categorize the cases. The resultant error associated with each formula was determined at postoperative 6 weeks. KAL was defined as the product of mean corneal power (K) and axial length (AL). Postoperative errors of both formulas were calculated and their association with preoperative biometry measurements analyzed.
Results
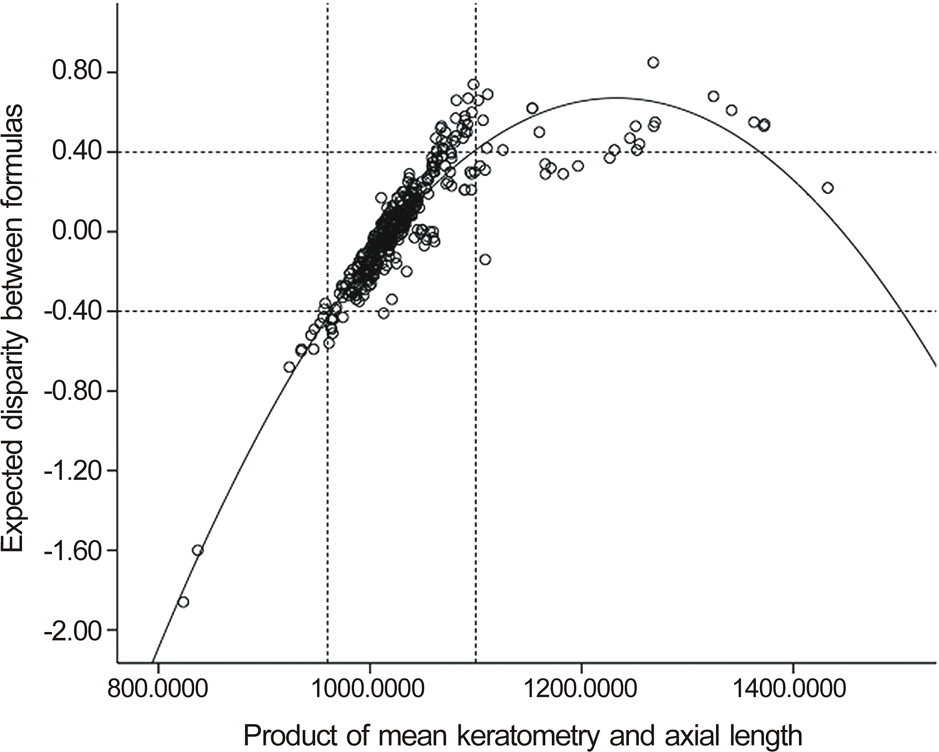
In 17.8% of the cases, the EDF was larger than 0.4 D, possibly leading to different IOL diopter recommendations. The EDF value and the product of corneal curvature and axial length were significantly correlated (R2 = 0.855, p < 0.001). Multiple regression analysis of causative preoperative biometric factors on the postoperative formula errors showed that astigmatism, anterior chamber depth (ACD), and lens thickness (LT) were significantly associated with Hoffer Q error and SRK/T error.
Conclusions
Overall, both formulas performed very well when recommending the correct IOL power. The cause of disparity between the predicted refraction for the 2 formulas was more associated with KAL than K or AL alone. Astigmatism, ACD, and LT were the causative factors for the postoperative errors in both formulas.
Go to : 
References
1. Lee AC, Qazi MA, Pepose JS.Biometry and intraocular lens power calculation. Curr Opin Ophthalmol. 2008; 19:13–7.

2. Eibschitz-Tsimhoni M, Archer SM, Del Monte MA.Intraocular lens power calculation in children. Surv Ophthalmol. 2007; 52:474–82.

4. Aristodemou P, Knox Cartwright NE, Sparrow JM, Johnston RL. Formula choice: Hoffer Q, Holladay 1, or SRK/T and refractive outcomes in 8108 eyes after cataract surgery with biometry by par-tial coherence interferometry. J Cataract Refract Surg. 2011; 37:63–71.

5. Gavin EA, Hammond CJ.Intraocular lens power calculation in short eyes. Eye (Lond). 2008; 22:935–8.

6. Narváez J, Zimmerman G, Stulting RD, Chang DH.Accuracy of intraocular lens power prediction using the Hoffer Q, Holladay 1, Holladay 2, and SRK/T formulas. J Cataract Refract Surg. 2006; 32:2050–3.

7. Eibschitz-Tsimhoni M, Tsimhoni O, Archer SM, Del Monte MA.Discrepancies between intraocular lens implant power prediction formulas in pediatric patients. Ophthalmology. 2007; 114:383–6.

8. Hoffer KJ.The Hoffer Q formula: a comparison of theoretic and re-gression formulas. J Cataract Refract Surg. 1993; 19:700–12.

9. Retzlaff JA, Sanders DR, Kraff MC.Development of the SRK/T intraocular lens implant power calculation formula. J Cataract Refract Surg. 1990; 16:333–40.

10. Seo JM, Lee JH.The usefulness of the PCL power calculation computer program. J Korean Ophthalmol Soc. 2002; 43:23–8.
11. Dooley I, Charalampidou S, Nolan J. . Estimation of effective lens position using a method independent of preoperative kera-tometry readings. J Cataract Refract Surg. 2011; 37:506–12.

12. Bang S, Edell E, Yu Q. . Accuracy of intraocular lens calcu-lations using the IOLMaster in eyes with long axial length and a comparison of various formulas. Ophthalmology. 2011; 118:503–6.

14. Fam HB, Lim KL.Improving refractive outcomes at extreme axial lengths with the IOLMaster: the optical axial length and kerato-metric transformation. Br J Ophthalmol. 2009; 93:678–83.

15. Nihalani BR, VanderVeen DK.Comparison of intraocular lens power calculation formulae in pediatric eyes. Ophthalmology. 2010; 117:1493–9.

16. Kim DY, Kim MJ, Kim JY, Tchah H.Comparison of formulas for intraocular lens power calculation installed in a partial coherence interferometer. J Korean Ophthalmol Soc. 2009; 50:523–8.

Go to : 
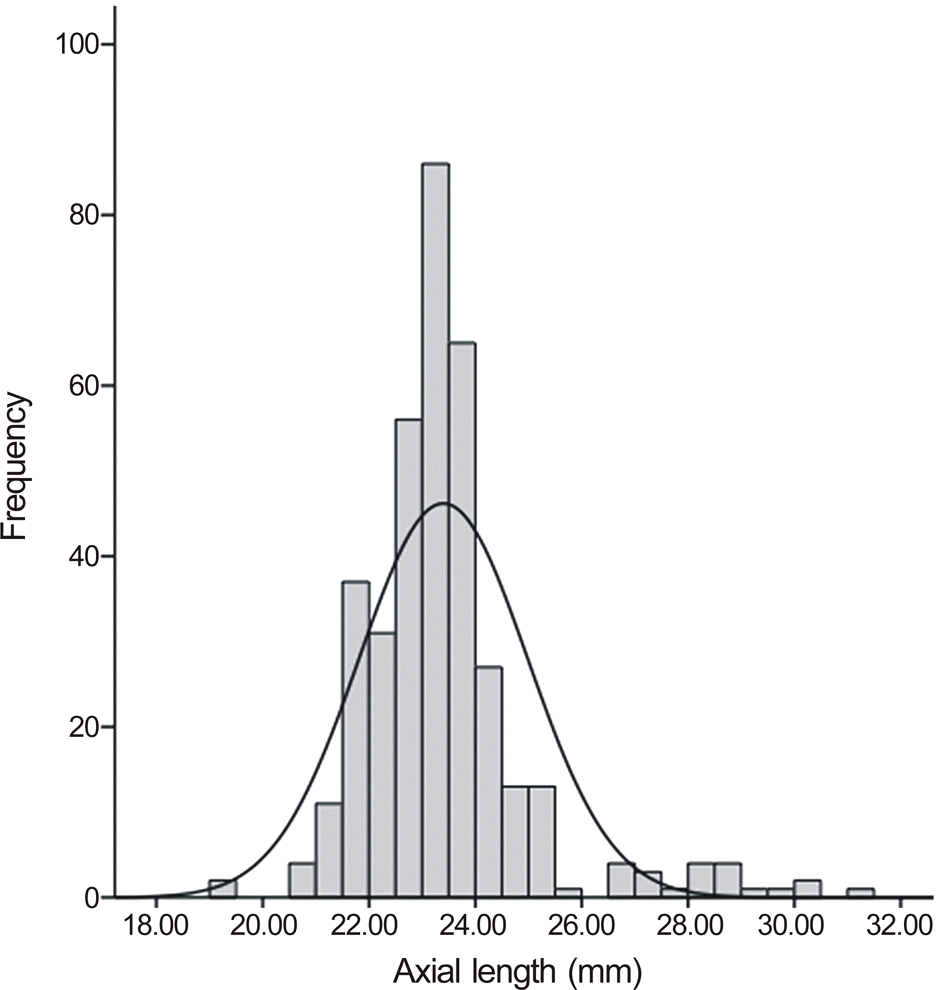
 | Figure 1.Distribution frequency was illustrated in histogram with normal distribution curve. In histogram, 37 cases (12.1%) had axial length shorter than 22 mm, and 239 cases (78.3%) ranged between 22 and 25 mm, and 29 cases (9.5%) were longer than 25 mm. |
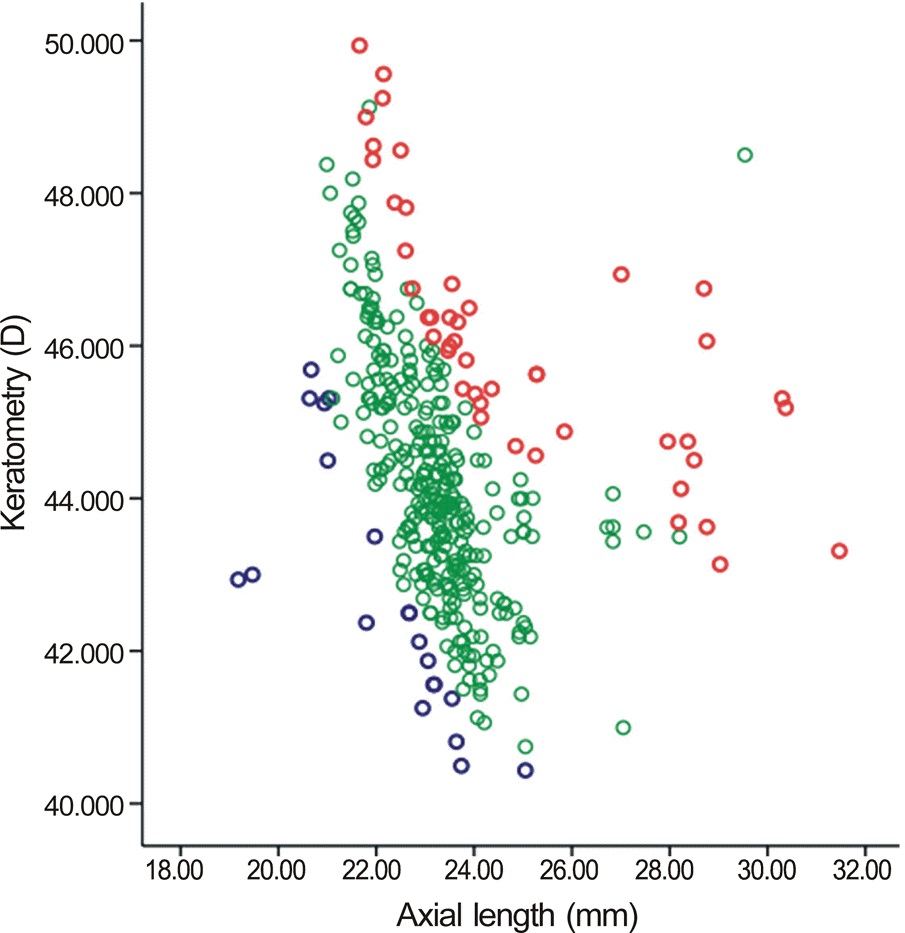
 | Figure 2.For the selected IOL power, the disparity between the 2 formulas (expected disparity between formulas, EDF) was calculated by subtracting the expected refraction value obtained using the SRK/T formula from that obtained using the Hoffer Q formula. The 365 cases were divided into 3 groups according to their EDF value (A: EDF > 0.4 D, B: -0.4 D ≤ EDF ≤ 0.4 D, C: EDF < -0.4 D). The scatterplot of the corneal curvatures and axial lengths showed clear discrimination among the EDF subgroups. EDF subgroup A (red circle), B (green circle), C (blue circle). |
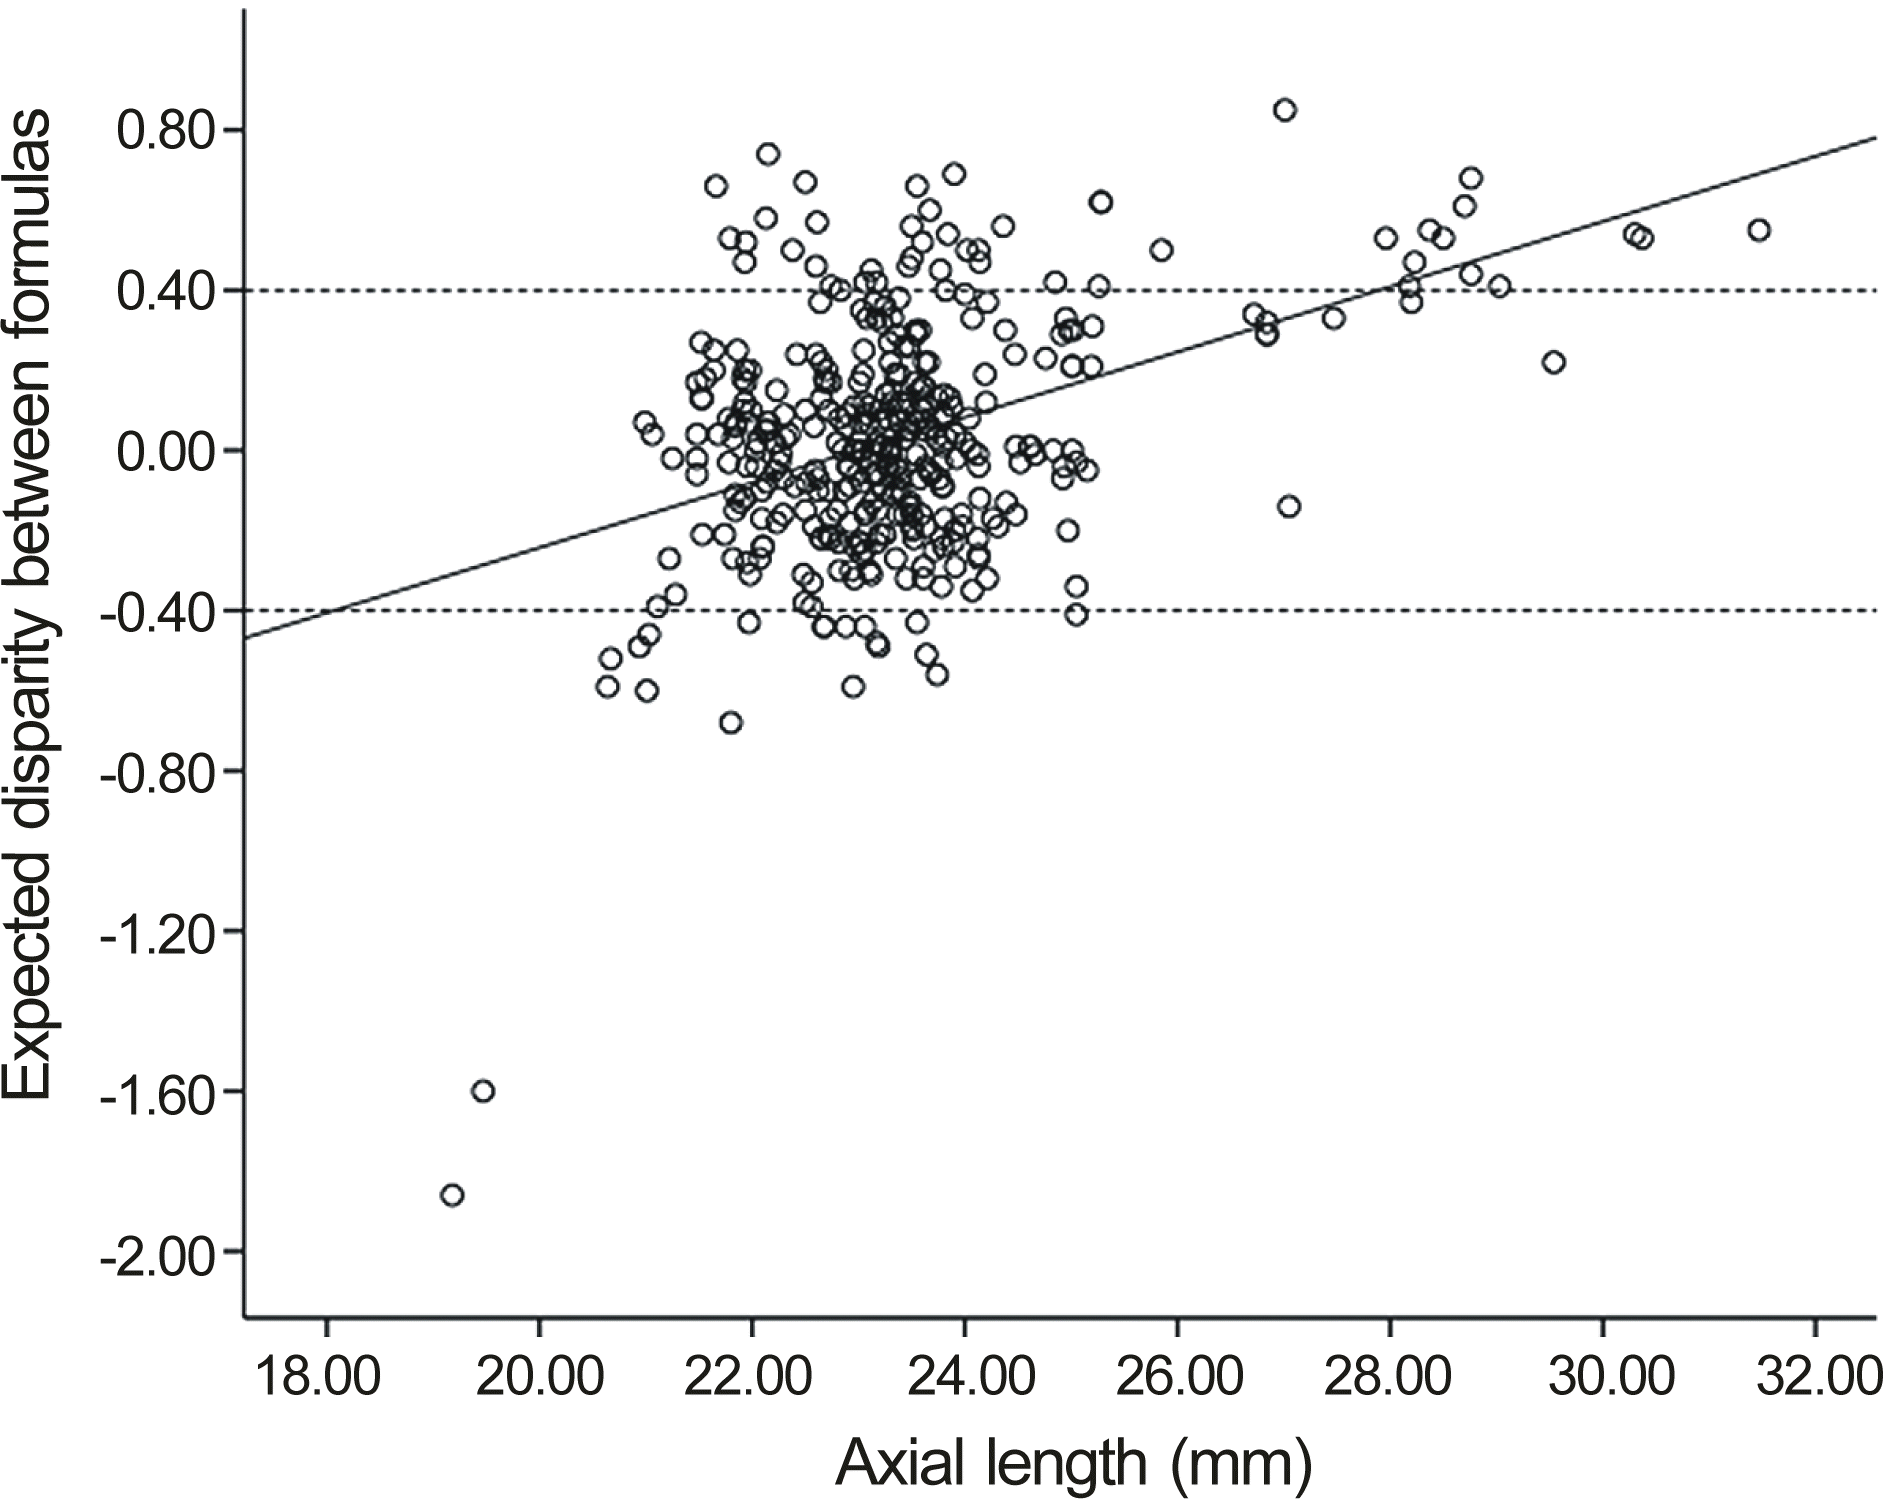
 | Figure 3.The EDF values were plotted against the axial length, and showed an R value of 0.417, by using a linear regression model (p = 0.000). The EDF values show large amplitude of variation even in middle axial length range (22-25 mm). * EDF (expected disparity between formulas) was calculated by subtracting the expected refraction value obtained using the SRK/T formula from that obtained using the Hoffer Q formula. |
 | Figure 4.The EDF* values were plotted against the products of corneal curvature and axial length, and showed an r2 value of 0.855, by using a quadratic curve estimation (p = 0.000). * EDF (expected disparity between formulas) was calculated by subtracting the expected refraction value obtained using the SRK/T formula from that obtained using the Hoffer Q formula. |
Table 1.
Characteristics of preoperative biometric data and the power of IOL distribution
Table 2.
Mean EDF* and the number of subgroups stratified by axial length
| Subgroup | A* | B† | C‡ | |||
|---|---|---|---|---|---|---|
| Axial length | EDF | (N) | EDF | (N) | EDF | (N) |
| <22 mm | -0.80 ± 0.53 | (9) | 0.00 ± 0.18 | (41) | 0.55 ± 0.08 | (4) |
| 22-25 mm | -0.48 ± 0.05 | (10) | 0.00 ± 0.18 | (242) | 0.53 ± 0.09 | (24) |
| >25 mm | -0.41 ± 0.00 | (1) | 0.17 ± 0.20 | (17) | 0.54 ± 0.11 | (17) |
| Total | -0.62 ± 0.39 | (20) | 0.00 ± 0.19 | (300) | 0.53 ± 0.10 | (45) |
Table 3.
The composition of Hoffer Q and SRK/T formula and Pearson correlation with biometric factors
| Composition | Mean ± SD | Correlation (sig) | K | AL | KAL‡ |
|---|---|---|---|---|---|
| ACDh* | 5.05 ± 0.44 | -0.048 (0.360) | 0.914 (0.000) | 0.898 (0.000) | |
| ACDt† | 5.10 ± 0.61 | 0.276 (0.000) | 0.777 (0.000) | 0.950 (0.000) | |
| ACD | 3.13 ± 0.45 | -0.037 (0.482) | 0.506 (0.000) | 0.491 (0.000) |
Table 4.
The results of multiple regression analyses of Hoffer Q and SRK/T formula error against the preoperative biometric measurements with EDF
| Adjusted R2 |
Error of Hoffer Q formula |
Error of SRK/T formula |
|---|---|---|
| 0.272 | 0.225 | |
| Significance | ||
| Mean keratometry | 0.379 | 0.332 |
| Astigmatism | 0.000* | 0.000* |
| Axial length | 0.485 | 0.494 |
| Anterior chamber depth | 0.000* | 0.000* |
| Lens thickness | 0.005* | 0.004* |
| EPL difference | 0.066 | 0.072 |
| Emmetropic power difference | 0.215 | 0.160 |
| EDF | 0.278 | 0.014* |
Table 5.
Comparison of IOL formula accuracy using MAE amount
|
1) Mean absolute error (MAE) comparison between both formulae stratified by EDF* subgroup using paired t-test |
||||
|---|---|---|---|---|
| Group | MAE of Hoffer Q | MAE of SRK-T | N | Sig. (2-tailed) |
| A* | 0.45 ± 0.31 D | 0.42 ± 0.38 D | 20 | 0.534 |
| B† | 0.29 ± 0.23 D | 0.27 ± 0.23 D | 300 | 0.149 |
|
C‡ |
0.41 ± 0.33 D |
0.42 ± 0.38 D |
45 |
0.784 |
|
2) Mean absolute error (MAE) comparison between both formulae stratified by axial length using paired t-test |
||||
|
Axial length |
MAE of Hoffer Q |
MAE of SRK-T |
N |
Sig. (2-tailed) |
| <22 mm | 0.33 ± 0.26 D | 0.35 ± 0.31 D | 54 | 0.866 |
| 22-25 mm | 0.29 ± 0.23 D | 0.27 ± 0.23 D | 276 | 0.155 |
|
>25 mm |
0.50 ± 0.36 D |
0.44 ± 0.41 D |
35 |
0.447 |
|
3) Percentage of eyes within 0.50 D, within 1.00 D or over 1.00 D of mean absolute errors (MAE) was calculated to compare the accuracy of formula |
||||
|
MAE of formula |
<0.50 D |
≤1.00 D |
>1.00 D |
|
| Hoffer Q formula | 295 (80.8%) | 358 (98.1%) | 7 (1.9%) | |
| SRK/T formula | 294 (80.5%) | 359 (98.4%) | 6 (1.6%) | |


 PDF
PDF ePub
ePub Citation
 Print
Print


 XML Download