

 PDF
PDF ePub
ePub Citation
 Print
Print


Abstract
Purpose
To evaluate changes in subfoveal choroidal thickness in patients with malignant hypertension.
Methods
A total of 12 eyes of six malignant hypertension patients were included in the present study. Intraocular pressure, blood pressure (systolic and diastolic), and choroidal thickness were measured before and after blood pressure control. Choroidal thickness was measured using enhanced depth imaging optical coherence tomography (EDI-OCT). The changes in choroidal extravascular density of the EDI-OCT image after blood pressure control were evaluated by comparing brightness val-ues obtained with Adobe Photoshop software.
Results
The subfoveal choroidal thickness (SFCT) of malignant hypertension patients was 412.63 ± 66.55 μm (mean ± SD), which was thicker than in normal patients. After blood pressure control, SFCT decreased significantly to 356.96 ± 59.08 μm (mean ± SD) (p = 0.002). The choroidal extravascular density of the EDI-OCT image decreased after blood pressure control (p = 0.002), and the mean change was 17.21 ± 7.56.
Go to : 
References
1. Richard JG. Current Therapy in Nephrology and Hypertension. The CV Mosby Company. 1984-1985; 324–33.
2. Hayreh SS, Servais GE, Virdi PS, et al. Fundus lesions in malig-nant hypertension: III. Arterial blood pressure, biochemical, and fundus changes. Ophthalmology. 1986; 93:45–59.

3. Hayreh SS, Servais GE, Virdi PS. Fundus lesions in malignant hy-pertension: VI. Hypertensive choroidopathy. Ophthalmology. 1986; 93:1383–400.
4. Hayreh SS, Servais GE, Virdi PS. Fundus lesions in malignant hy-pertension: V. Hypertensive optic neuropathy. Ophthalmology. 1986; 93:74–87.
5. De Venecia G, Jampol LM. The eye in accelerated hypertension: II. Localized serous detachments of the retina in patients. Arch Ophthalmol. 1984; 102:68–73.
6. Levin LA, Kaufman PL. Adler's physiology of the EYE: Clinical Application. 11th ed.New York: Saunders/Elsevier;2011. p. 254–255.
7. Spaide RF, Koizumi H, Pozonni MC. Enhanced depth imaging spectral-domain optical coherence tomography. Am J Ophthalmol. 2008; 146:496–500.
8. Jung JW, Chin HS, Lee DH, et al. Changes in subfoveal choroidal thickness and choroidal extravascular density by spectral domain optical coherence tomography after haemodialysis: a pilot study. Br J Ophthalmol. 2014; 98:207–12.
9. Tanabe H, Ito Y, Iguchi Y, et al. Correlation between cross-sectional shape of choroidal veins and choroidal thickness. Jpn J Ophthalmol. 2011; 55:614–9.
10. Usui S, Ikuno Y, Akiba M, et al. Circardian changes in subfoveal choroidal thickness and the relationship with circulatory factors in healthy subjects. Invest Ophthalmol Vis Sci. 2012; 53:2300–7.
11. Tan CS, Ouyang Y, Ruiz H, Sadda SR. Diurnal variation of choroi-dal thickness in normal, healthy subjects measured by spectral do-main optical coherence tomography. Invest Ophthalmol Vis Sci. 2012; 53:261–6.
12. Wei WB, Xu L, Shao L, et al. Subfoveal choroidal thickness: the Beijing Eye Study. Ophthalmology. 2013; 120:175–80.
13. Fujiwara A, Shiragami C, Shirakata Y, et al. Enhanced depth imaging spectral-domain optical coherence tomography of subfoveal choroidal thickness in normal Japanese eyes. Jpn J Ophthalmol. 2012; 56:230–5.
14. Suto K, Iida T, Hagimura N, Kishi S. Indocyanine green angio-graphic findings of hypertensive choroidopathy. Jpn J Clin Ophthalmol. 2001; 55:146–8.
15. Chung SE, Kang SW, Kim JH, et al. Engorgement of vortex vein and polypoidal choroidal vasculopathy. Retina. 2013; 33:834–40.
16. Kuroda S, Ikuno Y, Yasuno Y, et al. Choroidal thickness in central serous chorioretinopathy. Retina. 2013; 33:302–8.
17. Pogrzebielski A, Lubaszewski W, Starzycka M, Kawecka-Jaszcz K. Fluorophotometric evaluation of blood-retinal barrier perme-ability in patients with essential hypertension. Ophthalmologica. 2004; 218:180–4.
18. Jampol LM, White S, Cunha-Vaz J. Vitreous fluorophotometry in patients with hypertension. Arch Ophthalmol. 1983; 101:888–90.
19. Murphy RP, Lam LA, Chew EY. Hypertension. In : Ryan SJ, editor. Retina. 4th ed.2:Medical Retina. Philadelphia: Elsevier Mosby;2006.
20. Hayreh SS, Servais GE, Virdi PS. Fundus lesions in malignant hypertension. IV. Focal intraretinal periarteriolar transudates. Ophthalmology. 1986; 93:60–73.
Go to :
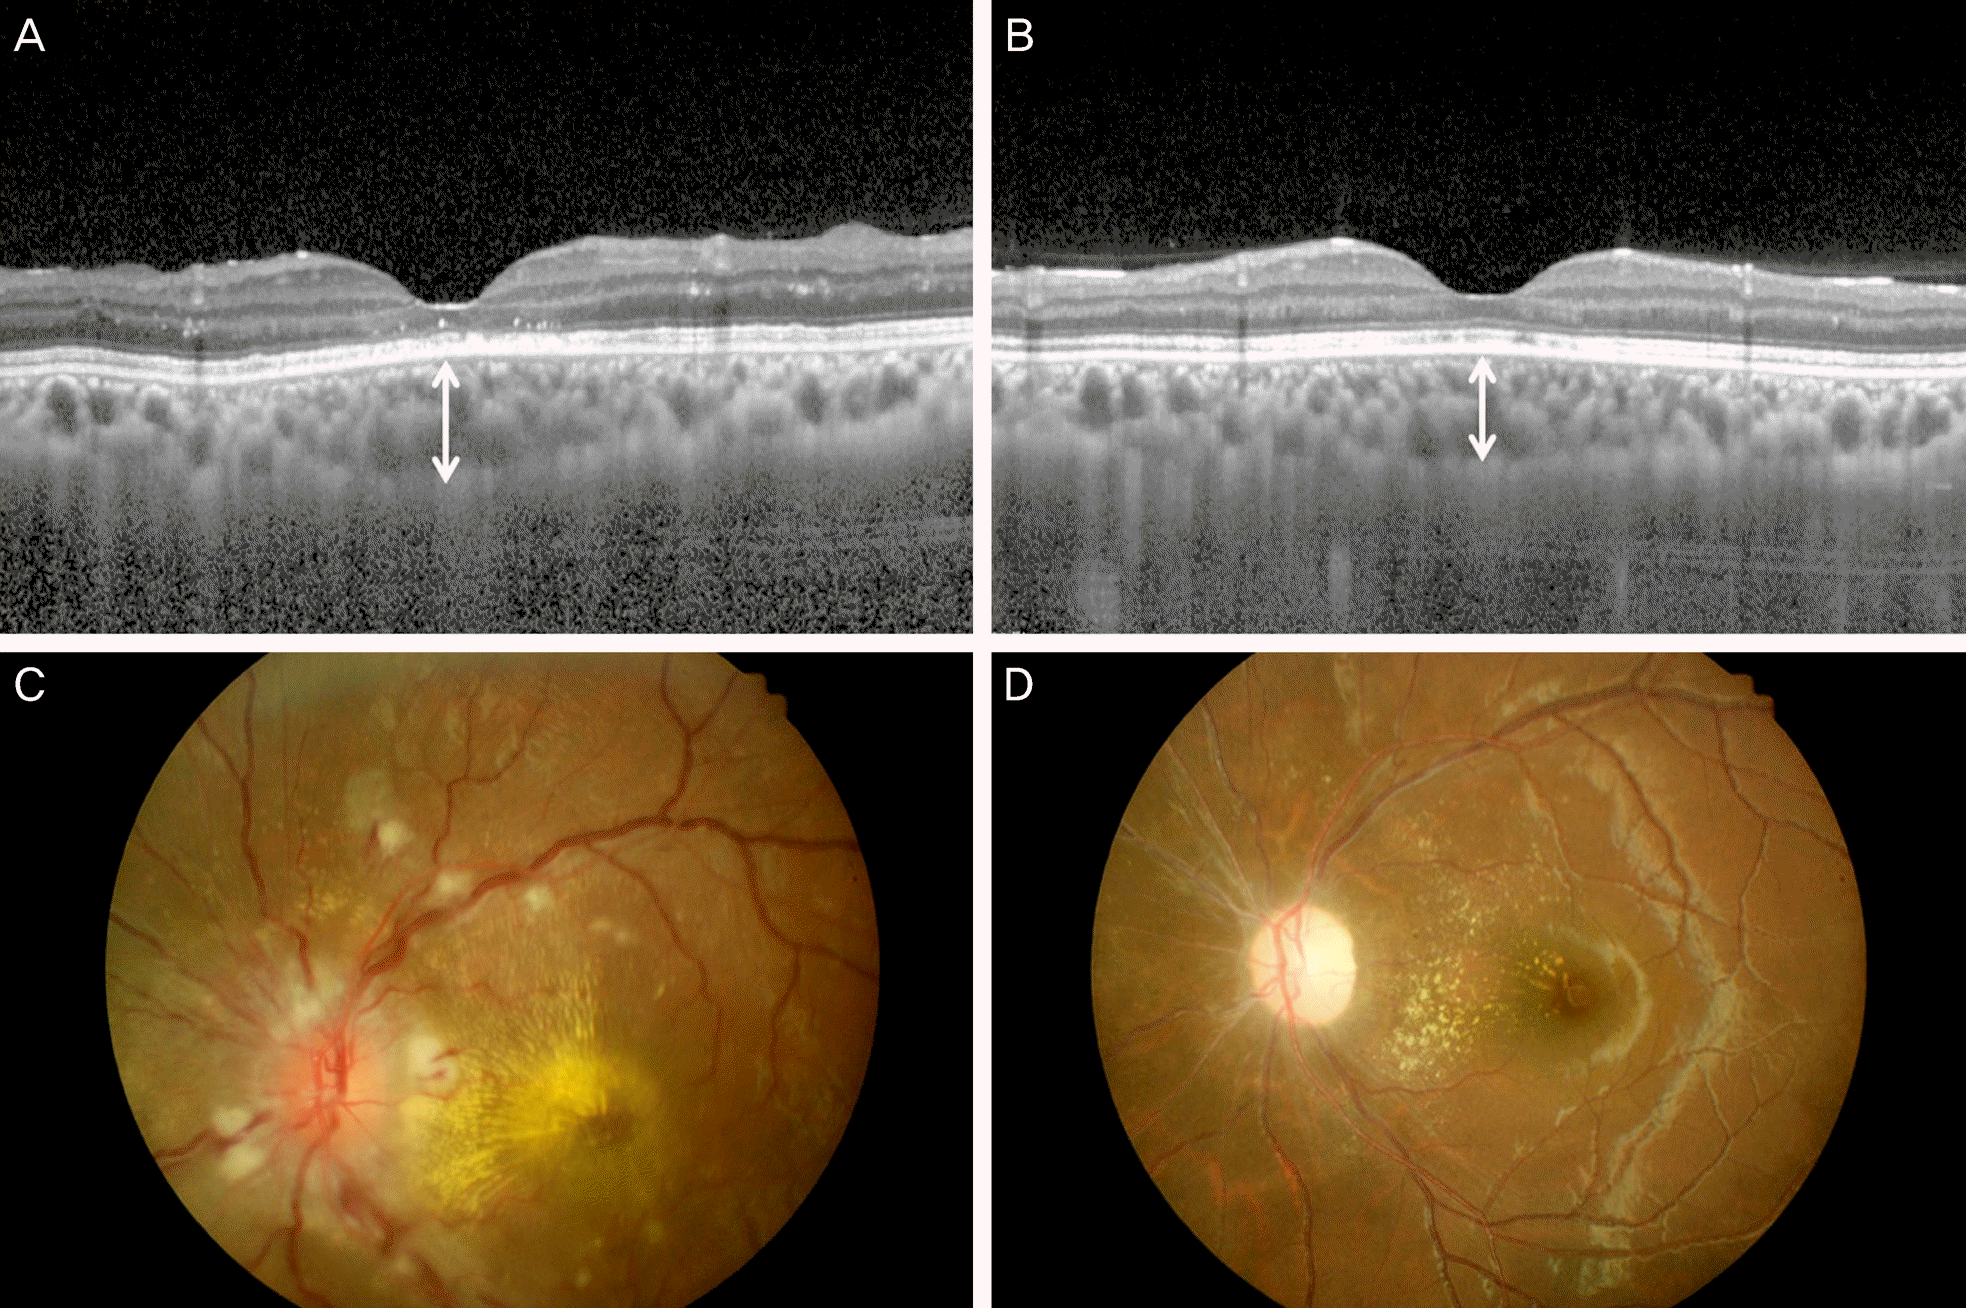 | Figure 1.Patient No 5. The right eye of the 20-year-old woman who had been diagnosed with nephrotic hypertension 2 months before. Fundus examination showed multiple cotton wool spots and hard exudates with papilledema. (C) The retinal detachment and macular edema were not seen in enhanced depth imaging optical coherence tomography (EDI-OCT). (A) However, subfoveal cho-roidal thickness (SFCT) was 442.5 μm, which is thickened. (A, white line) After blood pressure control, follow-up examinationshows spontaneous resolution of the cotton wool sopts and papilledema (D), SFCT decreased to 297.0 μm (B, white line). |
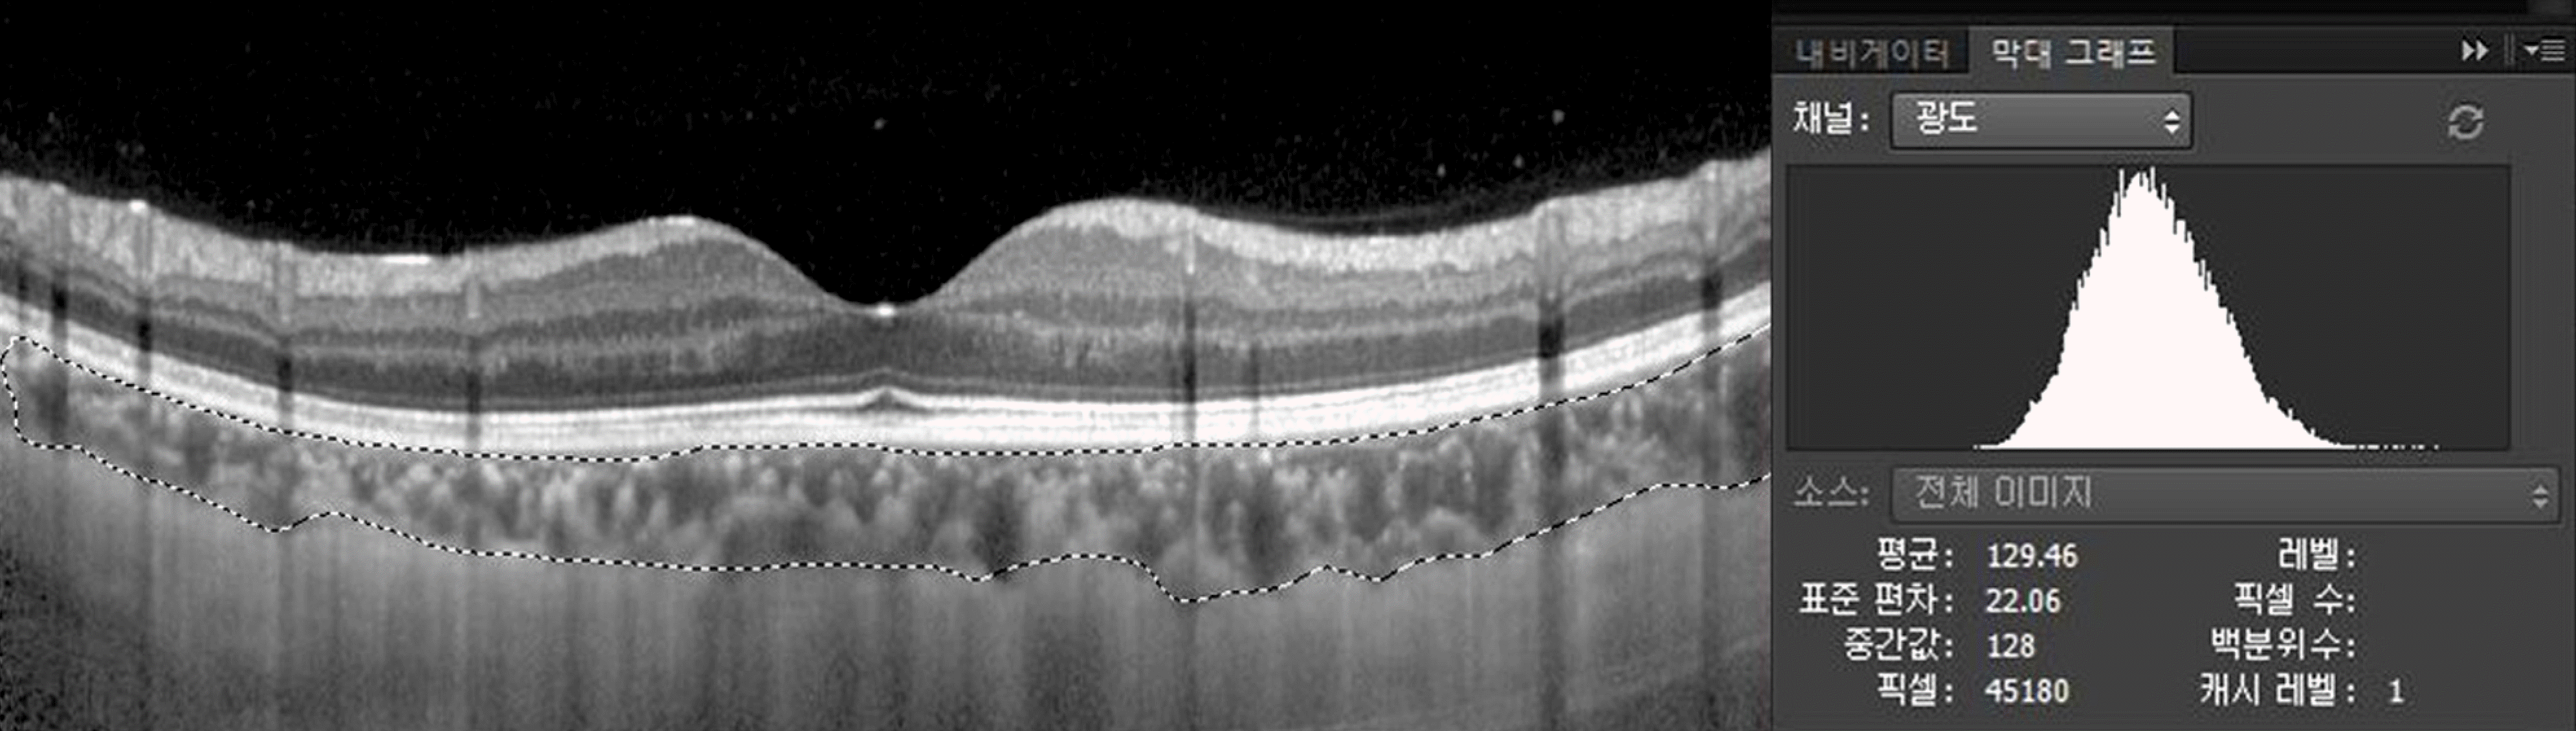 | Figure 2.The choroidal extravascular density of the enhanced depth imaging optical coherence tomography (EDI-OCT) image was evaluated by Photoshop-based image analysing software. In the histogram, each vertical line represents the number of pixels with brightness. The mean value reveals the staining intensity of the selected area, the choroidal layer. |
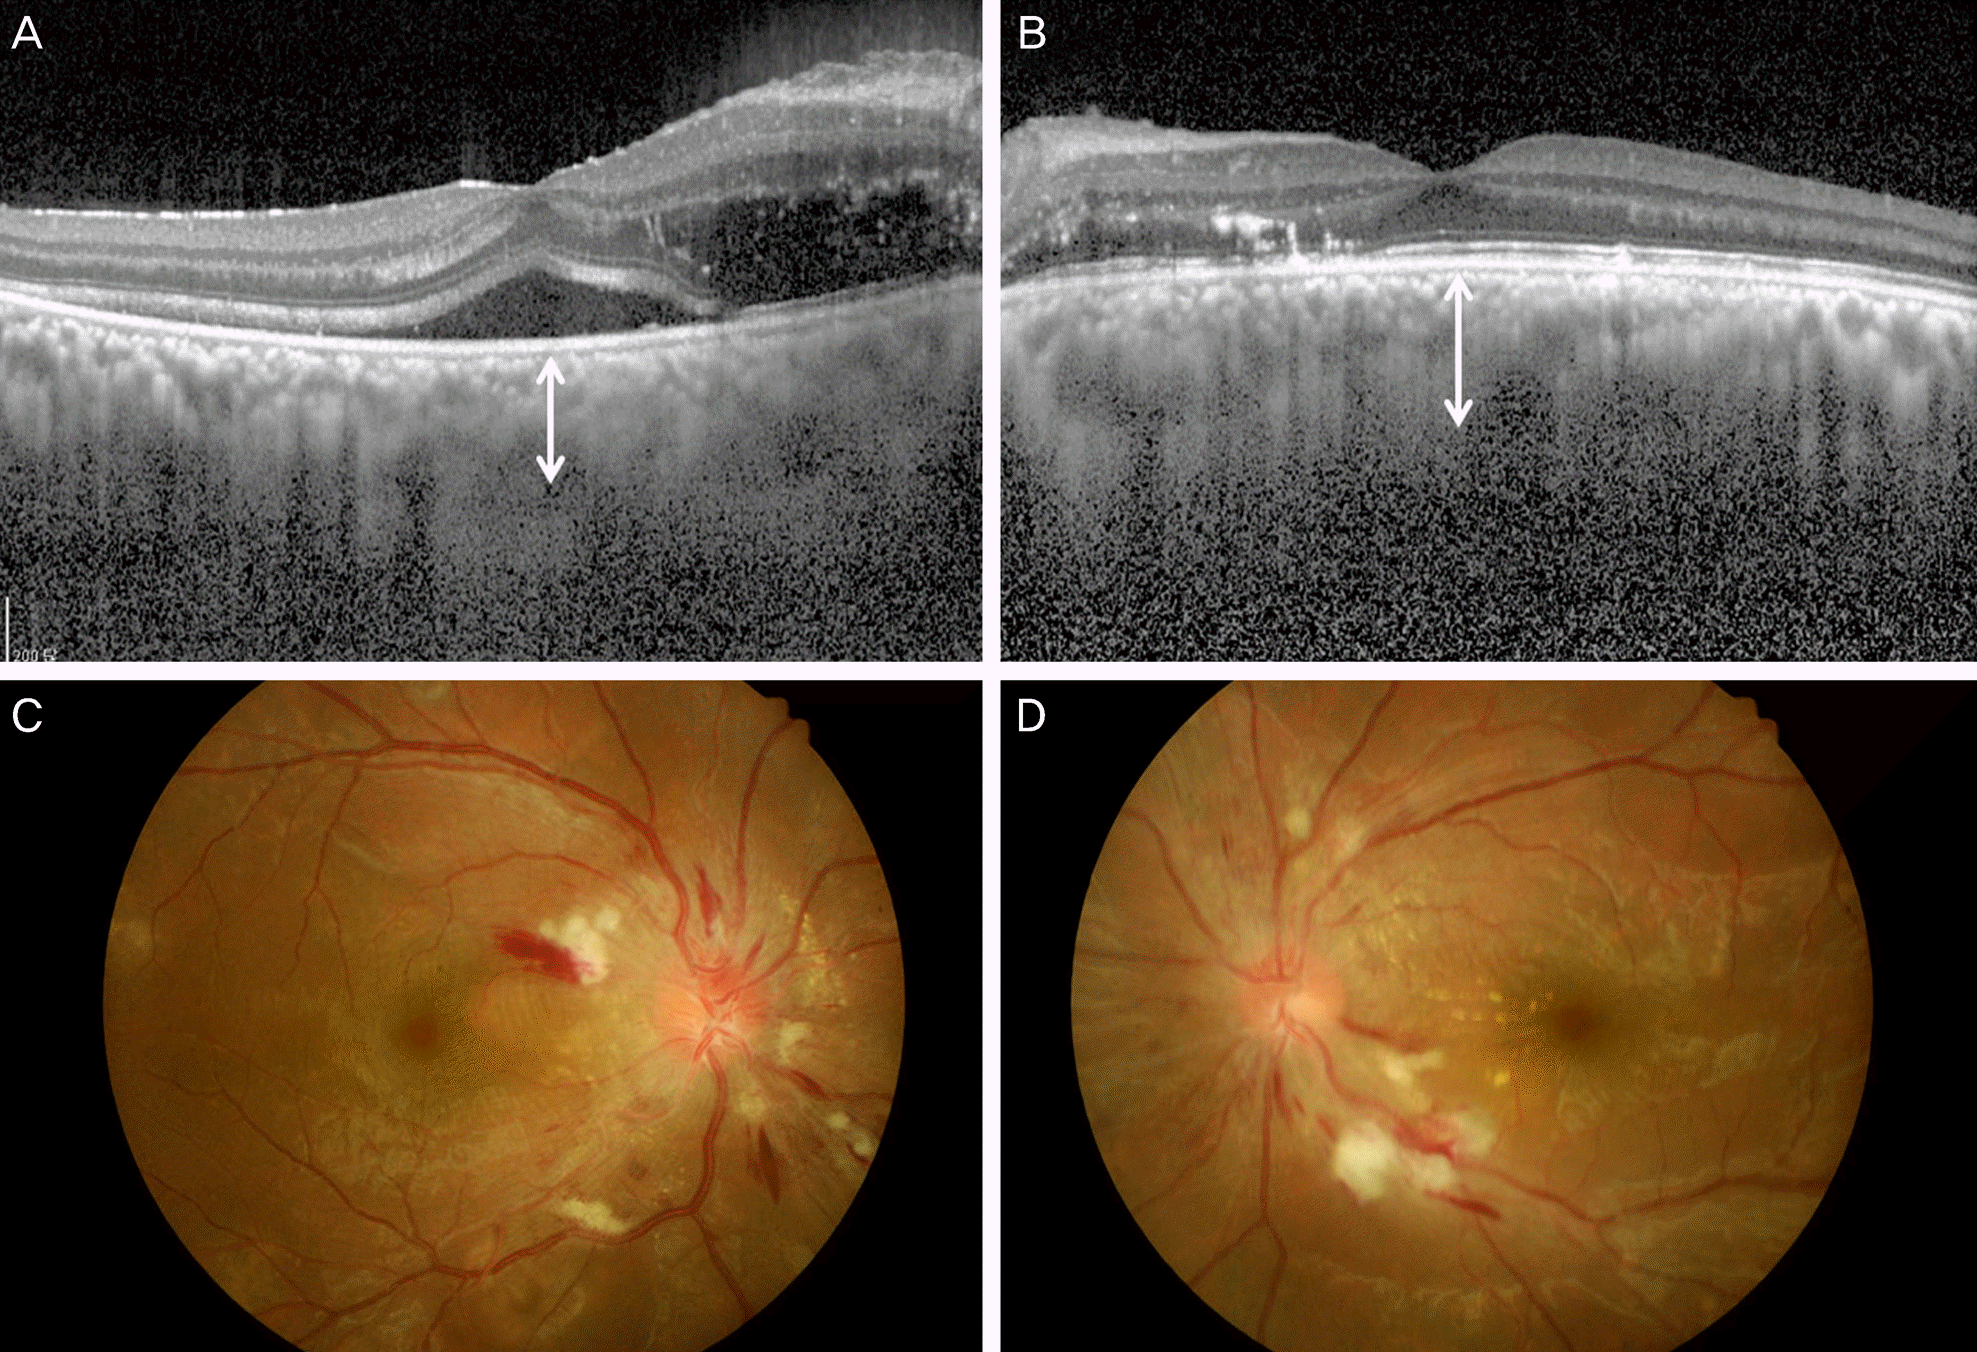 | Figure 3.Patient No. 6. The eyes of 29-year-old man with essential hypertension a month before. On examination, blood pressure was 220/150 mm Hg and fundus biomicroscopy revealed multiple cotton wool spots, hard exudates and papilledema (C, D). In the right eye on enhanced depth imaging optical coherence tomography (EDI-OCT), macular edema and serous retinal detachment is seen. (A) The subfoveal choroidal thickness (SFCT) increased in both eyes, which was 422.0 μm in the right eye (A, white line) and 446.5 μm in the left eye (B, white line). |
Table 1.
The clinical characteristics of the patients with malignant hypertension
Table 2.
Value of each factor in malignant hypertension patients before and after blood pressure control
| Before BP control | After BP control | Change in value after BP control | p-value* | |
|---|---|---|---|---|
| Systolic BP (mm Hg) | 197.33 ± 12.70 | 142.83 ± 24.52 | -54.50 ± 27.62 | 0.002 |
| (180-220) | (105-170) | (-95∼-15) | ||
| Diastolic BP (mm Hg) | 123.67 ± 20.58 | 85.83 ± 17.44 | -37.83 ± 22.90 | 0.002 |
| (98-150) | (64-110) | (-66∼-4) | ||
| IOP (mm Hg) | 14.08 ± 2.58 | 13.50 ± 2.47 | -0.58 ± 1.62 | 0.203 |
| (10-18) | (9-16) | (-3∼ 2) | ||
| SFCT (μm) | 412.63 ± 66.55 | 356.96 ± 59.08 | -55.67 ± 37.35 | 0.002 |
| (305-521.5) | (286-478.5) | (-145.5∼-19) | ||
| CST (μm) | 299.42 ± 59.71 | 279.58 ± 43.26 | -19.83 ± 34.41 | 0.061 |
| (259-477) | (212-393) | (-91∼3) | ||
| CEVD | 142.67 ± 18.65 | 125.46 ± 15.62 | -17.21 ± 7.56 | 0.002 |
| (108.11-167.02) | (100.38-152.62) | (-26.19∼-6.46) |
Table 3.
Spearman correlation coefficient between changes in SFCT and BP
| Change in SFCT | p-value* | |
|---|---|---|
| Change of systolic BP (before BP control-after BP control) | 0.000 | 1.000 |
| Change of diastolic BP (before BP control-after BP control) | 0.028 | 0.931 |
 XML Download