Abstract
Purpose
To evaluate the clinical outcomes of eyes implanted with a zonal refractive multifocal intraocular lens (IOL) with an inferior segmental near add (M-plus), and to compare the outcomes between M-plus and a diffractive-type multifocal IOL, AT LISA (366D, bifocal).
Methods
We reviewed 19 eyes from 10 patients who were implanted with M-plus and 52 eyes of 26 patients who were implanted with AT LISA. The clinical outcomes of these 2 intraocular lenses were evaluated at 1 day and 2 months postoperatively, and consisted of distant, intermediate, and near visual acuity, contrast sensitivity, degree of tilt, and decentration using anterior segment photography, depth of focus, and patient satisfaction.
Results
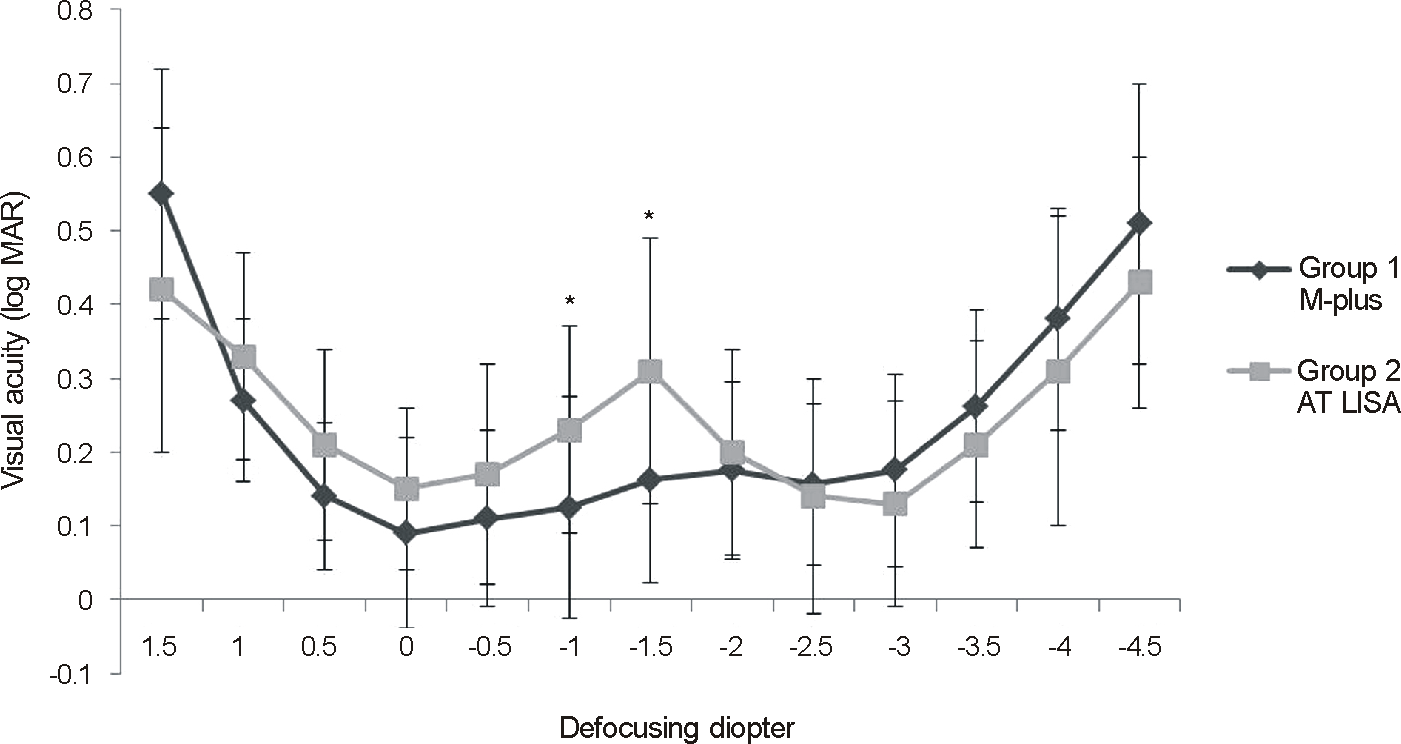
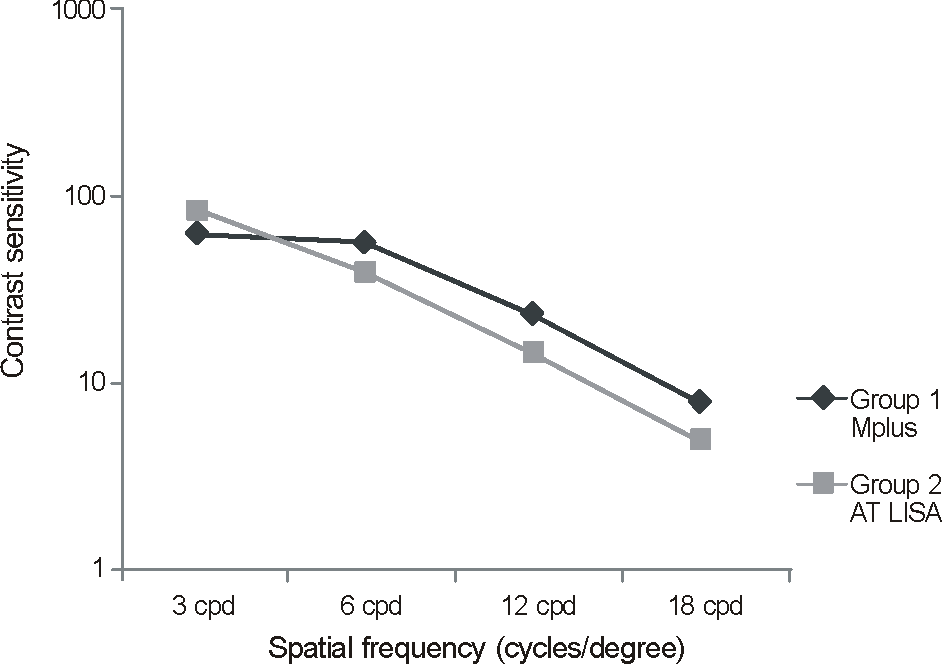
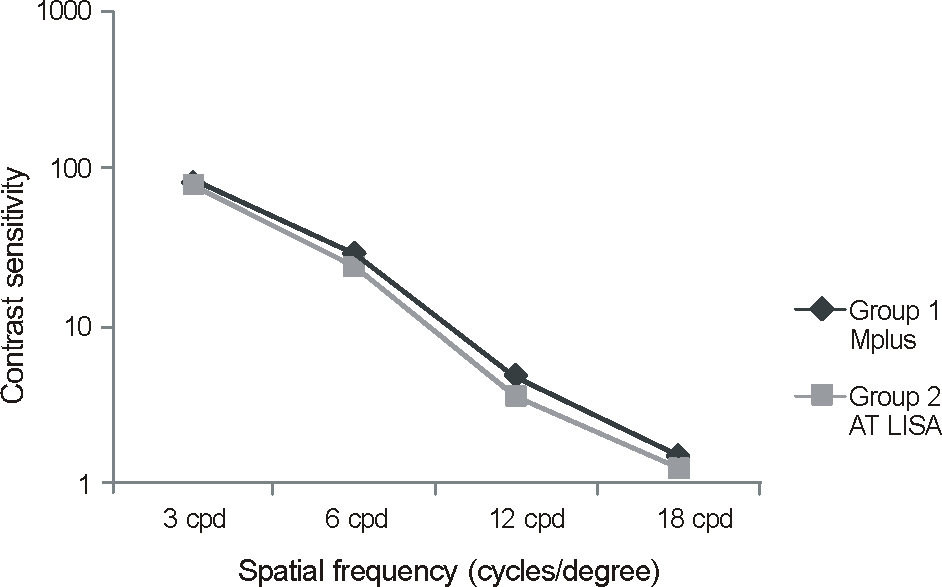
There were no statistical differences between the 2 groups with respect to distant vision, near vision, refractive error, contrast sensitivity, degree of tilt, decentration, or satisfaction score. The M-plus group demonstrated significantly better intermediate visual acuity. In the defocus curve, the M-plus group also demonstrated significantly better visual acuities for intermediate unfocused vision levels.
Go to : 
References
1. Hofmann T, Zuberbuhler B, Cervino A, et al. Retinal straylight and complaint scores 18 months after implantation of the AcrySof monofocal and ReSTOR diffractive intraocular lenses. J Refract Surg. 2009; 25:485–92.

2. Hunkeler JD, Coffman TM, Paugh J, et al. Characterization of visual phenomena with the Array multifocal intraocular lens. J Cataract Refract Surg. 2002; 28:1195–204.

3. Leyland M, Zinicola E. Multifocal versus monofocal intraocular lenses in cataract surgery: a systematic review. Ophthalmology. 2003; 110:1789–98.
4. Montés-Micó R, Alió JL. Distance and near contrast sensitivity function after multifocal intraocular lens implantation. J Cataract Refract Surg. 2003; 29:703–11.

5. Pieh S, Lackner B, Hanselmayer G, et al. Halo size under distance and near conditions in refractive multifocal intraocular lenses. Br J Ophthalmol. 2001; 85:816–21.

6. Steinert RF, Aker BL, Trentacost DJ, et al. A prospective comparative study of the AMO ARRAY zonal-progressive multifocal silicone intraocular lens and a monofocal intraocular lens. Ophthalmology. 1999; 106:1243–55.

7. Woodward MA, Randleman JB, Stulting RD. Dissatisfaction after multifocal intraocular lens implantation. J Cataract Refract Surg. 2009; 35:992–7.

8. Alfonso JF, Puchades C, Fernández-Vega L, et al. Contrast sensitivity comparison between AcrySof ReSTOR and Acri.LISA aspheric intraocular lenses. J Refract Surg. 2010; 26:471–7.

9. Alió JL, Elkady B, Ortiz D, Bernabeu G. Clinical outcomes and intraocular optical quality of a diffractive multifocal intraocular lens with asymmetrical light distribution. J Cataract Refract Surg. 2008; 34:942–8.

10. Castillo-Gómez A, Carmona-González D, Martínez-de-la-Casa JM, et al. Evaluation of image quality after implantation of 2 diffractive multifocal intraocular lens models. J Cataract Refract Surg. 2009; 35:1244–50.

11. Fernandez-Vega L, Madrid-Costa D, Alfonso JF, et al. Bilateral implantation of the Acri.LISA bifocal intraocular lens in myopic eyes. Eur J Ophthalmol. 2010; 20:83–9.
12. Gwak JY, Choi JS, Pak KH, Baek NH. Visual and optical functions after diffractive multifocal intraocular lens. J Korean Ophthalmol Soc. 2012; 53:396–402.

13. Kim SM, Kim CH, Chung ES, Chung TY. Visual outcome and patient satisfaction after Implantation of Multifocal IOLs: three-month follow-up results. J Korean Ophthalmol Soc. 2012; 53:230–7.

14. Heo JW, Yoon HS, Shin JP, et al. A validation and reliability study of the Korean version of national eye institute visual function questionnaire 25. J Korean Ophthalmol Soc. 2010; 51:1354–67.

15. Alfonso JF, Fernández-Vega L, Blázquez JI, Montés-Micó R. Visual function comparison of 2 aspheric multifocal intraocular lenses. J Cataract Refract Surg. 2012; 38:242–8.

16. Alio JL, Plaza-Puche AB, Javaloy J, et al. Comparison of a new refractive multifocal intraocular lens with an inferior segmental near add and a diffractive multifocal intraocular lens. Ophthalmology. 2012; 119:555–63.

17. Alió JL, Plaza-Puche AB, Montalban R, Javaloy J. Visual outcomes with a single-optic accommodating intraocular lens and a low-addition-power rotational asymmetric multifocal intraocular lens. J Cataract Refract Surg. 2012; 38:978–85.

18. Montés-Micó R, López-Gil N, Pérez-Vives C, et al. In vitro optical performance of nonrotational symmetric and refractive-diffractive aspheric multifocal intraocular lenses: impact of tilt and decentration. J Cataract Refract Surg. 2012; 38:1657–63.

19. Patel CK, Ormonde S, Rosen PH, Bron AJ. Postoperative intraocular lens rotation: a randomized comparison of plate and loop haptic implants. Ophthalmology. 1999; 106:2190–5.
Go to : 
 | Figure 3.Visual acuity at various defocus levels. The values are a mean of logMAR visual acuity (* p < 0.05). |
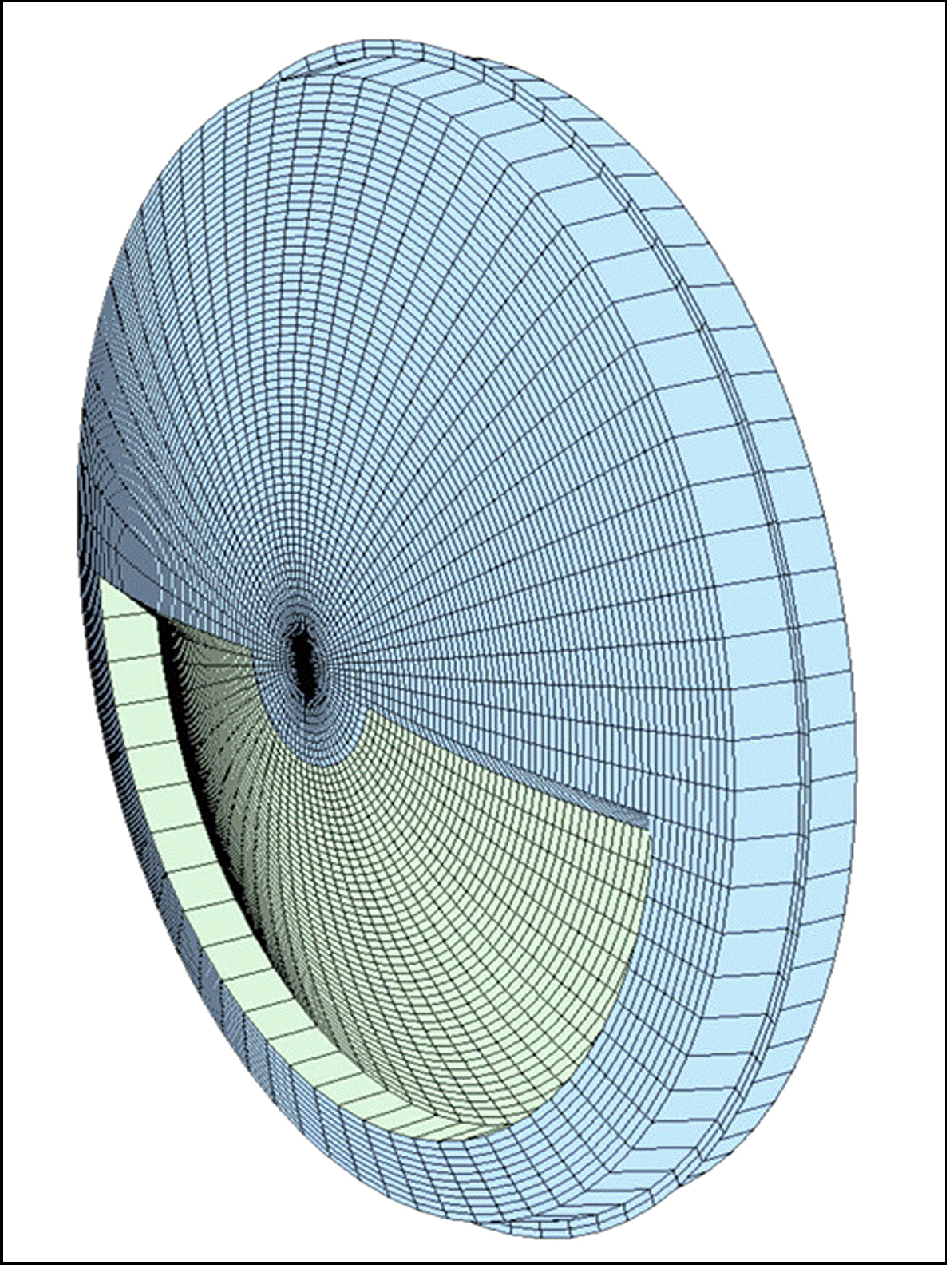
 | Figure 4.M-plus multifocal intraocular lens design (seamless transition between near and far zone). |
Table 1.
Demographics of the study group
Table 2.
Postoperatie visual acuity (log MAR)
| IOL groups | Mplus LS-313 | AT LISA 366D | p-value |
|---|---|---|---|
| UDVA | 0.09 ± 0.13 | 0.14 ± 0.13 | 0.58 |
| CDVA | 0.06 ± 0.11 | 0.06 ± 0.06 | 0.72 |
| UIVA | 0.38 ± 0.21 | 0.46 ± 0.12 | 0.03* |
| CIVA | 0.33 ± 0.16 | 0.37 ± 0.14 | 0.83 |
| UNVA | 0.21 ± 0.18 | 0.14 ± 0.11 | 0.54 |
| CNVA | 0.15 ± 0.19 | 0.13 ± 0.08 | 0.66 |
Table 3.
Postoperative refraction (diopter)
| IOL groups | Mplus LS-313 | AT LISA 366D | p-value |
|---|---|---|---|
| Sphere | -0.67 ± 0.85 | -0.31 ± 0.63 | 0.046 |
| Cylinder | -0.75 ± 0.42 | -0.65 ± 0.54 | 0.498 |
| S.E. | -1.04 ± 0.81 | -0.64 ± 0.54 | 0.022* |
| Target refraction | 0.10 ± 0.35 | -0.16 ± 0.15 | < 0.001* |
| The difference with S.E. and target refraction | 1.15 ± 0.66 | 0.48 ± 0.57 | 0.001* |
Table 4.
Postoperative tilt degree and decentration (360’ angle)
|
Mplus LS-313 |
AT LISA 366D |
|||
|---|---|---|---|---|
| POD 1 day | POD 2 months | POD 1 day | POD 2 months | |
| Tilt degree | 7.75 ± 6.11 | 7.61 ± 6.40 | 9.84 ± 5.90 | 9.96 ± 5.81 |
| Decentration | 0.09 ± 0.07 | 0.10 ± 0.08 | 0.08 ± 0.09 | 0.08 ± 0.10 |
Table 5.
Correlation between the degree of tilt and decentration with visual quality in the M-plus group


 PDF
PDF ePub
ePub Citation
 Print
Print


 XML Download