

 PDF
PDF ePub
ePub Citation
 Print
Print


Abstract
Purpose
To compare the level of accuracy of intraocular pressure (IOP) measurements attained by non-contact tonometer (NCT), rebound tonometer (RT) Icare®, and Tono-Pen (TONO-PEN AVIA®), using Goldmann Applanation tonometer (GAT) as a reference value and to explore their clinical usefulness.
Methods
In a prospective study of 71 normal eyes, IOP was measured with NCT, RT, Tono-Pen and GAT. The IOP values of were then compared between the eyes.
Results
RT showed statistically most significant agreement with the GAT [ICC 0.811, 95%CI 0.712-0.878]. In analysis of Bland-Altman plots, NCT showed the smallest mean bias (+0.2 mm Hg) and widest CI (95%CI; ±5.05 mm Hg), RT showed relatively small mean bias (-0.7 mm Hg) and narrowest CI (95%CI; ±3.75 mm Hg).
References
1. Goldmann H, Schmidt T.[Applanation tonometry]. Ophthalmologica. 1957; 134:221–42.
2. Whitacre MM, Stein R.Sources of error with use of Goldmann-type tonometers. Surv Ophthalmol. 1993; 38:1–30.

3. Doughty MJ, Zaman ML.Human corneal thickness and its impact on intraocular pressure measures: a review and meta-analysis approach. Surv Ophthalmol. 2000; 44:367–408.
4. Liu J, Roberts CJ.Influence of corneal biomechanical properties on intraocular pressure measurement: quantitative analysis. J Cataract Refract Surg. 2005; 31:146–55.
5. Kohlhaas M, Boehm AG, Spoerl E. . Effect of central corneal thickness, corneal curvature, and axial length on applanation tonometry. Arch Ophthalmol. 2006; 124:471–6.
6. Broman AT, Congdon NG, Bandeen-Roche K, Quigley HA.Influence of corneal structure, corneal responsiveness, and other ocular parameters on tonometric measurement of intraocular pressure. J Glaucoma. 2007; 16:581–8.
7. Luce DA.Determining in vivo biomechanical properties of the cornea with an ocular response analyzer. J Cataract Refract Surg. 2005; 31:156–62.
8. Vajaranant TS, Price MO, Price FW. . Intraocular pressure measurements following Descemet stripping endothelial keratoplasty. Am J Ophthalmol. 2008; 145:780–6.
9. Ceruti P, Morbio R, Marraffa M, Marchini G.Comparison of dy-namic contour tonometry and goldmann applanation tonometry in deep lamellar and penetrating keratoplasties. Am J Ophthalmol. 2008; 145:215–21.
10. Fernandes P, Díaz-Rey JA, Queirós A. . Comparison of the ICare rebound tonometer with the Goldmann tonometer in a nor-mal population. Ophthalmic Physiol Opt. 2005; 25:436–40.
11. Jorge J, Fernandes P, Queirós A. . Comparison of the IOPen and iCare rebound tonometers with the Goldmann tonometer in a normal population. Ophthalmic Physiol Opt. 2010; 30:108–12.
12. Nakamura M, Darhad U, Tatsumi Y. . Agreement of rebound tonometer in measuring intraocular pressure with three types of ap-planation tonometers. Am J Ophthalmol. 2006; 142:332–4.
13. Brusini P, Salvetat ML, Zeppieri M. . Comparison of ICare ton-ometer with Goldmann applanation tonometer in glaucoma patients. J Glaucoma. 2006; 15:213–7.
14. Martinez-de-la-Casa JM, Garcia-Feijoo J, Castillo A, Garcia-Sanchez J.Reproducibility and clinical evaluation of rebound tonometry. Invest Ophthalmol Vis Sci. 2005; 46:4578–80.
15. Shields MB.The non-contact tonometer. Its value and limitations. Surv Ophthalmol. 1980; 24:211–9.
16. Vernon SA.Intra-eye pressure range and pulse profiles in normals with the Pulsair non-contact tonometer. Eye (Lond). 1993; 7(Pt 1):134–7.
17. Whitacre MM, Emig M, Hassanein K.The effect of Perkins, Tono-Pen, and Schiötz tonometry on intraocular pressure. Am J Ophthalmol. 1991; 111:59–64.
18. Frenkel RE, Hong YJ, Shin DH.Comparison of the Tono-Pen to the Goldmann applanation tonometer. Arch Ophthalmol. 1988; 106:750–3.
19. Kao SF, Lichter PR, Bergstrom TJ. . Clinical comparison of the Oculab Tono-Pen to the Goldmann applanation tonometer. Ophthalmology. 1987; 94:1541–4.
20. Minckler DS, Baerveldt G, Heuer DK. . Clinical evaluation of the Oculab Tono-Pen. Am J Ophthalmol. 1987; 104:168–73.
21. Davies LN, Bartlett H, Mallen EA, Wolffsohn JS.Clinical evalua-tion of rebound tonometer. Acta Ophthalmol Scand. 2006; 84:206–9.
22. Bandyopadhyay M, Raychaudhuri A, Lahiri SK. . Comparison of Goldmann applanation tonometry with the Tonopen for measur-ing intraocular pressure in a population-based glaucoma survey in rural West Bengal. Ophthalmic Epidemiol. 2002; 9:215–24.
23. International Organization for Standardization. Ophthalmic Instruments― Tonometers: ISO8612:2001. Geneva, Switzerland: International Organization for Standardization. 2001.
24. Grieshaber MC, Schoetzau A, Zawinka C. . Effect of central corneal thickness on dynamic contour tonometry and Goldmann applanation tonometry in primary open-angle glaucoma. Arch Ophthalmol. 2007; 125:740–4.
25. Holladay JT, Allison ME, Prager TC.Goldmann applanation ton-ometry in patients with regular corneal astigmatism. Am J Ophthalmol. 1983; 96:90–3.
26. Rask G, Behndig A.Effects of corneal thickness, curvature, astig-matism and direction of gaze on Goldmann applanation tonometry readings. Ophthalmic Res. 2006; 38:49–55.
27. Mark HH.Corneal curvature in applanation tonometry. Am J Ophthalmol. 1973; 76:223–4.
28. Shyn KH, Ahn SK, Cho HK, Kim BH.Comparison between intra-ocular pressures measured by non-contact tonometer and gold-mann applanation tonometer. J Korean Ophthalmol Soc. 1994; 35:700–3.
29. Abraham LM, Epasinghe NC, Selva D, Casson R.Comparison of the ICare rebound tonometer with the Goldmann applanation ton-ometer by experienced and inexperienced tonometrists. Eye (Lond). 2008; 22:503–6.
30. Moreno-Montañés J, Gosende I, Caire J, García-Granero M.Comparation of the new rebound tonometer IOPen and the Goldmann tonometer, and their relationship to corneal properties. Eye (Lond). 2011; 25:50–6.
31. Moreno-Montañés J, García N, Fernández-Hortelano A, García- Layana A.Rebound tonometer compared with goldmann ton-ometer in normal and pathologic corneas. Cornea. 2007; 26:427–30.
Figure 1.
Bland-Altman plots of difference versus the mean plot illustrating the intersessional repeatability of IOP measurements with the Icare tonometer. The solid line represents the mean bias and the dashed lines represent ±1.96 SD confidence interval (CI) (i.e. 95% of the points should fall within these lines). SD = standard deviation.
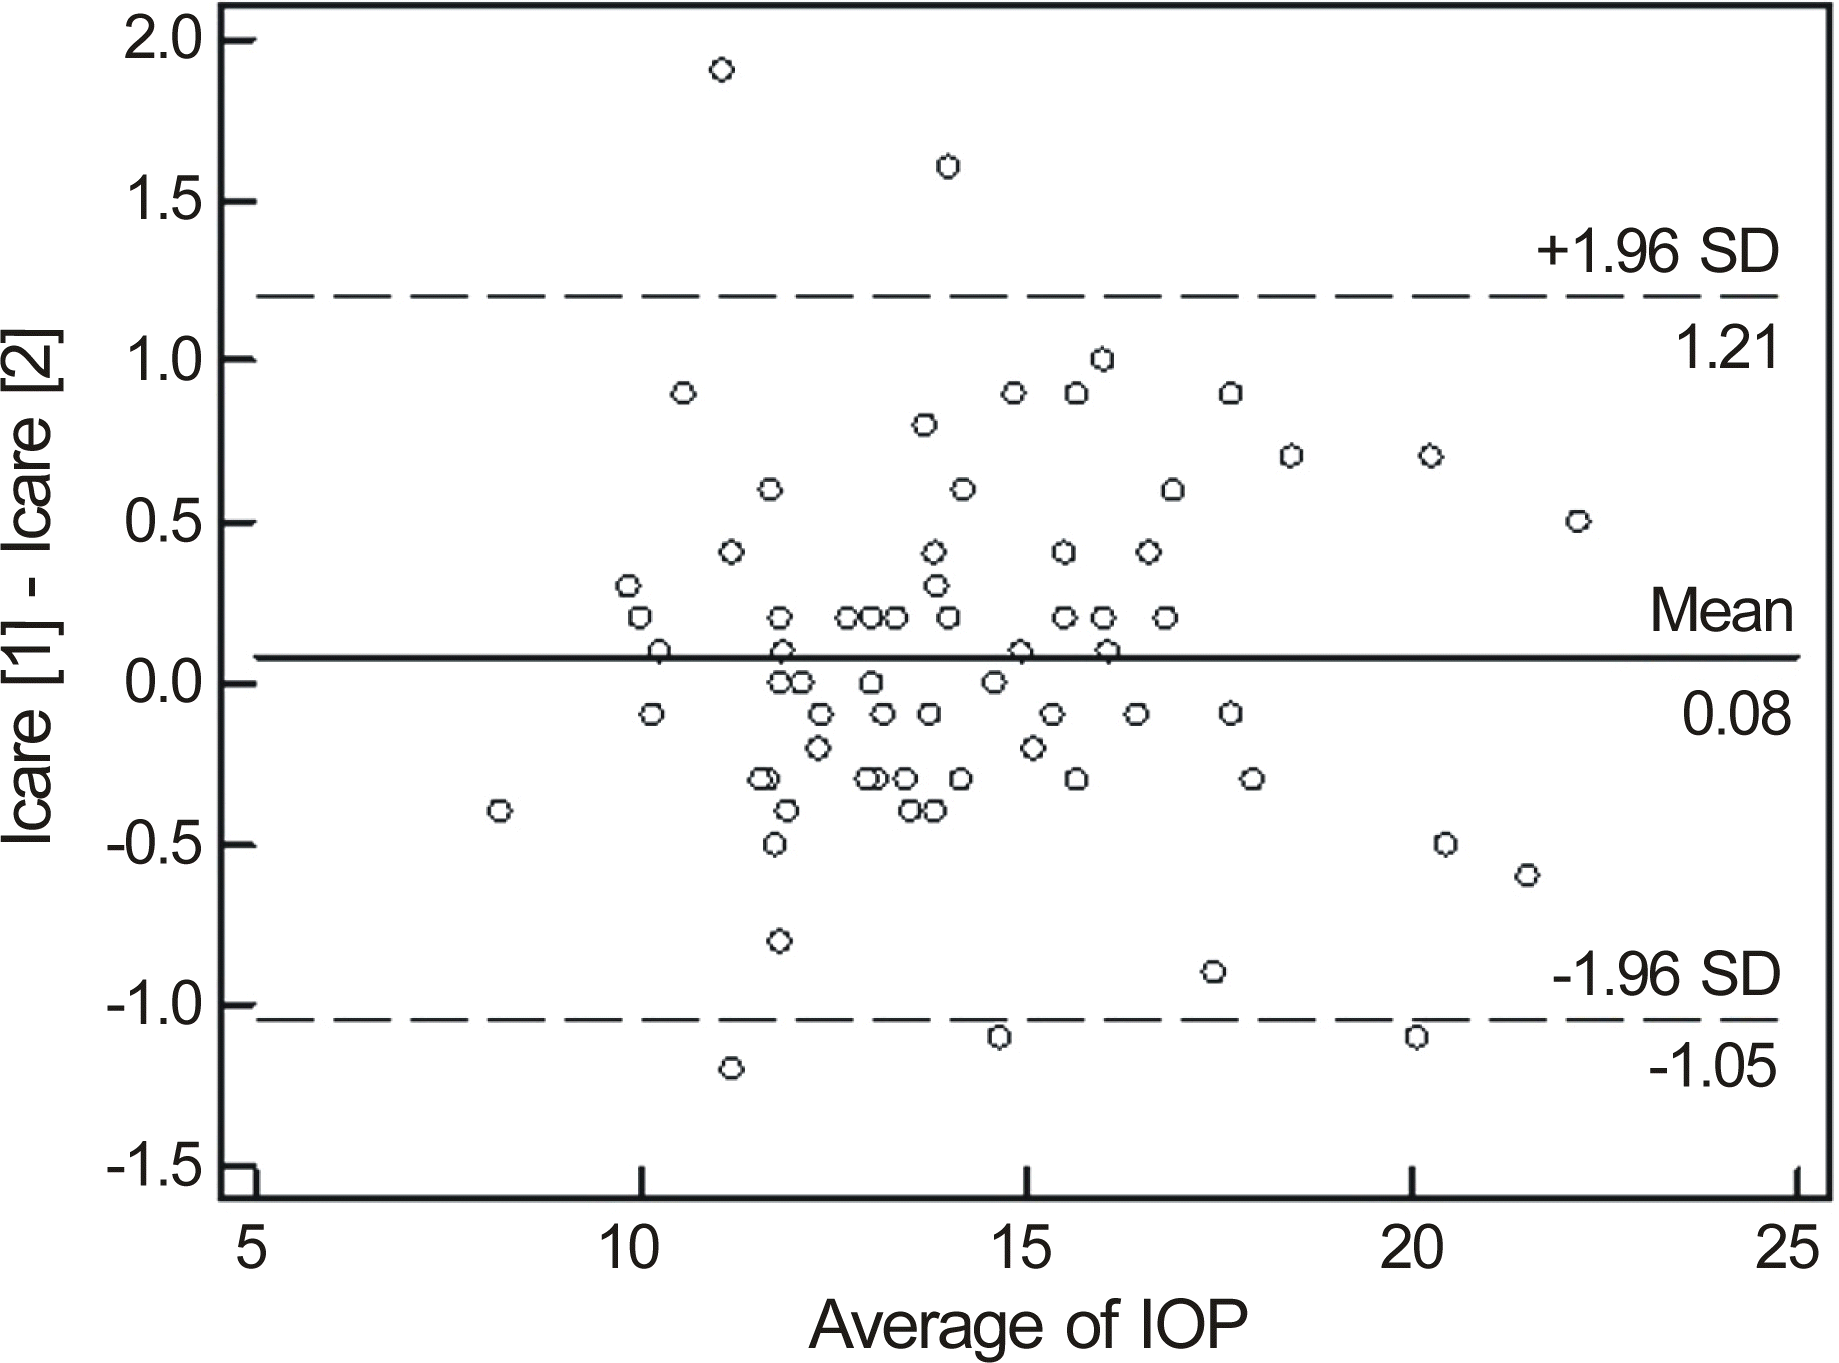
Figure 2.
Bland-Altman plots of agreement between Goldmann applanation tonometer and noncontact tonometer for normal eyes. The differences in IOP of both tonometers (Goldmann applanation tonometer value minus noncontact tonometer val-vue, mm Hg) are plotted against the average of the IOP of both tonometers. The solid line represents the mean bias and the dashed lines represent ±1.96 SD confidence interval (CI) (i.e. 95% of the points should fall within these lines). SD = standard deviation.
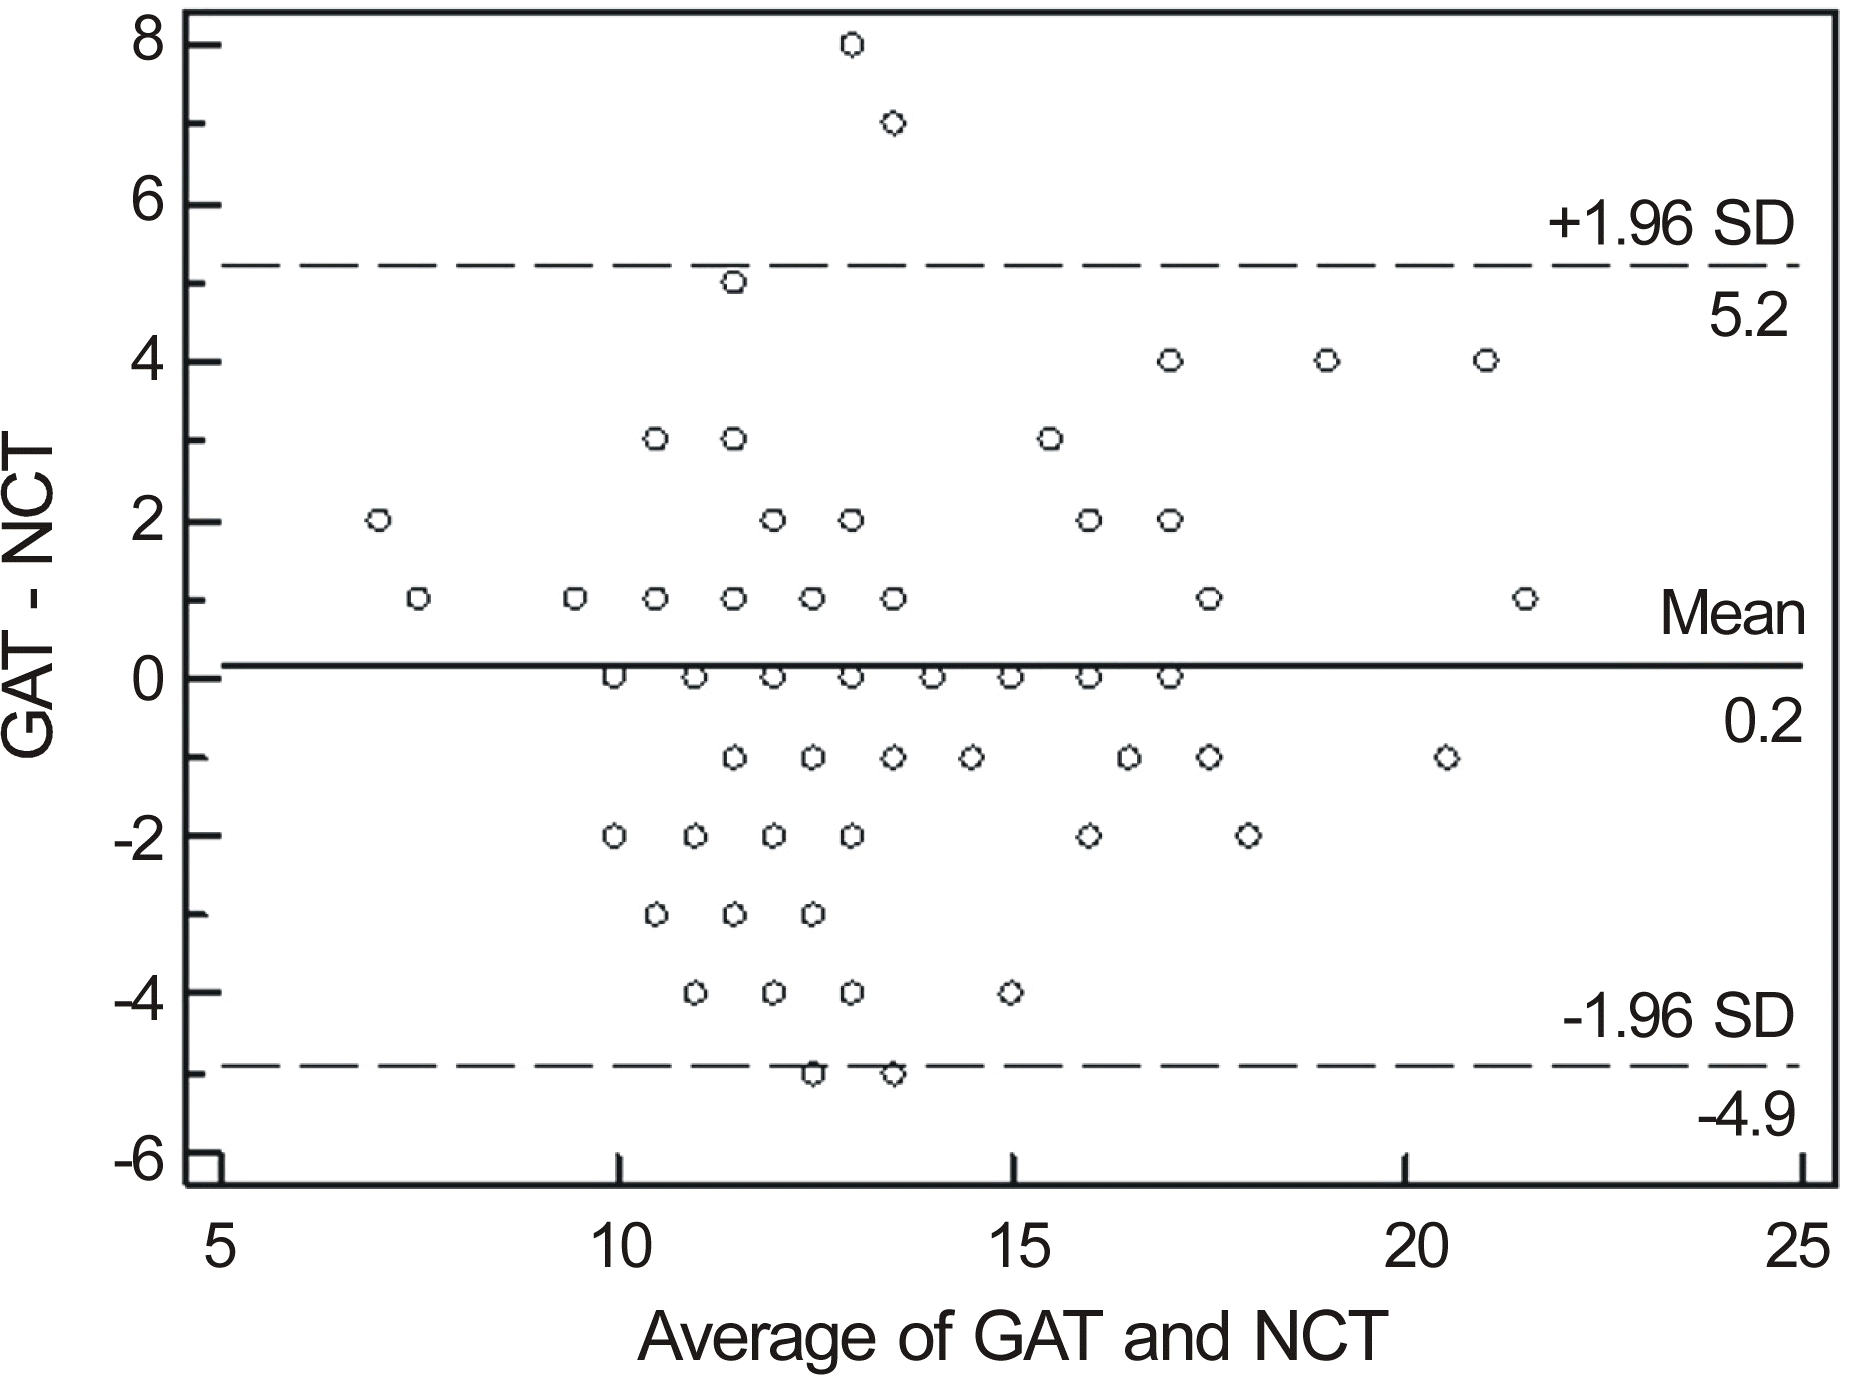
Figure 3.
Bland-Altman plots of agreement between Goldmann applanation tonometer and Icare for normal eyes. The differences in IOP of both tonometers (Goldmann applanation tonometer value minus noncontact tonometer valvue, mm Hg) are plotted against the average of the IOP of both tonometers. The solid line represents the mean bias and the dashed lines represent ±1.96 SD confidence interval (CI) (i.e. 95% of the points should fall within these lines). SD = standard deviation.
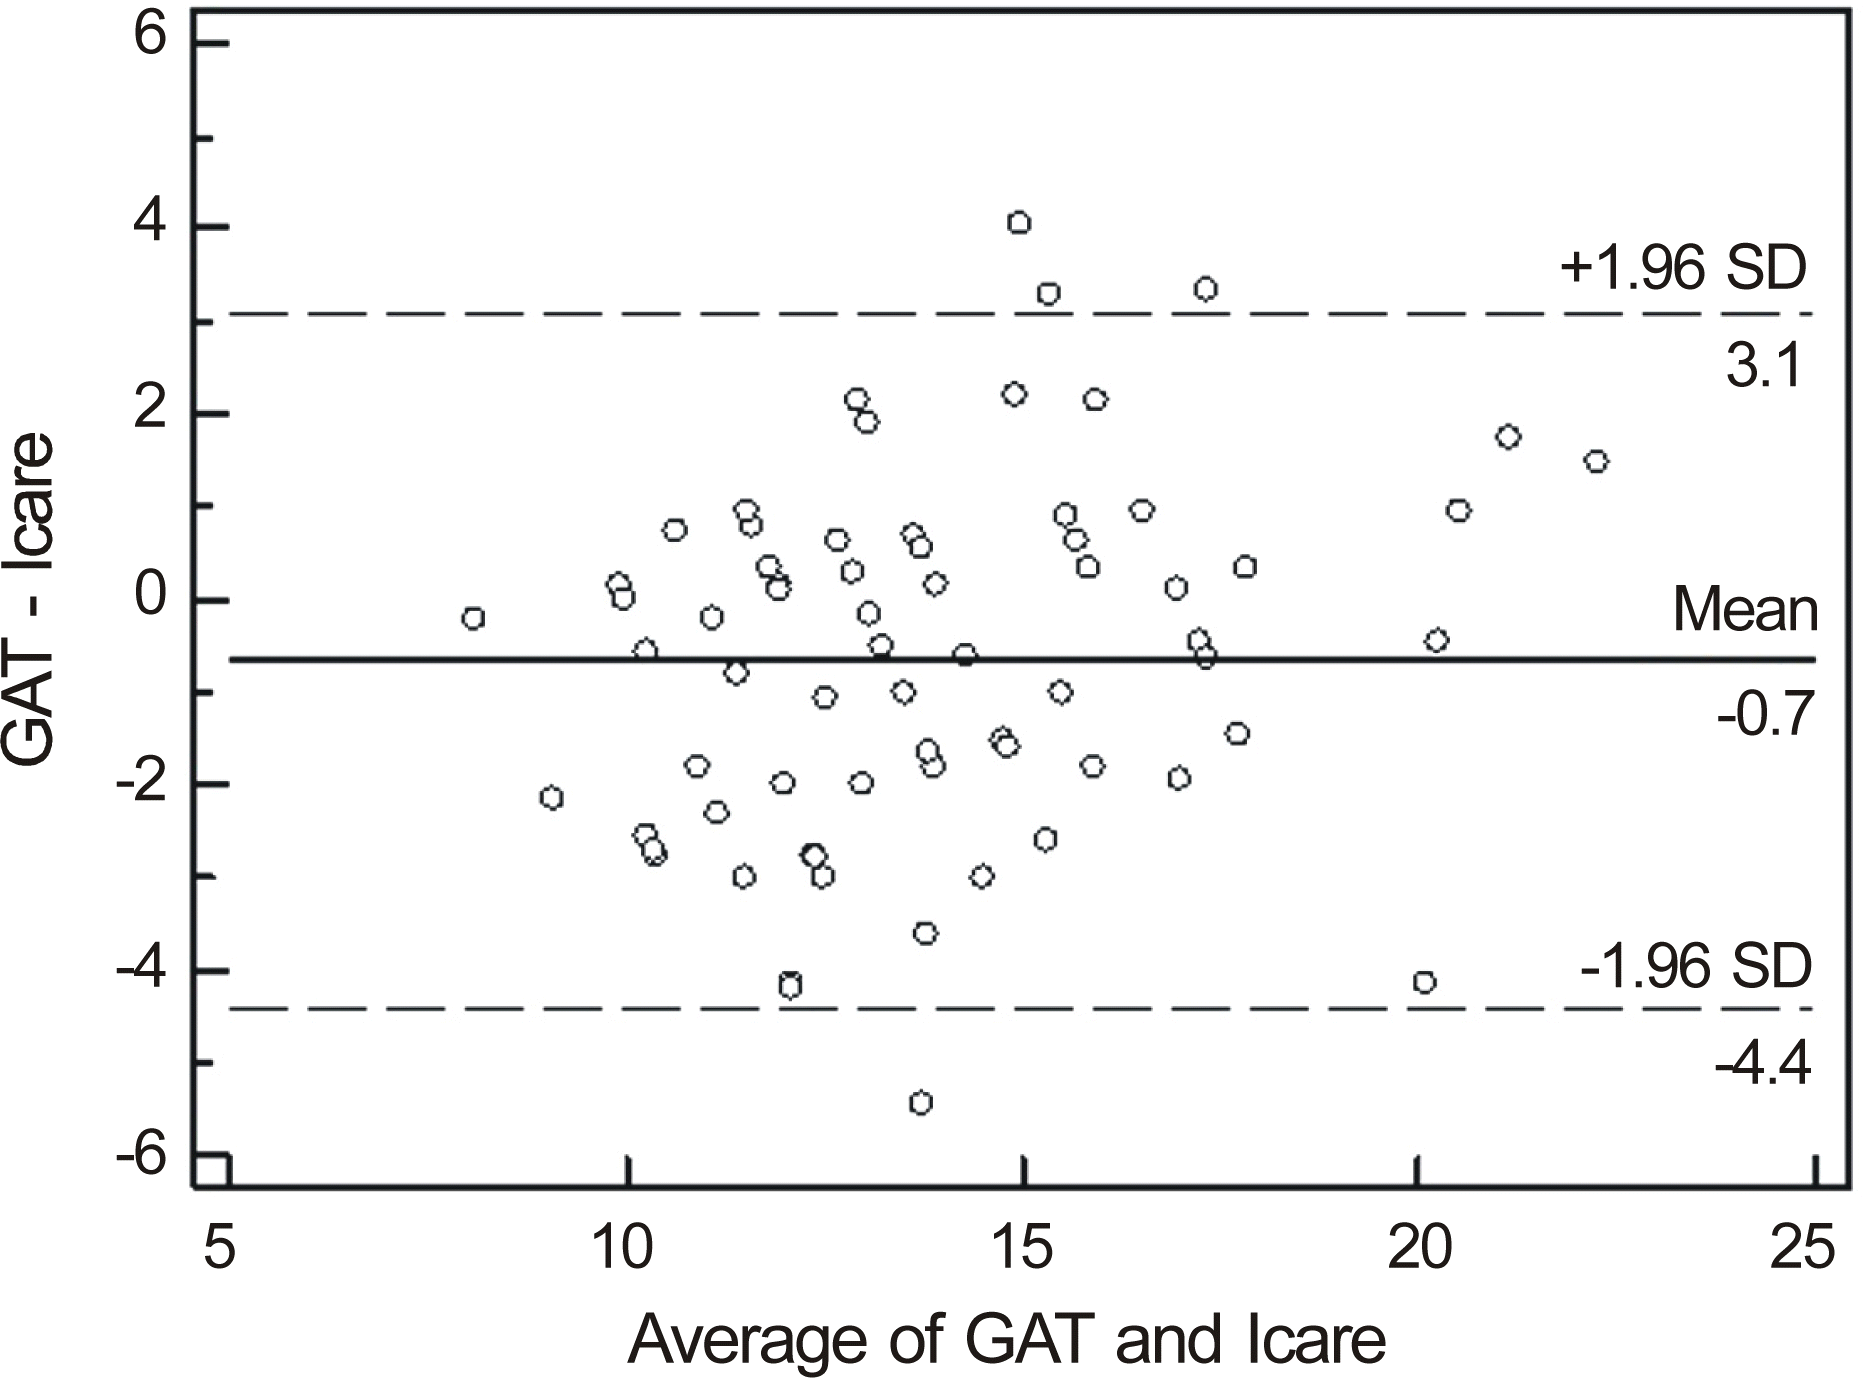
Figure 4.
Bland-Altman plots of agreement between Goldmann applanation tonometer and Tono-Pen for normal eyes. The differences in IOP of both tonometers (Goldmann applanation tonometer value minus noncontact tonometer valvue, mm Hg) are plotted against the average of the IOP of both tonometers. The solid line represents the mean bias and the dashed lines represent ±1.96 SD confidence interval (CI) (i.e. 95% of the points should fall within these lines). SD = standard deviation.
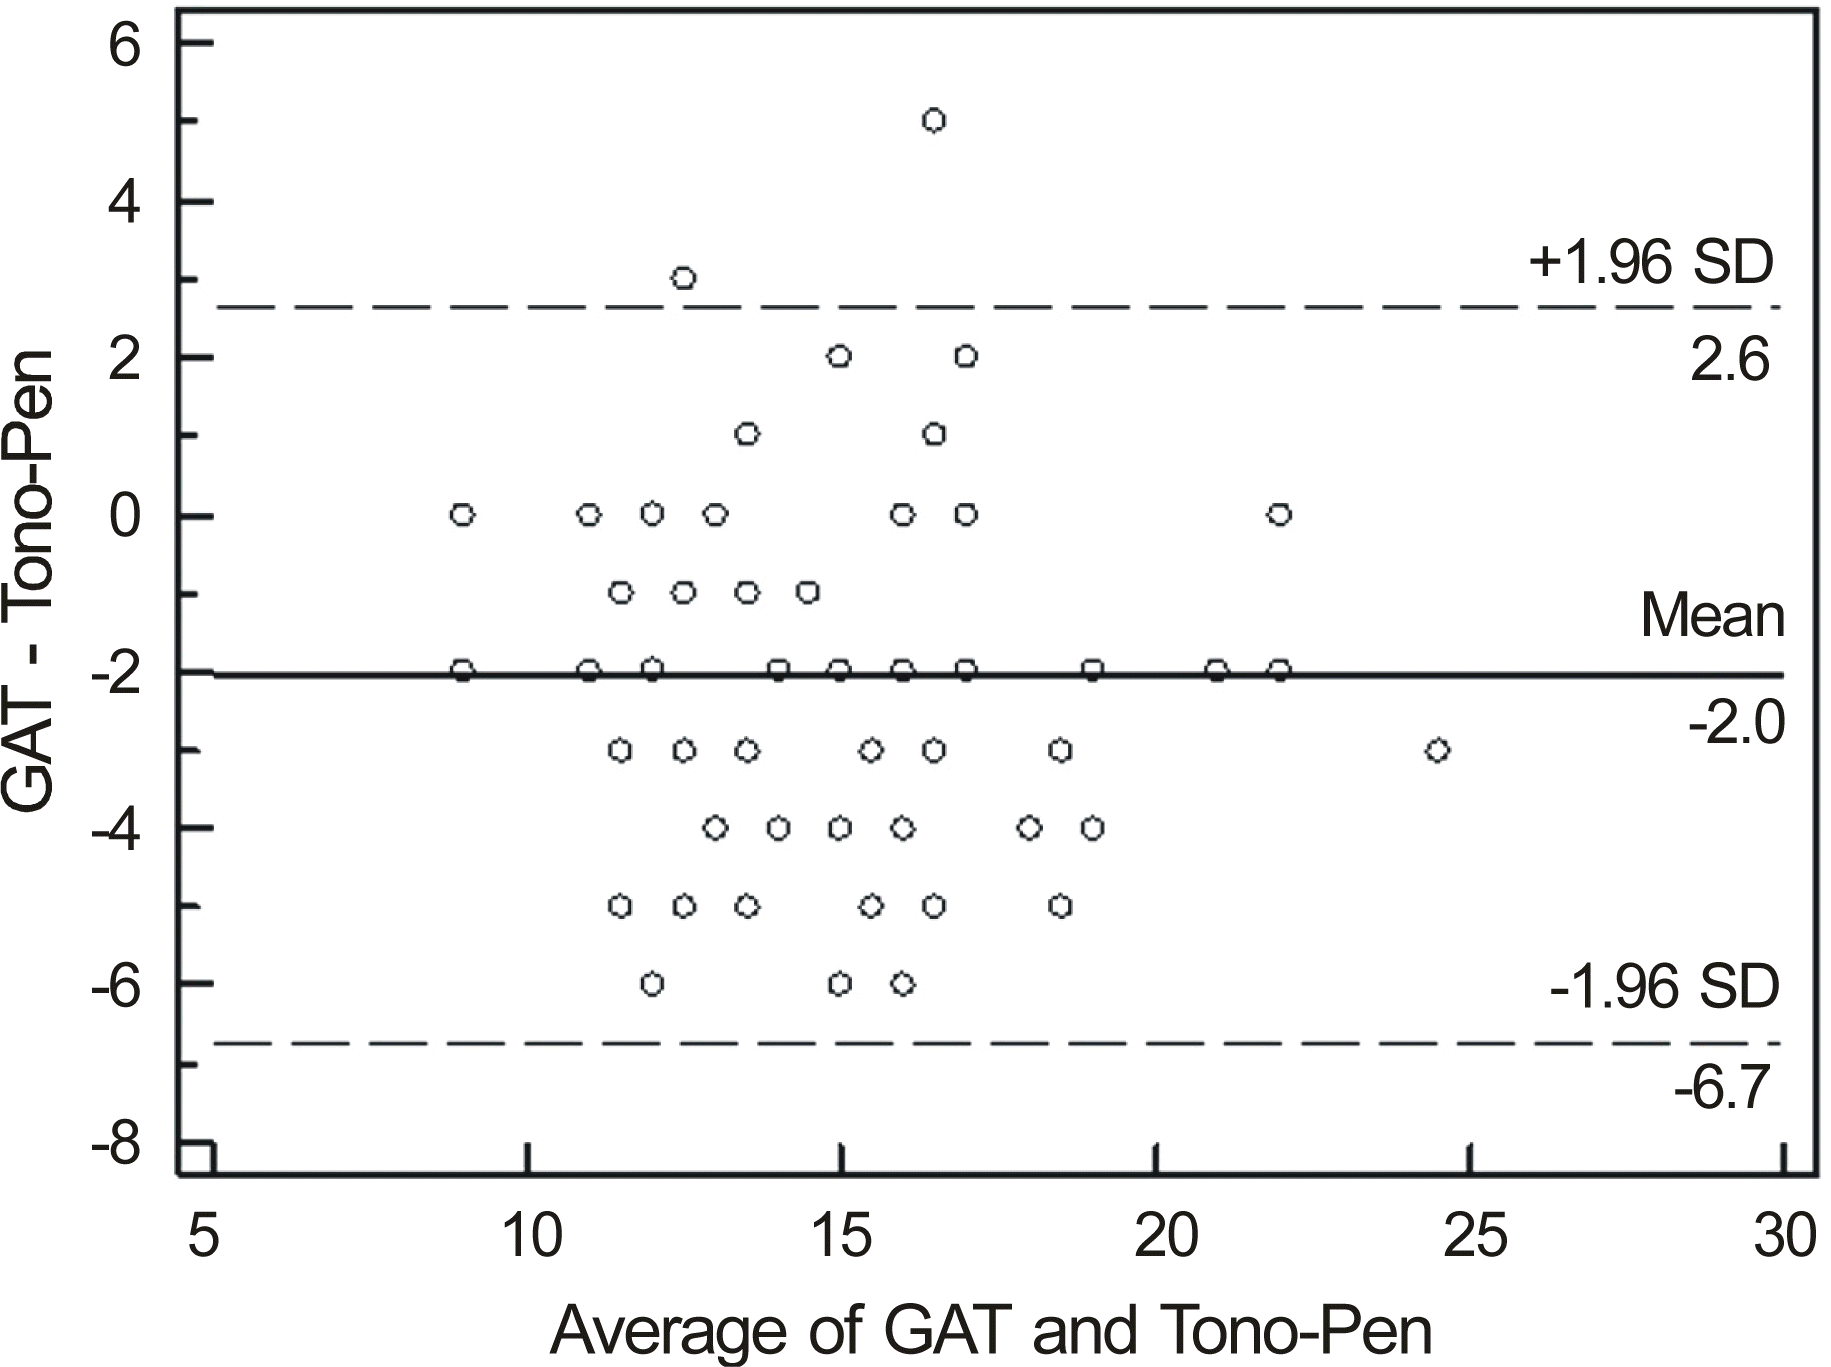
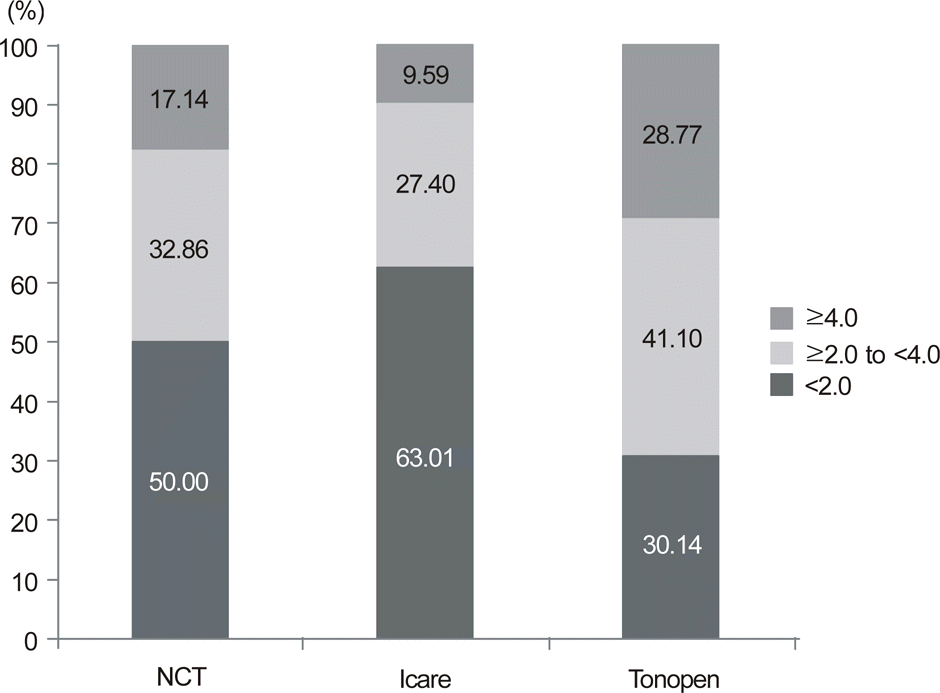
Figure 5.
Incidence of absolute value for IOP differences between noncontact tonometer, Tono-Pen, or Icare and Goldmann applanation tonometer (considered as a reference) measurements.
 XML Download