Abstract
Purpose
To investigate the effects of pterygium size on the change of corneal astigmatism and corneal higher-order aberrations (HOAs) after surgery.
Methods
Fifty eyes of 46 patients who underwent pterygium surgery were included in the present study and divided into 2 groups according to pterygium size (small group: size ≤ 2.0 mm, large group: size > 2.0 mm). Corneal HOAs using wavefront aberrometer (KR-1W®) and corneal astigmatism using topography (Orbscan II®) were evaluated before surgery and their changes monitored after surgery at postoperative 1 week, 1 month, and 3 months.
Results
The small group was comprised of 16 eyes and 34 eyes were included in the large group. In the small group, uncorrected visual acuity (UCVA), best corrected visual acuity (BVCA), and spherical equivalent (SE) were not statistically significantly different after surgery at postoperative 3 months. In the large group, BVCA was not statistically significantly different, but UCVA increase and SE decrease were statistically significant after surgery at postoperative 3 months. Preoperative simulated keratometric (Sim K) astigmatism and corneal HOAs increase were statistically significant according to the pterygium size. Preoperative corneal HOAs of the large group were significantly higher than the small group except for spherical aberration in the central 4 mm optical zone (p = 0.501). In the small group, there was no statistically significant difference in corneal HOAs before and after surgery. In the large group, corneal total HOAs, trefoil and coma in the central 4 mm and 6 mm zone were statistically significantly decreased at postoperative 1 week, 1 month, and 3 months, re-spectively (p < 0.05).
Conclusions
The corneal HOAs and the corneal astigmatism were increased according to pterygium size. In cases with pterygium greater than 2.0 mm in size, the corneal HOAs and the corneal astigmatism were decreased after pterygium surgery which can improve visual acuity and quality. Therefore, the pterygium size can be a useful factor in deciding when to perform pterygium surgery.
Go to : 
References
1. Qais A, Sugar Farjo Alan, Yanoff M, Duker JS. Ophthalmology. 3rd ed.Mosby Elsevier;chap. 4. 2008. 9:p. 248–50.
2. Hansen A, Norn M.Astigmatism and surface phenomena in pterygium. Acta Ophthalmol (Copenh). 1980; 58:174–81.

3. Lin A, Stern G.Correlation between pterygium size and induced corneal astigmatism. Cornea. 1998; 17:28–30.

4. Fong KS, Balakrishnan V, Chee SP, Tan DT.Refractive change following pterygium surgery. CLAO J. 1998; 24:115–7.
5. Tomidokoro A, Oshika T, Amano S. . Quantitative analysis of regular and irregular astigmatism induced by pterygium. Cornea. 1999; 18:412–5.

6. Tomidokoro A, Miyata K, Sakaguchi Y. . Effects of pterygium on corneal spherical power and astigmatism. Ophthalmology. 2000; 107:1568–71.

7. Bedrossian RH.The effects of pterygium surgery on refraction and corneal curvature. Arch Ophthalmol. 1960; 64:553–7.

8. Pesudovs K, Figueiredo FC.Corneal first surface wavefront aber-rations before and after pterygium surgery. J Refract Surg. 2006; 22:921–5.

9. Gumus K, Erkilic K, Topaktas D, Colin J. Effect of pterygia on re-fractive indices, corneal topography, and ocular aberrations. Cornea. 2011; 30:24–9.

10. Gumus K, Topaktas D, Göktaş A. . The change in ocular high-er-order aberrations after pterygium excision with conjunctival autograft: a 1-year prospective clinical trial. Cornea. 2012; 31:1428–31.
11. Yagmur M, Ozcan AA, Sari S, Ersöz TR.Visual acuity and corneal topographic changes related with pterygium surgery. J Refract Surg. 2005; 21:166–70.

12. Yilmaz S, Yuksel T, Maden A.Corneal topographic changes after four types of pterygium surgery. J Refract Surg. 2008; 24:160–5.

13. Cinal A, Yasar T, Demirok A, Topuz H.The effect of pterygium surgery on corneal topography. Ophthalmic Surg Lasers. 2001; 32:35–40.

14. Bahar I, Loya N, Weinberger D, Avisar R.Effect of pterygium sur-gery on corneal topography: a prospective study. Cornea. 2004; 23:113–7.
Go to : 
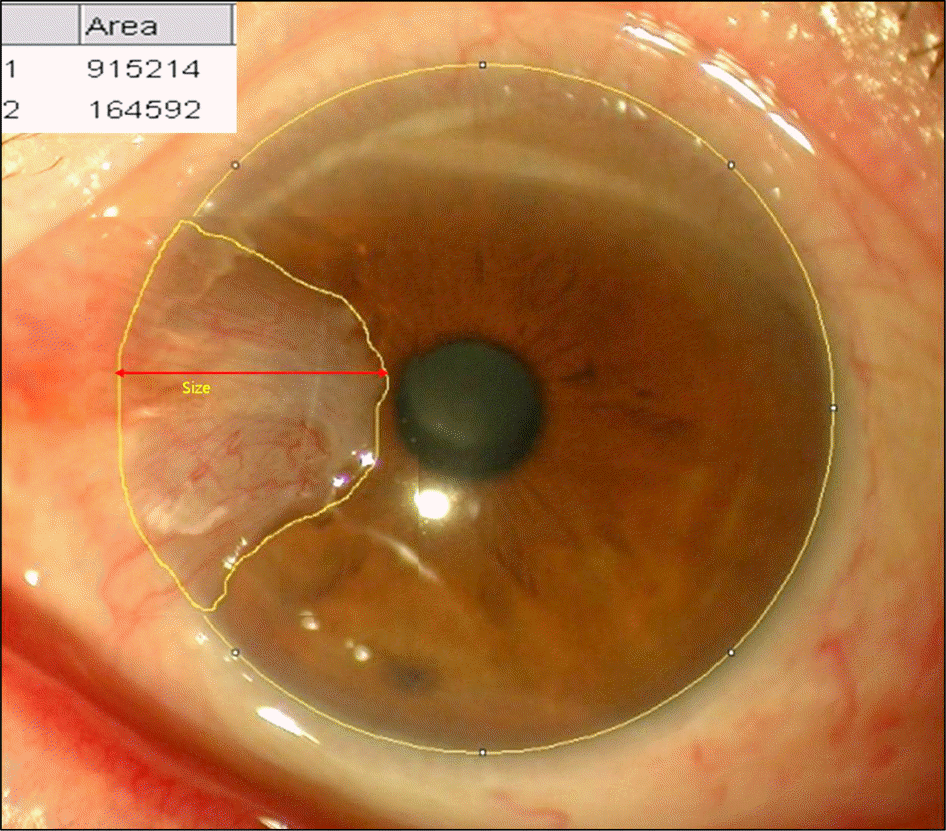
 | Figure 1.Pterygium size was measured at the slit lamp with the eye in the primary position and the area was calculated by image J program. |
 | Figure 2.Mean SE (D), UCVA and BCVA (Snellen chart) changes at 3 months after surgery. (A) Small pterygium group, (B) Large pterygium group. * SE showed statistically significant decrease and UCVA showed statistically significant increase at 3 months after surgery (p = 0.035, p = 0.008 by paired t-test). D = diopter; UCVA = uncorrected visual acuity; BCVA = best corrected visual acuity; SE = spherical equivalent. |
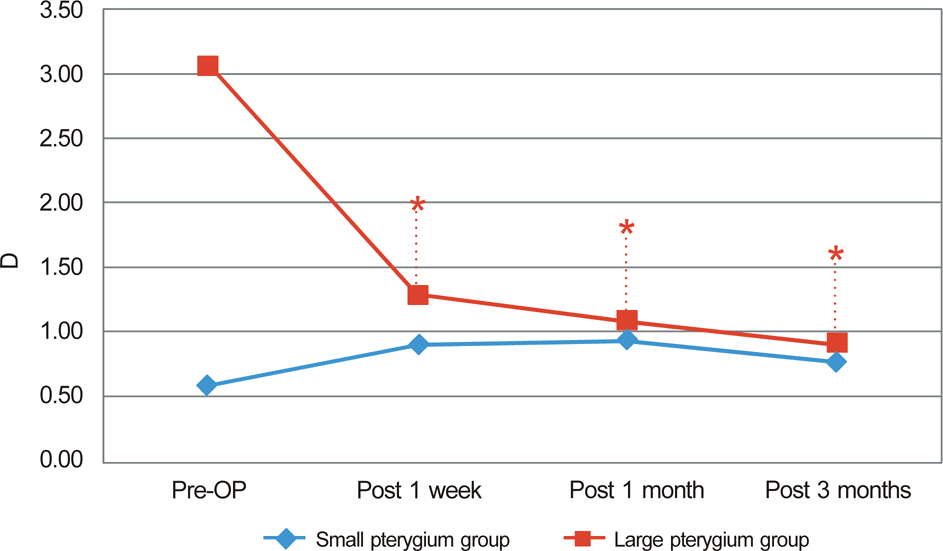
 | Figure 3.The mean change of Sim K (Simulated Keratometry) astigmatism. * There were significant decrease in Sim K astigmatism at 1 week, 1 month, and 3 months after surgery in large pterygium group (p = 0.015, p = 0.005, p = 0.002 by Paired t-test). D = diopter. |
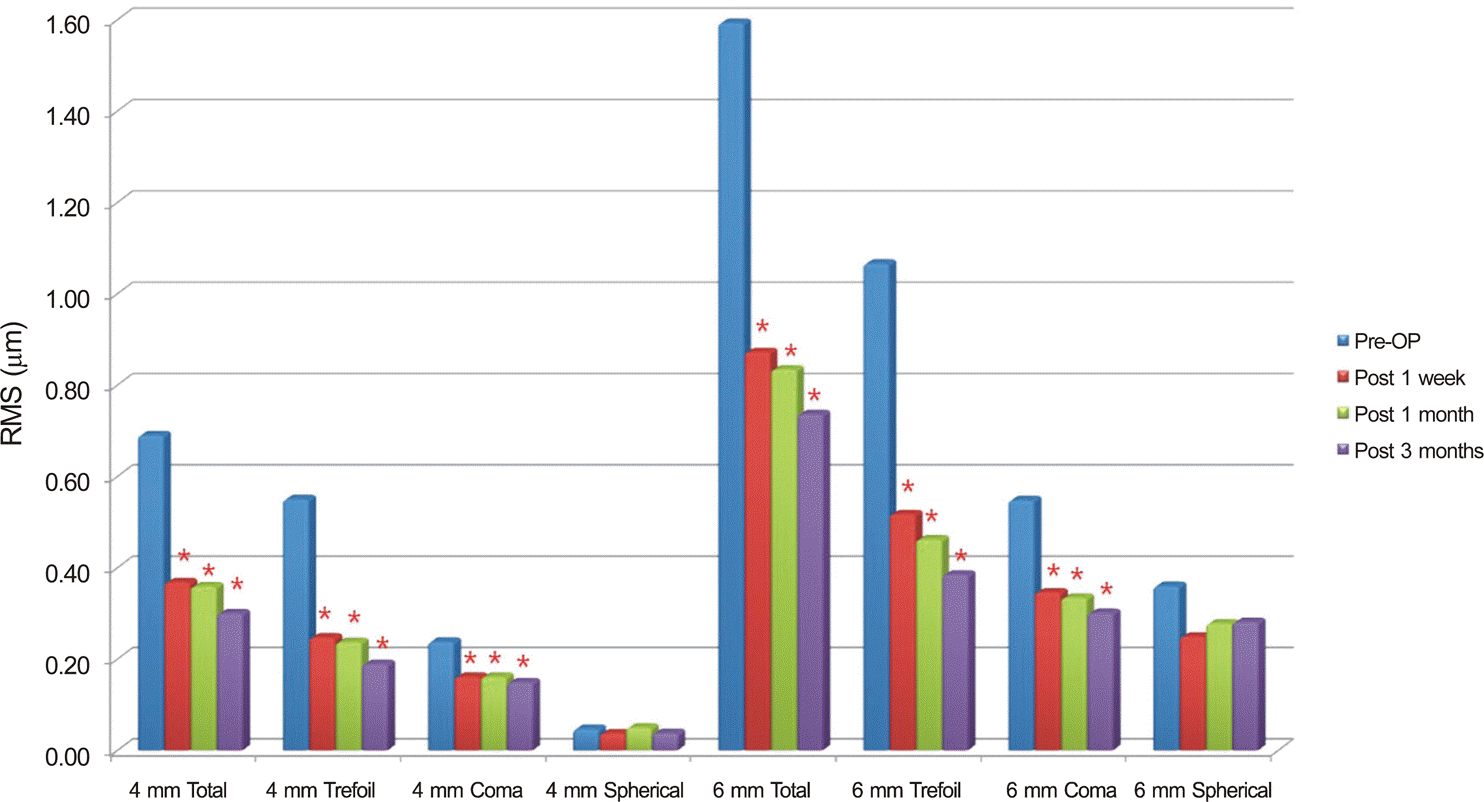
 | Figure 4.The changes of mean corneal higher-order aberrations at 1 week, 1 month, and 3 months after surgery in large pterygium group. * Corneal total, trefoil, and coma HOAs in the central 4 mm & 6 mm zone were statistically significantly decreased at 1 week, 1 month, and 3 months compared with those before surgery (p < 0.05 by Paired t-test, respectively). |
Table 1.
Baseline characteristics
| Small pterygium group (n = 16) | Large pterygium group (n = 34) | p-value* (p < 0.05) | |
|---|---|---|---|
| Sex (M/F) | 10/6 | 16/18 | 0.238 |
| Age (years) | 62.3 ± 12.96 | 64.2 ± 9.63 | 0.592 |
| Size (mm) | 1.68 ± 0.31 | 3.70 ± 0.99 | <0.001† |
| Area (mm2) | 5.02 ± 1.37 | 14.96 ± 4.31 | <0.001† |
| UCVA | 0.82 ± 0.24 | 0.53 ± 0.33 | 0.007† |
| BCVA | 0.85 ± 0.25 | 0.76 ± 0.28 | 0.309 |
| SE (D) | 0.72 ± 0.88 | 0.71 ± 1.59 | 0.975 |
| Sim K astigmatism (D) | -0.58 ± 0.28 | -3.05 ± 2.60 | <0.001† |
Table 2.
Correlation between the corneal higher-order aberrations and the size of the pterygium before surgery
| Correlation (r) | p-value (p < 0.05) | |
|---|---|---|
| Mean Sim K astigmatism (D) | 0.681 | <0.001* |
| 4 mm Total (μm) | 0.628 | <0.001* |
| 4 mm Trefoil (μm) | 0.583 | <0.001* |
| 4 mm Coma (μm) | 0.421 | 0.003* |
| 4 mm Spherical (μm) | 0.125 | 0.402 |
| 6 mm Total (μm) | 0.641 | <0.001* |
| 6 mm Trefoil (μm) | 0.528 | <0.001* |
| 6 mm Coma (μm) | 0.368 | 0.011* |
| 6 mm Spherical (μm) | 0.409 | 0.004* |
* Sim K astigmatism was statistically significantly increased according to the size of pterygium before surgery. Corneal total HOAs, trefoil, coma in the central 4 mm & 6 mm zone and spherical in the central 6 mm zone were statistically significantly increased according to the size of pterygium before surgery.
Table 3.
Comparison of the corneal higher-order aberrations between small and large pterygium group before surgery
| Small pterygium group | Large pterygium group | p-value* (p < 0.05) | |
|---|---|---|---|
| 4 mm Total (μm) | 0.244 ± 0.098 | 0.690 ± 0.418 | <0.001† |
| 4 mm Trefoil (μm) | 0.140 ± 0.092 | 0.550 ± 0.396 | <0.001† |
| 4 mm Coma (μm) | 0.149 ± 0.080 | 0.238 ± 0.148 | 0.012† |
| 4 mm Spherical (μm) | 0.032 ± 0.040 | 0.047 ± 0.104 | 0.501 |
| 6 mm Total (μm) | 0.728 ± 0.271 | 1.593 ± 0.669 | <0.001† |
| 6 mm Trefoil (μm) | 0.373 ± 0.232 | 1.066 ± 0.594 | <0.001† |
| 6 mm Coma (μm) | 0.382 ± 0.206 | 0.548 ± 0.280 | 0.033† |
| 6 mm Spherical (μm) | 0.245 ± 0.114 | 0.360 ± 0.261 | 0.041† |
Table 4.
Mean simulated keratometry astigmatism according to the size of the pterygium before surgery
| Size (mm) | No. of eyes | Astigmatism (D) | p-value* (p < 0.05) |
|---|---|---|---|
| A: ≤2.0 | 16 | -0.59 ± 0.28 | |
| B: >2.0-≤3.0 | 9 | -1.58 ± 1.183 | A-B 0.025† |
| C: >3.0-≤4.0 | 14 | -2.70 ± 2.46 | B-C 0.224 |
| D: >4.0 | 11 | -4.71 ± 2.85 | C-D 0.058 |
| Total | 50 | -2.37 ± 2.47 |
Table 5.
The changes of corneal higher-order aberrations before and after surgery in small pterygium group
| Pre-op | 1 week | 1 week p-value* | 1 month | 1 month p-value* | 3 months | 3 months p-value* | |
|---|---|---|---|---|---|---|---|
| 4 mm total (μm) | 0.244 ± 0.098 | 0.287 ± 0.085 | 0.236 | 0.245 ± 0.109 | 0.968 | 0.244 ± 0.100 | 0.884 |
| 4 mm trefoil (μm) | 0.140 ± 0.092 | 0.163 ± 0.092 | 0.587 | 0.151 ± 0.123 | 0.778 | 0.140 ± 0.100 | 0.996 |
| 4 mm coma (μm) | 0.149 ± 0.080 | 0.146 ± 0.071 | 0.937 | 0.127 ± 0.071 | 0.424 | 0.142 ± 0.073 | 0.561 |
| 4 mm spherical (μm) | 0.032 ± 0.040 | 0.017 ± 0.064 | 0.273 | 0.043 ± 0.055 | 0.456 | 0.032 ± 0.051 | 0.775 |
| 6 mm total (μm) | 0.728 ± 0.271 | 0.635 ± 0.200 | 0.124 | 0.613 ± 0.134 | 0.093 | 0.604 ± 0.173 | 0.088 |
| 6 mm trefoil (μm) | 0.373 ± 0.232 | 0.305 ± 0.215 | 0.275 | 0.284 ± 0.188 | 0.127 | 0.245 ± 0.163 | 0.055 |
| 6 mm coma (μm) | 0.382 ± 0.206 | 0.302 ± 0.195 | 0.354 | 0.261 ± 0.192 | 0.131 | 0.311 ± 0.146 | 0.263 |
| 6 mm spherical (μm) | 0.245 ± 0.114 | 0.213 ± 0.135 | 0.388 | 0.241 ± 0.113 | 0.918 | 0.222 ± 0.154 | 0.816 |
Table 6.
The change of corneal higher-order aberrations before and after surgery in large pterygium group
| Pre-op | 1 week | 1 week p-value* | 1 month | 1 month p-value* | 3 months | 3 months p-value* | |
|---|---|---|---|---|---|---|---|
| 4 mm total (μm) | 0.690 ± 0.418 | 0.368 ± 0.179 | <0.001† | 0.359 ± 0.204 | <0.001† | 0.300 ± 0.161 | <0.001† |
| 4 mm trefoil (μm) | 0.550 ± 0.396 | 0.247 ± 0.158 | <0.001† | 0.237 ± 0.203 | <0.001† | 0.189 ± 0.139 | <0.001† |
| 4 mm coma (μm) | 0.238 ± 0.148 | 0.161 ± 0.089 | 0.002† | 0.161 ± 0.086 | 0.001† | 0.149 ± 0.084 | 0.001† |
| 4 mm spherical (μm) | 0.047 ± 0.104 | 0.037 ± 0.086 | 0.650 | 0.050 ± 0.070 | 0.883 | 0.038 ± 0.062 | 0.709 |
| 6 mm total (μm) | 1.593 ± 0.669 | 0.872 ± 0.345 | <0.001† | 0.834 ± 0.356 | <0.001† | 0.736 ± 0.338 | <0.001† |
| 6 mm trefoil (μm) | 1.066 ± 0.594 | 0.517 ± 0.318 | <0.001† | 0.462 ± 0.336 | <0.001† | 0.385 ± 0.279 | <0.001† |
| 6 mm coma (μm) | 0.548 ± 0.280 | 0.346 ± 0.164 | <0.001† | 0.334 ± 0.171 | <0.001† | 0.301 ± 0.151 | <0.001† |
| 6 mm spherical (μm) | 0.360 ± 0.261 | 0.249 ± 0.195 | 0.081 | 0.278 ± 0.162 | 0.123 | 0.281 ± 0.148 | 0.065 |


 PDF
PDF ePub
ePub Citation
 Print
Print


 XML Download