Abstract
Purpose
This study was carried out to evaluate the postural intraocular pressure (IOP) change in Trendelenburg, reverse Trendelenburg, and supine positions in healthy young males.
Methods
We measured the IOP values of 5 healthy young male volunteers (10 eyes) using an Icare PRO rebound tonometer in sitting, Trendelenburg, reverse Trendelenburg, and supine positions.
Go to : 
References
1. Heijl A, Leske MC, Bengtsson B. et al. Early Manifest Glaucoma Trial Group. Reduction of intraocular pressure and glaucoma pro-gression: results from the Early Manifest Glaucoma Trial. Arch Ophthalmol. 2002; 120:1268–79.
2. Kass MA, Heuer DK, Higginbotham EJ. . The Ocular Hypertension Treatment Study: a randomized trial determines that topical ocular hypotensive medication delays or prevents the onset of primary open-angle glaucoma. Arch Ophthalmol. 2002; 120:701–13. dis-cussion 829-30.
3. Lee JY, Yoo C, Jung JH. . The effect of lateral decubitus posi-tion on intraocular pressure in healthy young subjects. Acta Ophthalmol. 2012; 90:e68–72.

4. Lee JY, Yoo C, Kim YY.The effect of lateral decubitus position on intraocular pressure in patients with untreated open-angle glaucoma. Am J Ophthalmol. 2013; 155:329–35.e2.

5. Tsukahara S, Sasaki T.Postural change of IOP in normal persons and in patients with primary wide open-angle glaucoma and low-tension glaucoma. Br J Ophthalmol. 1984; 68:389–92.

6. Carlson KH, McLaren JW, Topper JE, Brubaker RF.Effect of body position on intraocular pressure and aqueous flow. Invest Ophthalmol Vis Sci. 1987; 28:1346–52.
7. Gartner S, Beck W.Ocular tension in the trendelenburg position. Am J Ophthalmol. 1965; 59:1040–3.
8. Lee K, Lee JY, Moon JI, Park MH.Comparison of icare rebound tonometer with goldmann applanation tonometry. J Korean Ophthalmol Soc. 2013; 54:296–302.

9. Lee JS, Kim CM, Choi HY, Oum BS.A relationship between intra-ocular pressure and age and body mass index in a Korean population. J Korean Ophthalmol Soc. 2003; 44:1559–66.
10. Anderson DR, Grant WM.The influence of position on intraocular pressure. Invest Ophthalmol. 1973; 12:204–12.
11. Martinez-de-la-Casa JM, Garcia-Feijoo J, Castillo A, Garcia-Sanchez J.Reproducibility and clinical evaluation of rebound tonometry. Invest Ophthalmol Vis Sci. 2005; 46:4578–80.

12. Awad H, Santilli S, Ohr M. . The effects of steep trendelenburg positioning on intraocular pressure during robotic radical pros- tatectomy. Anesth Analg. 2009; 109:473–8.
13. Weber ED, Colyer MH, Lesser RL, Subramanian PS.Posterior is-chemic optic neuropathy after minimally invasive prostatectomy. J Neuroophthalmol. 2007; 27:285–7.

Go to : 
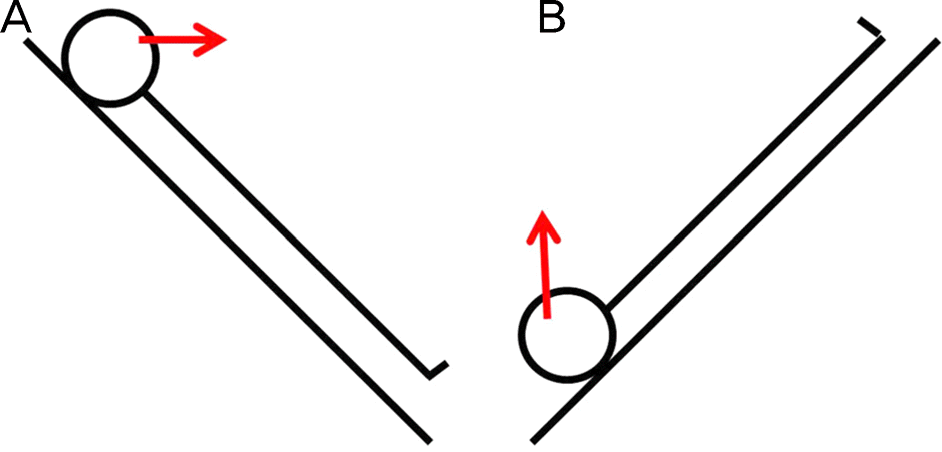
 | Figure 1.Illustration of experimental positions. Reverse Trend- enlenburg position (T3, 4, 5, 6) (A) and Trendelenburg pos-iton (T8, 9, 10) (B). Red arrow indicates the direction of patient's eyes. |
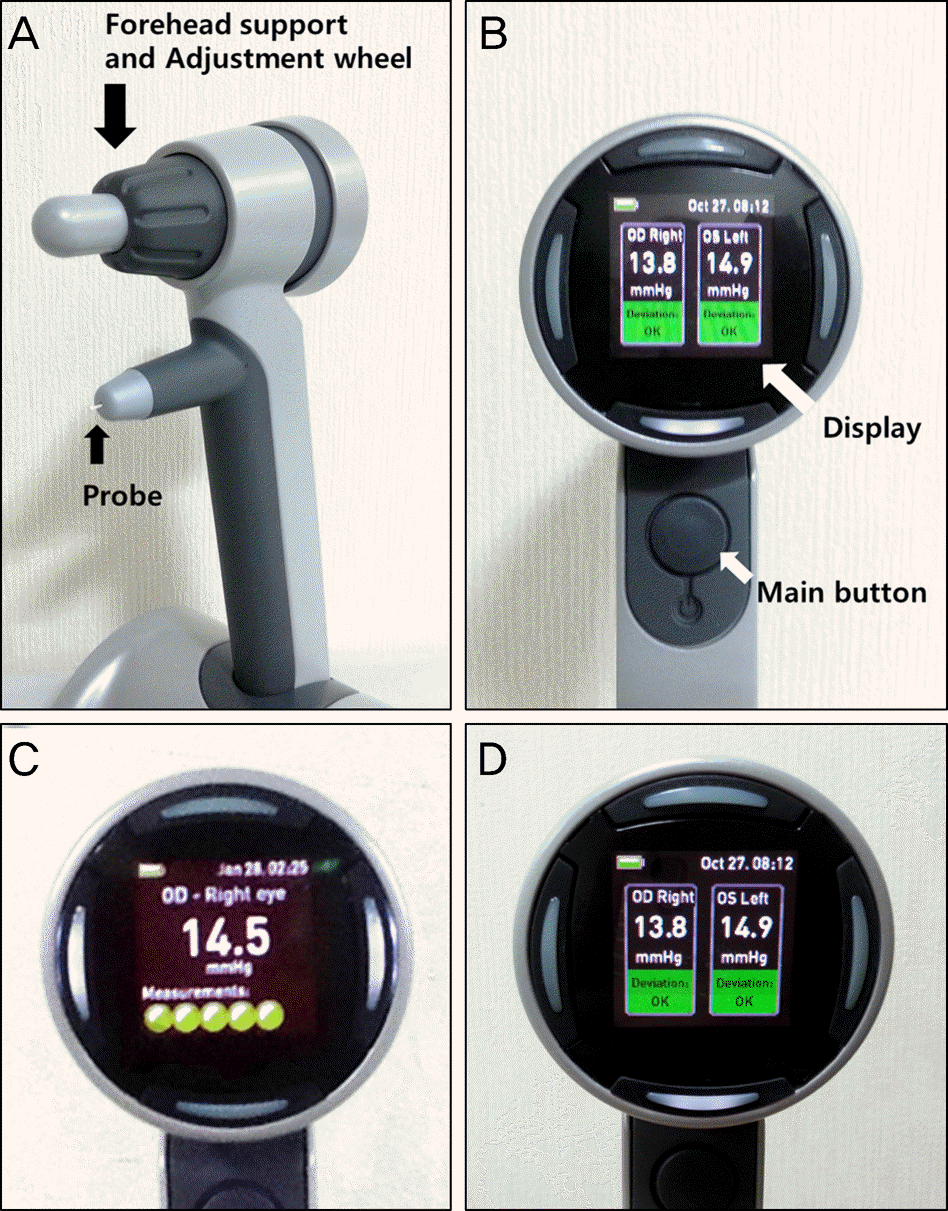
 | Figure 2.Icare PRO rebound tonometer (Icare® PRO; Icare Finland Oy, Helsinki, Finland) Front view (A) and rear view (B) of Icare PRO, (C) display during measuring IOP, (D) display after measuring IOP, showing reliability below IOP. IOP = intraocular pressure. |
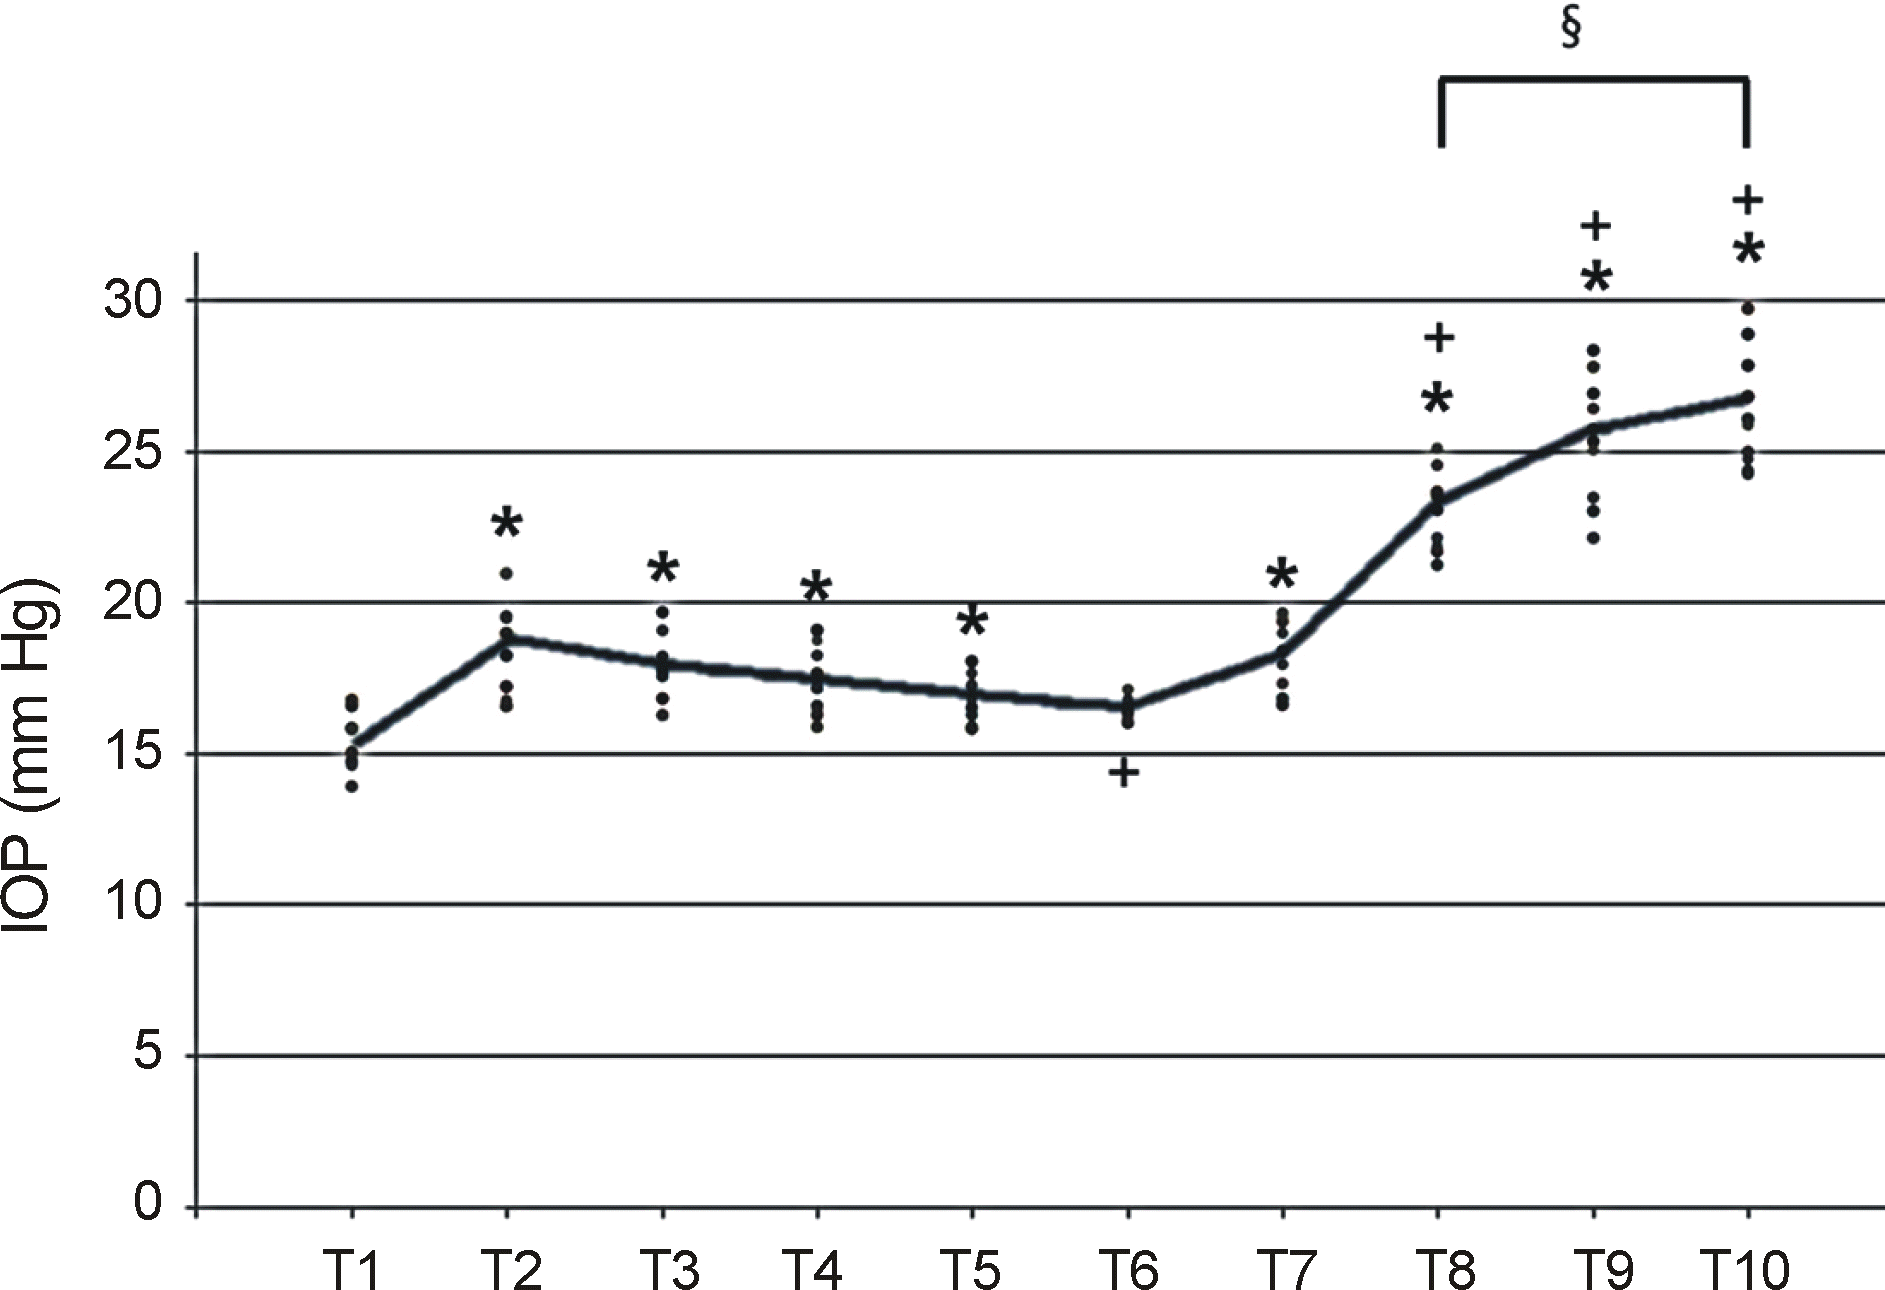
 | Figure 3.Scatter plot of the IOP with the overlaid line con-necting the mean IOP at each time point. IOP = intraocular pressure; T1 = Sitting; T2 = 10 minutes after supine position; T3 = 10 minutes after reverse Trendelenburg position; T4 = 20 minutes after reverse Trendelenburg position; T5 = 30 minutes after reverse Trendelenburg position; T6 = 60 minutes after reverse Trendelenburg position; T7 = 10 minutes after supine position; T8 = 10 minutes after Trendelenburg position; T9 = 20 minutes after Trendelenburg position; T10 = 30 minutes after Trendelenburg position. * Indicates significant difference compared to T1 (p < 0.05, Tahame’s test). † Indicates significant difference compared to T2 (p < 0.05, Tahame’s test). ‡Indicates significant difference between T8 and T10 (p < 0.05, Tahame’s test). |
Table 1.
T1-T10 Time points of measurement and mean intraocular pressure of each time point


 PDF
PDF ePub
ePub Citation
 Print
Print


 XML Download