

 PDF
PDF ePub
ePub Citation
 Print
Print


Abstract
Purpose
To analyze the optical coherence tomographic patterns and clinical courses of patients with diabetic macular edema (DME) after treatment.
Methods
The charts of 65 patients with DME were retrospectively reviewed. Baseline optical coherence tomographic patterns of DME were categorized into the 4 groups: group 1 (9 eyes, 13.8%) showed diffuse retinal thickening, group 2 (21 eyes, 32.3%) had cystoid macular edema (CME), group 3 (13 eyes, 20.0%) demonstrated serous retinal detachment (SRD) and group 4 (22 eyes, 33.9%) had combined CME and SRD. Treatments for DME included intravitreal bev-acizumab/triamcinolone injection, focal laser photocoagulation and vitrectomy. During 12 months of follow-up, changes in the patterns of DME were assessed. Additionally, the central retinal thickness (CRT) and best-corrected visual acuity (BCVA) were measured at baseline, 6 and 12 months.
Results
During 12 months of follow-up, 21 eyes (32.3%) showed changes in the DME pattern: 2 eyes (22.2%) in group 1, 3 (14.3%) in group 2, 4 (30.8%) in group 3 and 12 (54.5%) in group 4. A significantly greater proportion of eyes with changes in DME pattern underwent vitrectomy compared with those without changes in DME pattern (p = 0.012). There was a significant difference in CRT among the 4 groups; group 4 demonstrated the largest CRT at baseline, 6 and 12 months (p < 0.001, 0.002 and 0.029, respectively). However, there were no significant differences in BCVA among the 4 groups at baseline, 6 or 12 months (p = 0.879, 0.375 and 0.246, respectively).
Conclusions
Clinical courses varied according to the tomographic patterns of DME after treatment, and the poorest ana-tomic outcome was found in group 4. Change in tomographic pattern of DME was correlated with the treatment of DME, which might suggest a poorer outcome in those patients than in the patients who maintained their DME patterns.
References
1. Jonas JB, Kreissig I, Söfker A, Degenring RF.Intravitreal injection of triamcinolone for diffuse diabetic macular edema. Arch Ophthalmol. 2003; 121:57–61.

2. Martidis A, Duker JS, Greenberg PB. . Intravitreal triamcinolone for refractory diabetic macular edema. Ophthalmology. 2002; 109:920–7.
3. Lai WW, Mohamed S, Lam DS.Improvement of visual acuity in eyes with diabetic macular edema after treatment with pars plana vitrectomy. Ophthalmologica. 2005; 219:189.
4. Recchia FM, Ruby AJ, Carvalho Recchia CA. Pars plana vi-trectomy with removal of the internal limiting membrane in the treatment of persistent diabetic macular edema. Am J Ophthalmol. 2005; 139:447–54.
5. Otani T, Kishi S, Maruyama Y.Patterns of diabetic macular edema with optical coherence tomography. Am J Ophthalmol. 1999; 127:688–93.
6. Kang SW, Park CY, Ham DI.The correlation between fluorescein angiographic and optical coherence tomographic features in clin-ically significant diabetic macular edema. Am J Ophthalmol. 2004; 137:313–22.
7. Shimura M, Yasuda K, Yasuda M, Nakazawa T.Visual outcome af-ter intravitreal bevacizumab depends on the optical coherence to-mographic patterns of patients with diffuse diabetic macular edema. Retina. 2013; 33:740–7.
8. Aiello LP, Avery RL, Arrigg PG. . Vascular endothelial growth factor in ocular fluid of patients with diabetic retinopathy and other retinal disorders. N Engl J Med. 1994; 331:1480–7.
9. Shimura M, Yasuda K, Nakazawa T. . Visual outcome after in-travitreal triamcinolone acetonide depends on optical coherence tomographic patterns in patients with diffuse diabetic macular edema. Retina. 2011; 31:748–54.
10. Wu PC, Lai CH, Chen CL, Kuo CN.Optical coherence tomo-graphic patterns in diabetic macula edema can predict the effects of intravitreal bevacizumab injection as primary treatment. J Ocul Pharmacol Ther. 2012; 28:59–64.
11. Kim SH, Park JM.Comparison of intravitreal triamcinolone versus bevacizumab in bilateral diabetic macular edema by optical coher-ence tomography (OCT) patterns. J Korean Ophthalmol Soc. 2010; 51:210–9.
12. Murakami T, Nishijima K, Sakamoto A. . Foveal cystoid spaces are associated with enlarged foveal avascular zone and micro-aneurysms in diabetic macular edema. Ophthalmology. 2011; 118:359–67.
13. Kim YG, Yu SY, Kwak HW.The effect of intravitreal triamcinolone acetonide injection according to the diabetic macular edema type. J Korean Ophthalmol Soc. 2005; 46:84–9.
14. Yoon SC, Lee DY, Nam DH.The effect of intravitreal triamcinolone injection according to the OCT patterns of diabetic macular edema. J Korean Ophthalmol Soc. 2008; 49:1611–8.
15. Jeong YC, Bae SH, Kim JW.Comparison of effects of IVTA and photocoagulation, depending on types of diabetic macular edema. J Korean Ophthalmol Soc. 2007; 48:655–64.
16. Photocoagulation for diabetic macular edema. Early Treatment Diabetic Retinopathy Study report number 1. Early Treatment Diabetic Retinopathy Study research group. Arch Ophthalmol. 1985; 103:1796–806.
17. Yanoff M, Fine BS, Brucker AJ, Eagle RC Jr.Pathology of human cystoid macular edema. Surv Ophthalmol. 1984; 28(Suppl):505–11.
Figure 1.
The optical coherence tomographic patterns of diabetic macular edema. (A) Diffuse retinal thickening without cyst-like cavities, (B) Cystoid macular edema with decreased optical reflectivity in the retinal layer, (C) Serous retinal detachment, (D) Combination of cystoid macular edema and serous retinal detachment.
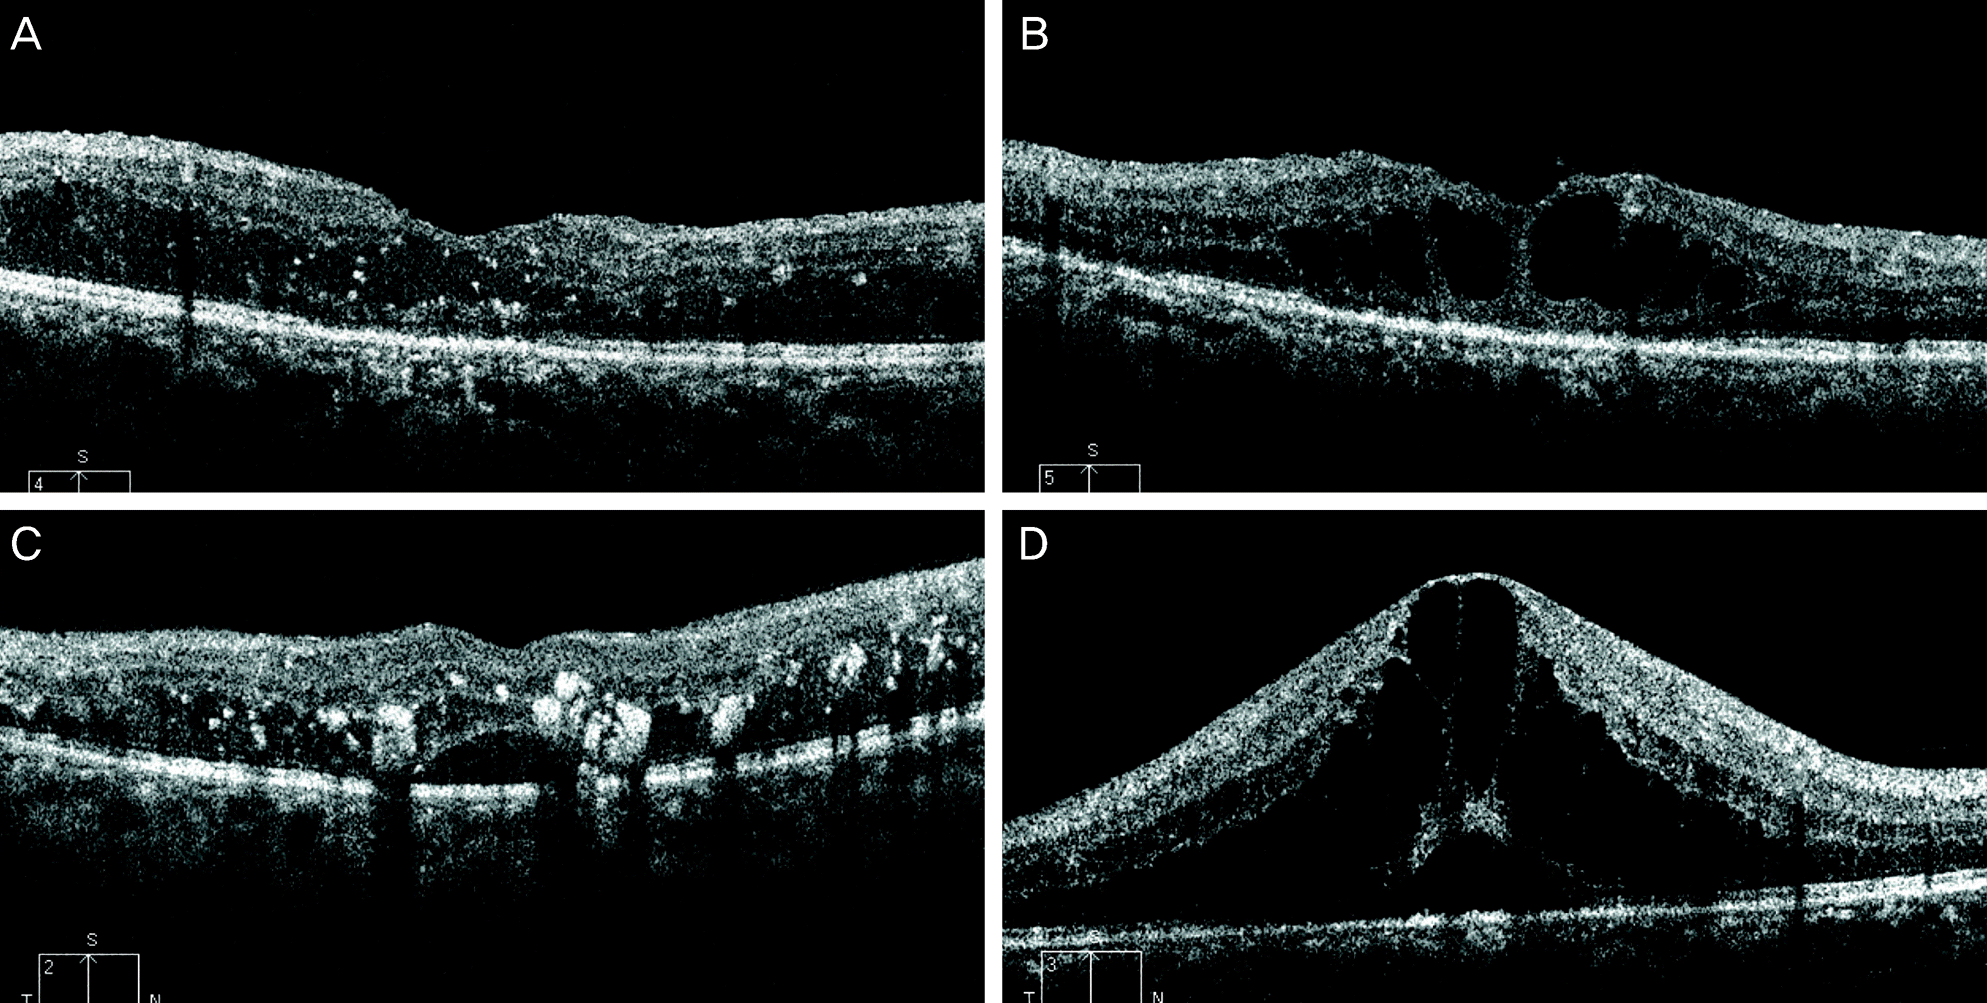
Figure 2.
Changes of central retinal thickness (CRT) according to the optical coherence tomographic patterns of diabetic macular edema. Bars indicate averaged CRT in each group. Error bars indicate standard deviations. Asterisks mean statistically significant difference between parameters (p < 0.05). CME = cystoid macular edema; DRT = diffuse retinal thickening; SRD = serous retinal detachment.
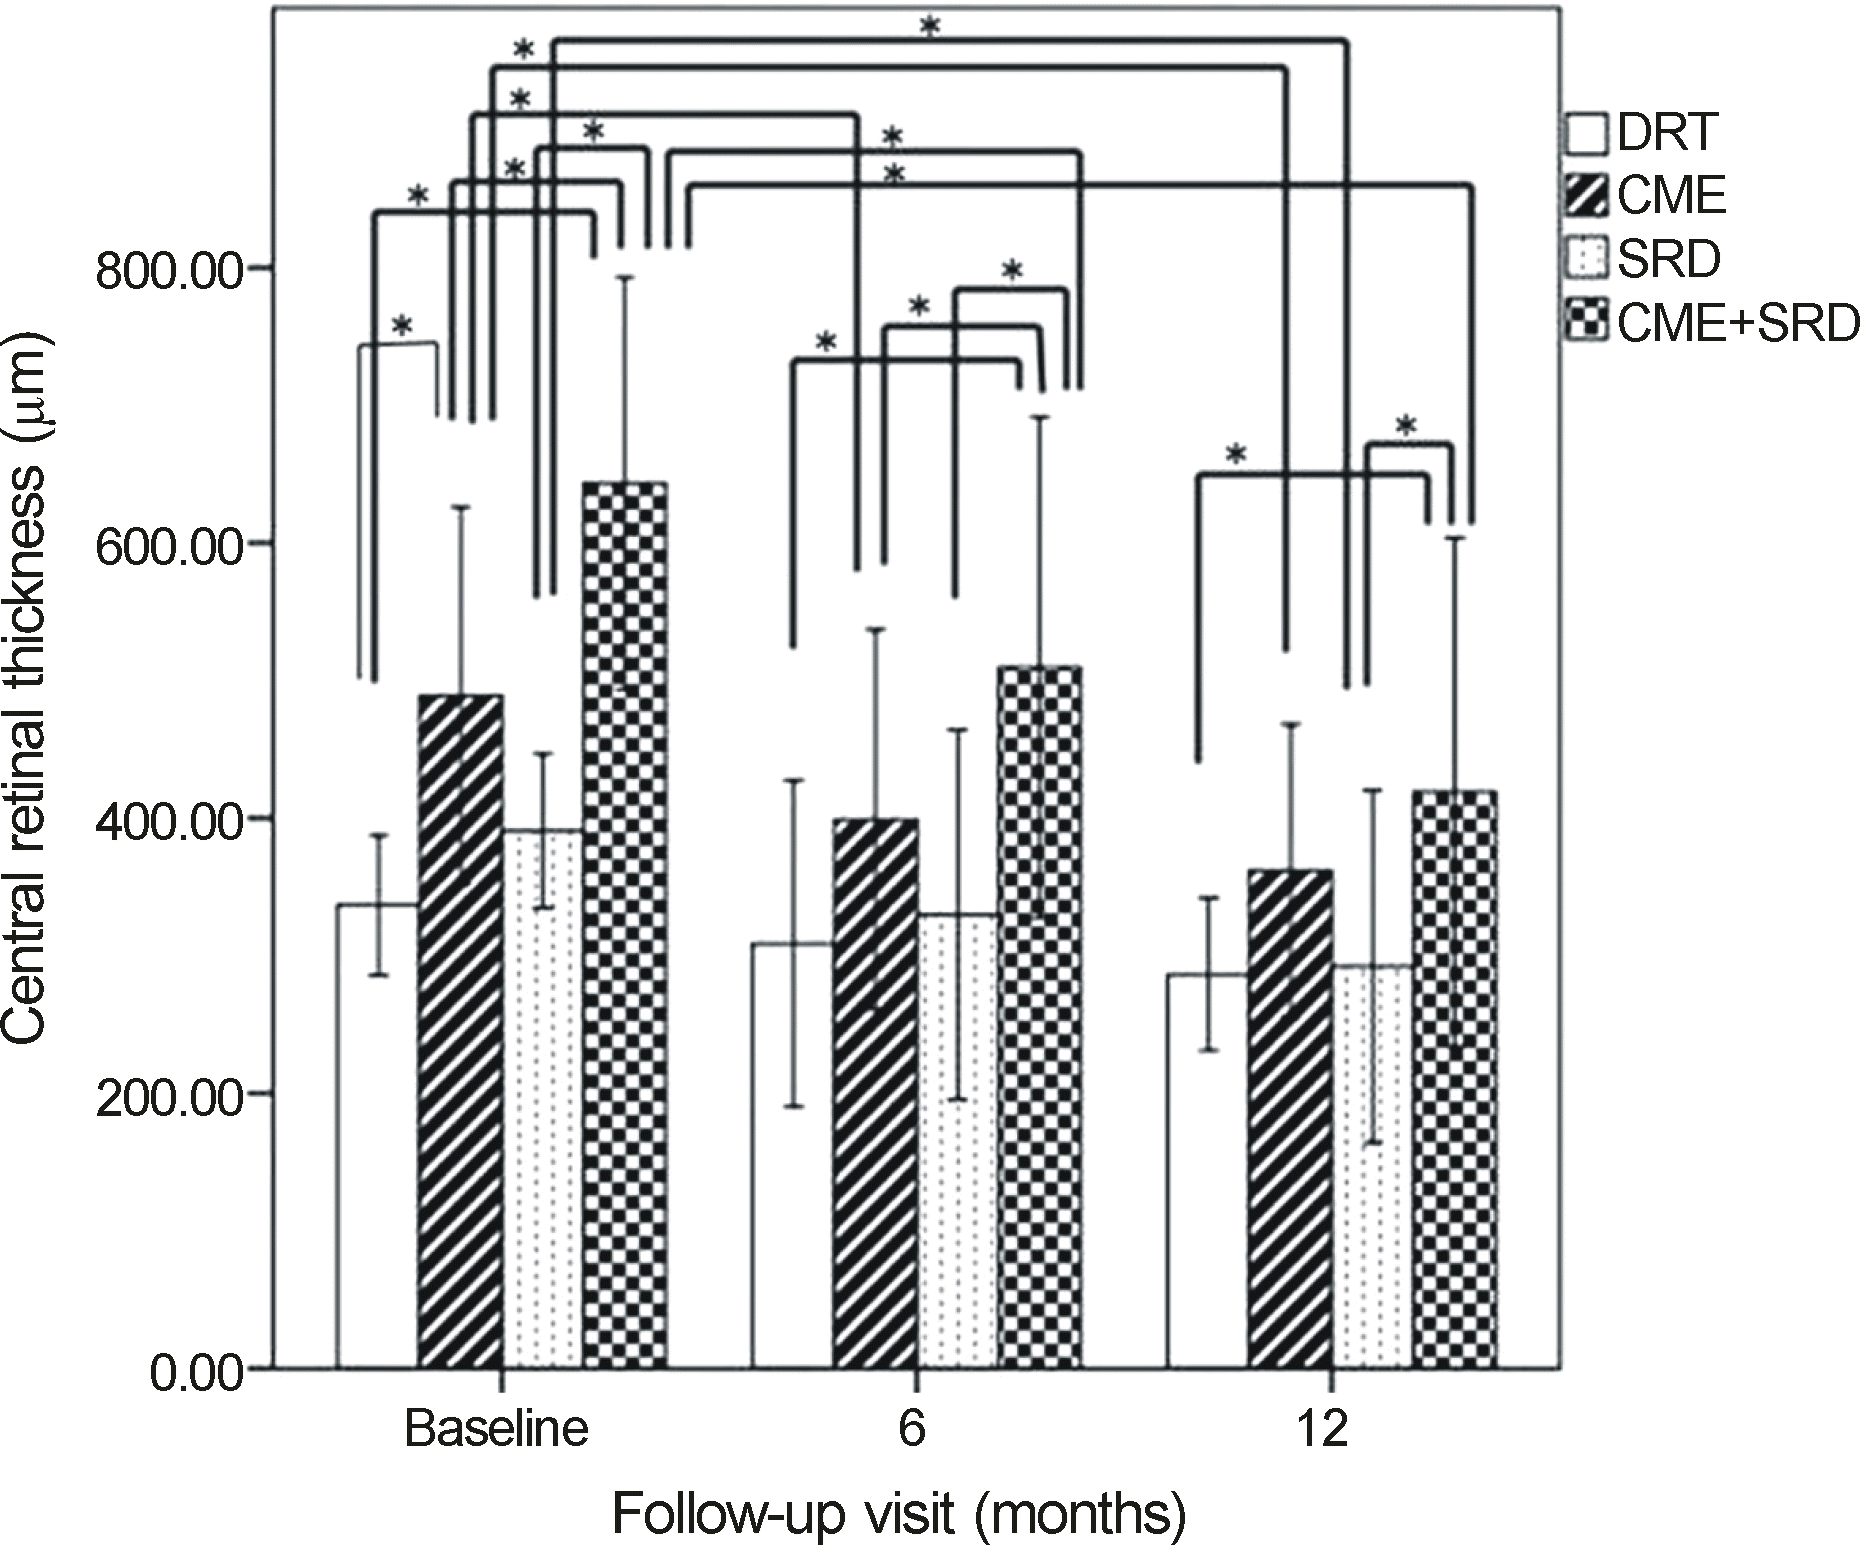
Figure 3.
Changes of best-corrected visual acuity (BCVA) according to the optical coherence tomographic patterns of diabetic macular edema. Bars indicate averaged BCVA in each group. Error bars indicate standard deviations. Asterisk means statistically significant difference between parameters (p < 0.05). CME = cystoid macular edema; DRT = diffuse retinal thickening; SRD = serous retinal detachment.
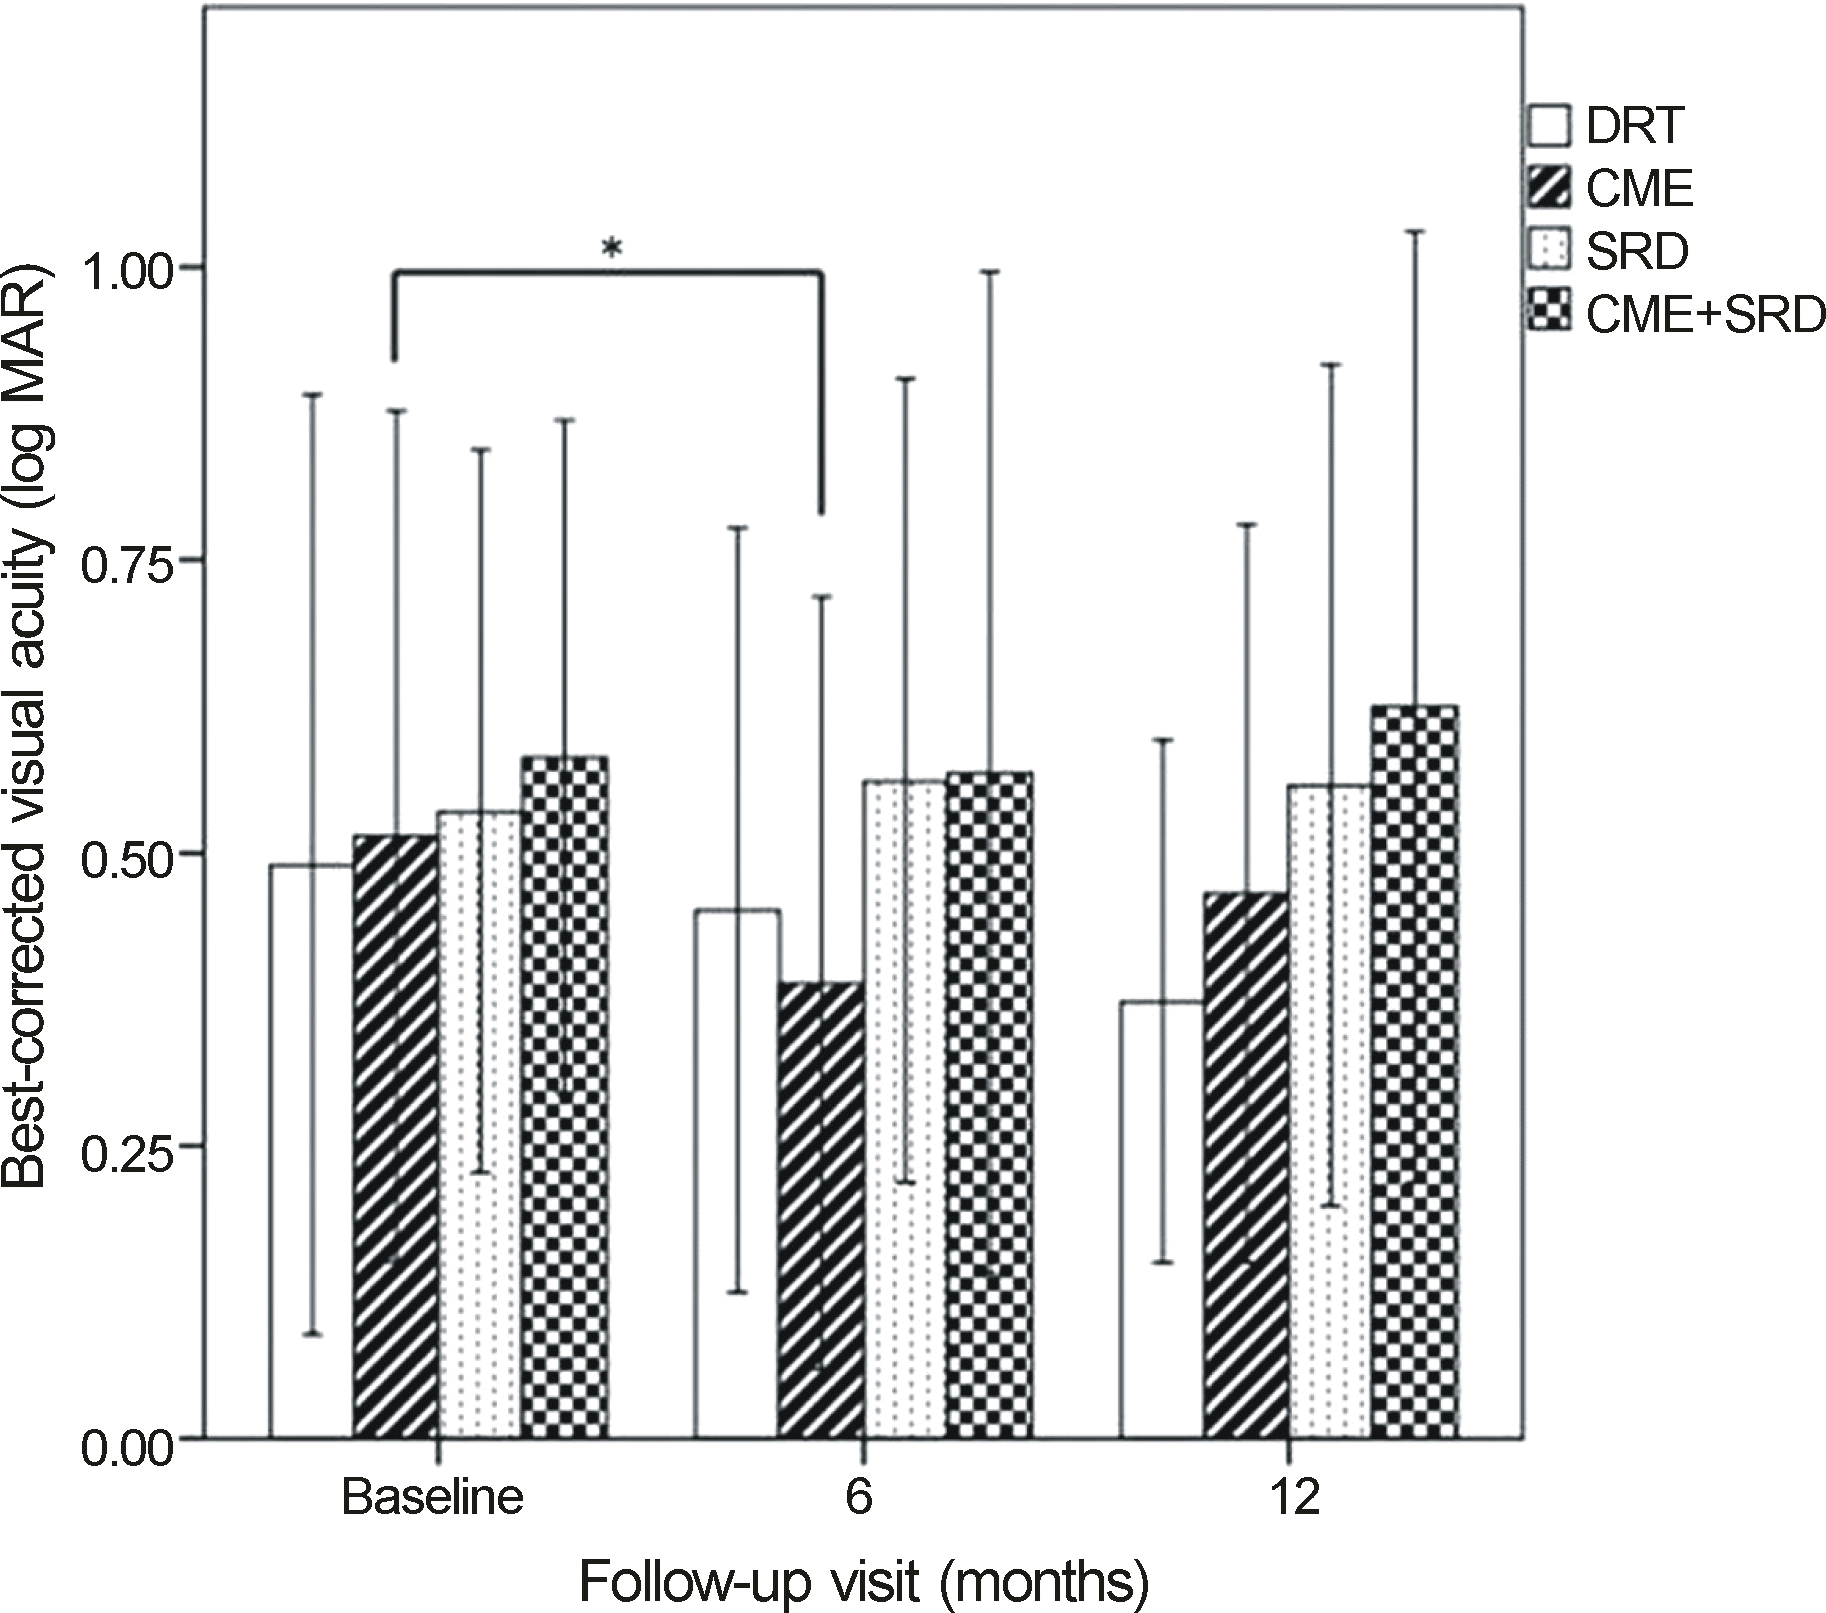
Table 1.
Baseline characteristics according to the optical coherence tomographic patterns of diabetic macular edema
Table 2.
Changes in optical coherence tomographic patterns of diabetic macular edema after treatment
Table 3.
Comparisons of treatment modalities between two groups according to the maintenance of diabetic macular edema pattern using optical coherence tomography
| Maintain (n = 44) | Change (n = 21) | p-value | |
|---|---|---|---|
| Bevacizumab (n*) | 2.7 ± 1.9 | 2.1 ± 1.4 | 0.353 |
| Triamcinolone (n*) | 0.3 ± 0.6 | 0.3 ± 0.6 | 0.962 |
| Focal/grid laser photocoagulation (n*) | 0.2 ± 0.4 | 0.4 ± 0.5 | 0.061 |
| Vitrectomy (n, %)† | 5 (11.4) | 8 (38.1) | 0.012 |
 XML Download