Abstract
Purpose
To evaluate the relationship between the size of internal limiting membrane (ILM) peeling and the elongation of foveal tissue after macular hole (MH) surgery.
Methods
The medical records of 29 patients (29 eyes) who developed elongation of foveal tissue on spectral domain optical coherence tomography (OCT) after vitrectomy with ILM peeling and gas tamponade for idiopathic MH were retrospectively reviewed. These eyes were classified into 3 subgroups by the size of ILM peeling: group A (9 eyes), smaller than 2 disc diameter (DD); group B (12 eyes), larger than 2 DD and within the major temporal vascular arcade, and group C (8 eyes), till the edge of the major temporal vascular arcade. Inter-outer plexiform layer (OPL) distance, representing elongation of foveal tissue, was measured 1, 3, and 6-8 months (only 18 eyes) postoperatively. ‘Asymmetric elongation’ was defined as non-uniform elongation of the foveal tissue in certain directions.
Results
Horizontal/vertical inter-OPL distances 1 month postoperative, in descending order, were: group B, 436.58 ± 88.54 / 404.92 ± 78.55 µm; group A, 421.33 ± 109.97 / 404.14 ± 120.9 µm; and C group, 389.25 ± 48.75 / 400 ± 52.23 µm. Variations in the horizontal/vertical inter-OPL distance 3 months after MH surgery were: group B, 136.83 ± 65.64 / 103.92 ± 73.37 µm; group A, 88.11 ± 41.57 / 75.89 ± 53.18 µm; and group C, 140.25 ± 68.51 / 83.63 ± 56.62 µm. There were no significant differences in inter-OPL distance, variation in inter-OPL distance, or percent asymmetry in both horizontal and vertical directions among these groups.
Go to : 
References
1. Benson WE, Cruickshanks KC, Fong DS, et al. Surgical management of macular holes: a report by the American Academy of Ophthalmology. Ophthalmology. 2001; 108:1328–35.
2. Tognetto D, Grandin R, Sanguinetti G, et al. Internal limiting membrane removal during macular hole surgery: results of a multicenter retrospective study. Ophthalmology. 2006; 113:1401–10.
3. Haritoglou C, Reiniger IW, Schaumberger M, et al. Five-year follow-up of macular hole surgery with peeling of the internal limiting membrane: update of a prospective study. Retina. 2006; 26:618–22.
4. Tranos PG, Ghazi-Nouri SM, Rubin GS, et al. Visual function and subjective perception of visual ability after macular hole surgery. Am J Ophthalmol. 2004; 138:995–1002.

5. Sjaarda RN, Frank DA, Glaser BM, et al. Resolution of an absolute scotoma and improvement of relative scotomata after successful macular hole surgery. Am J Ophthalmol. 1993; 116:129–39.

6. Bottoni F, De Angelis S, Luccarelli S, et al. The dynamic healing process of idiopathic macular holes after surgical repair: a spectral-domain optical coherence tomography study. Invest Ophthalmol Vis Sci. 2011; 52:4439–46.

7. Wakabayashi T, Fujiwara M, Sakaguchi H, et al. Foveal micro-structure and visual acuity in surgically closed macular holes: spectral-domain optical coherence tomographic analysis. Ophthalmology. 2010; 117:1815–24.

8. Christensen UC, Kr⊘yer K, Sander B, et al. Prognostic significance of delayed structural recovery after macular hole surgery. Ophthalmology. 2009; 116:2430–6.

9. Kang SW, Lim JW, Chung SE, Yi CH. Outer foveolar defect after surgery for idiopathic macular hole. Am J Ophthalmol. 2010; 150:551–7.

10. Sano M, Shimoda Y, Hashimoto H, Kishi S. Restored photoreceptor outer segment and visual recovery after macular hole closure. Am J Ophthalmol. 2009; 147:313–8.e1.

11. Imai M, Iijima H, Gotoh T, Tsukahara S. Optical coherence tomography of successfully repaired idiopathic macular holes. Am J Ophthalmol. 1999; 128:621–7.

12. Oh J, Smiddy WE, Flynn HW Jr, et al. Photoreceptor inner/outer segment defect imaging by spectral domain OCT and visual prognosis after macular hole surgery. Invest Ophthalmol Vis Sci. 2010; 51:1651–8.

13. Itoh Y, Inoue M, Rii T, et al. Correlation between length of foveal cone outer segment tips line defect and visual acuity after macular hole closure. Ophthalmology. 2012; 119:1438–46.

Go to : 
 | Figure 1.Classification into 3 subgroups by the size of internal limiting membrane (ILM) peeling. (A) Group A, smaller than 2 DD; (B) group B, larger than 2 DD and within the major temporal vascular arcade, and (C) group C, till the edge of the major temporal vascular arcade. |
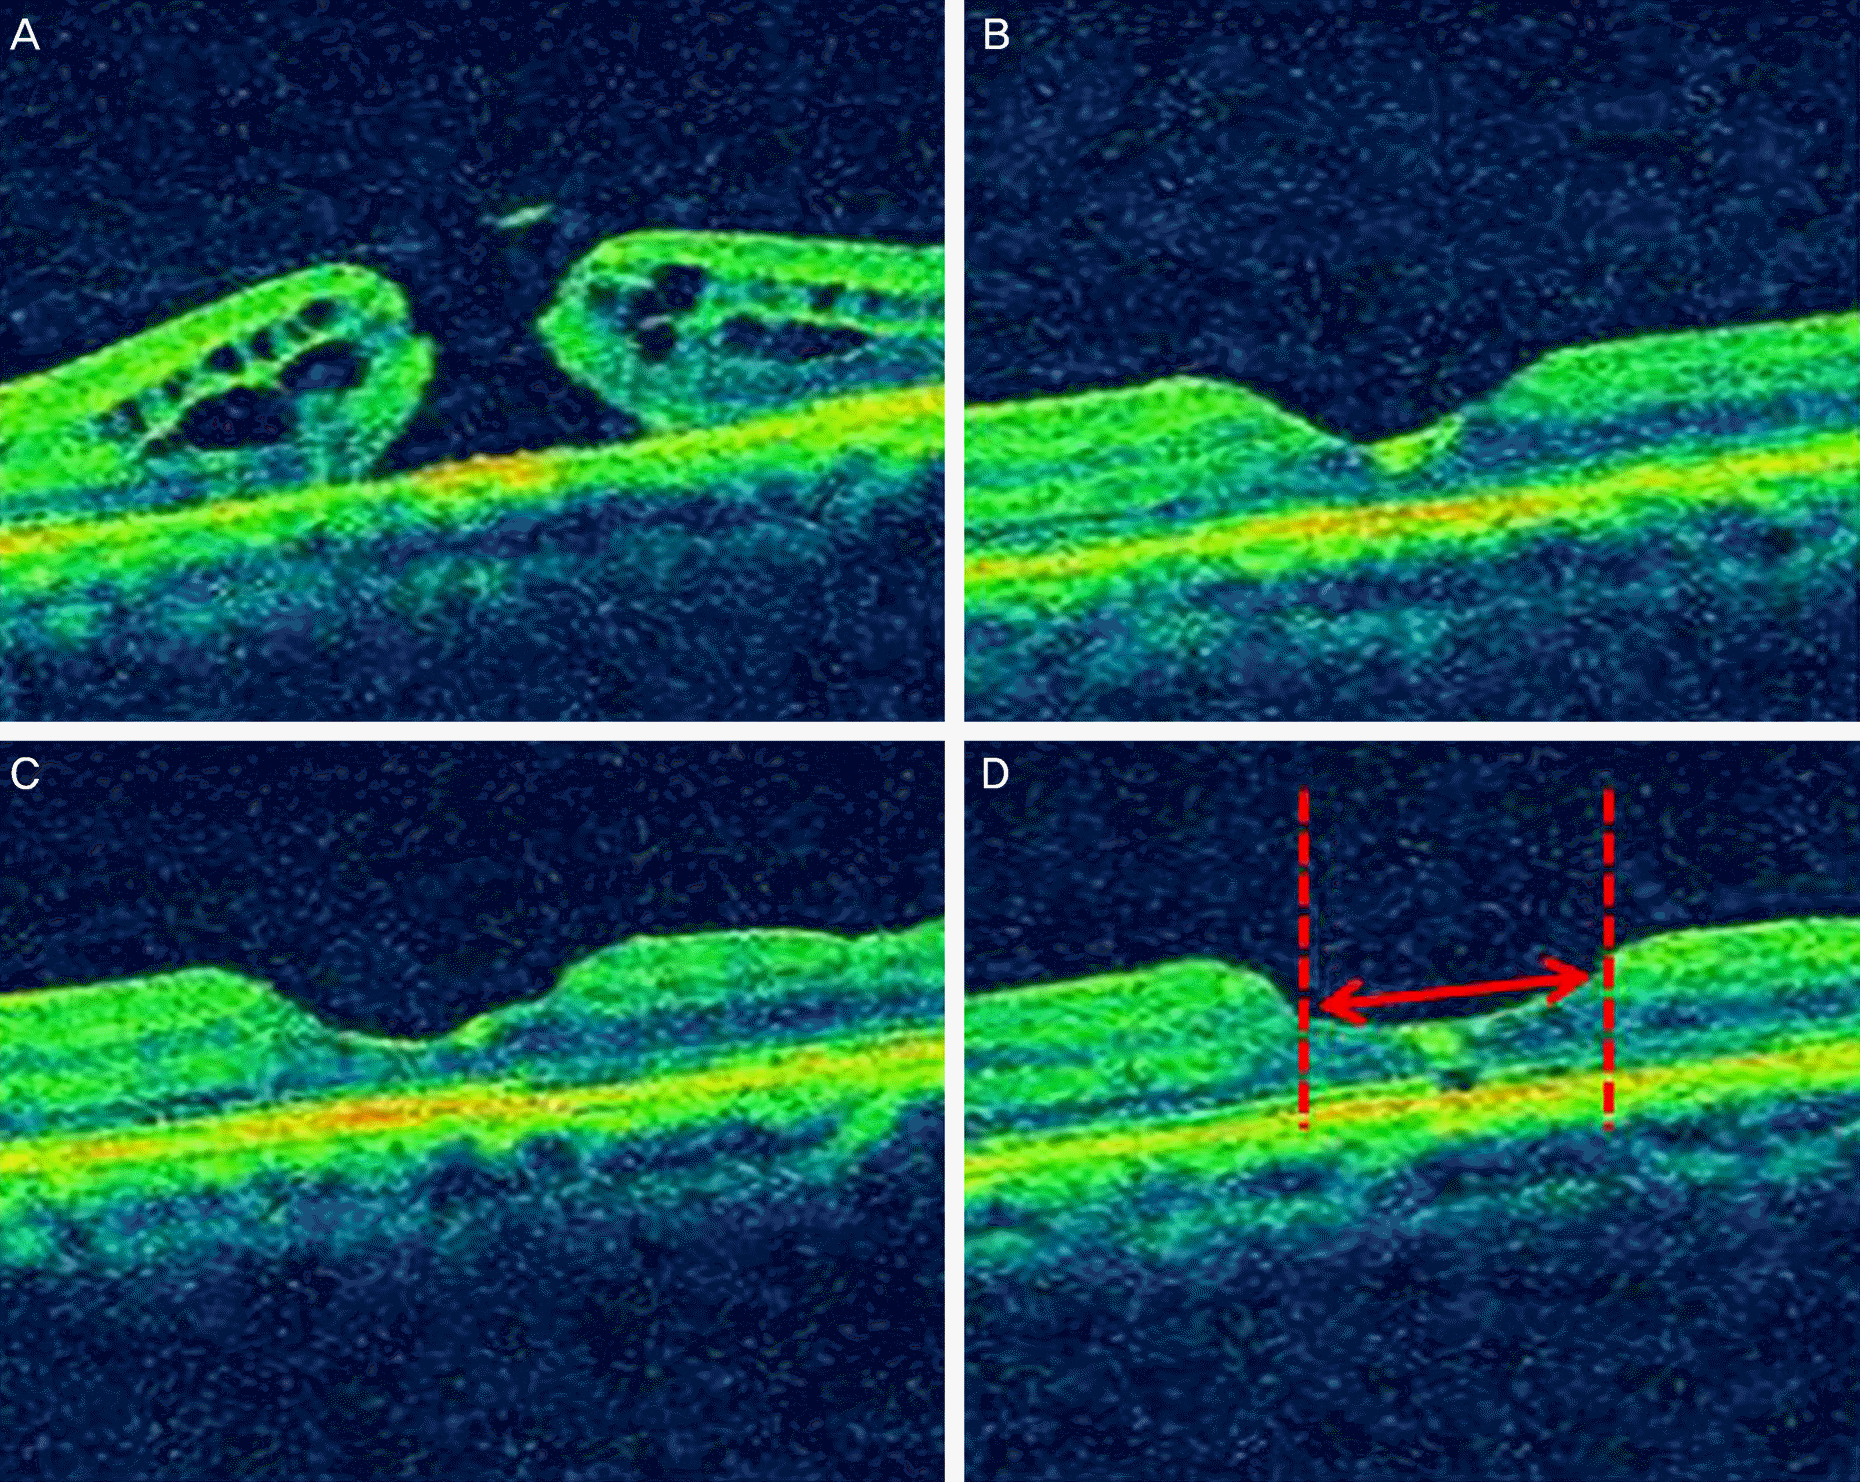
 | Figure 2.The spectral domain optical coherence tomography (SD-OCT) images of 61-year-old female patient representing postoperative elongation of foveal tissue. Note the inter-outer plexiform layer (OPL) distance had been increased over follow-up period. (A) Preoperative state (B) 1 month after macular hole surgery (C) 3 months (D) 6 months. |
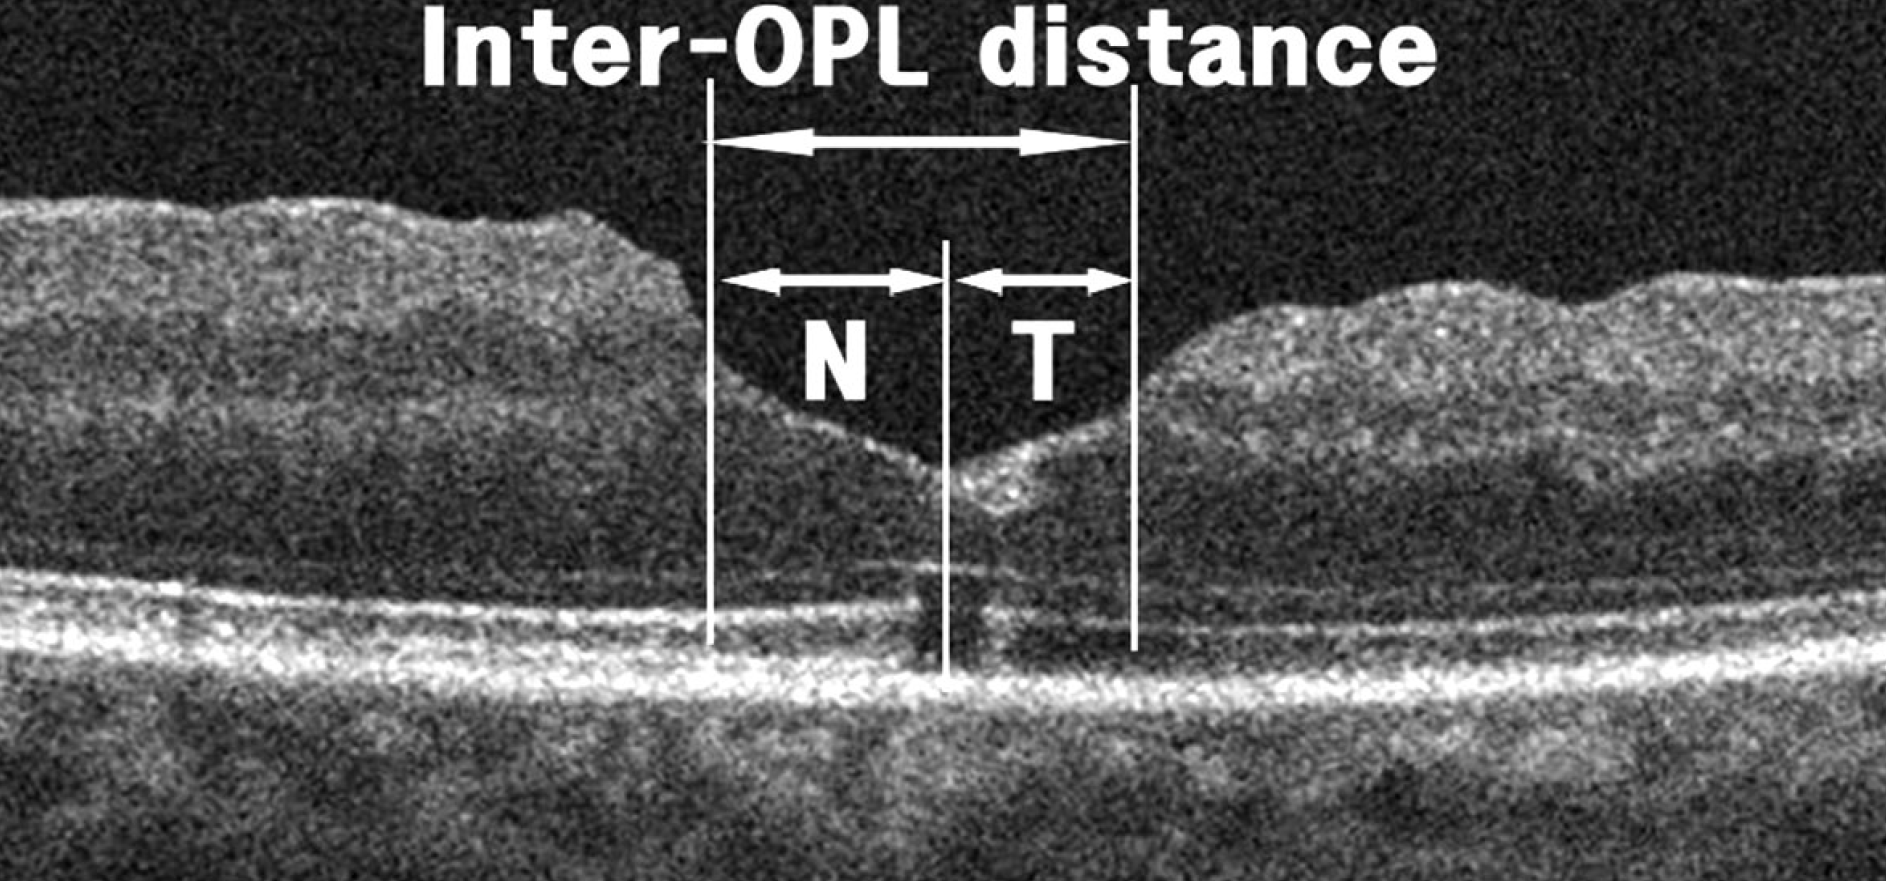
 | Figure 3.The distance between the edge of outer plexiform layer (OPL) was defined as ‘inter-OPL distance’. The spectral domain optical coherence tomography (SD-OCT) images were taken 1, 3 months after surgery using the 1:1 μm setting. The distance from the center of the foveal cyst to the edge of nasal edge of OPL was defined as N. N = nasal length; T = temporal length. |
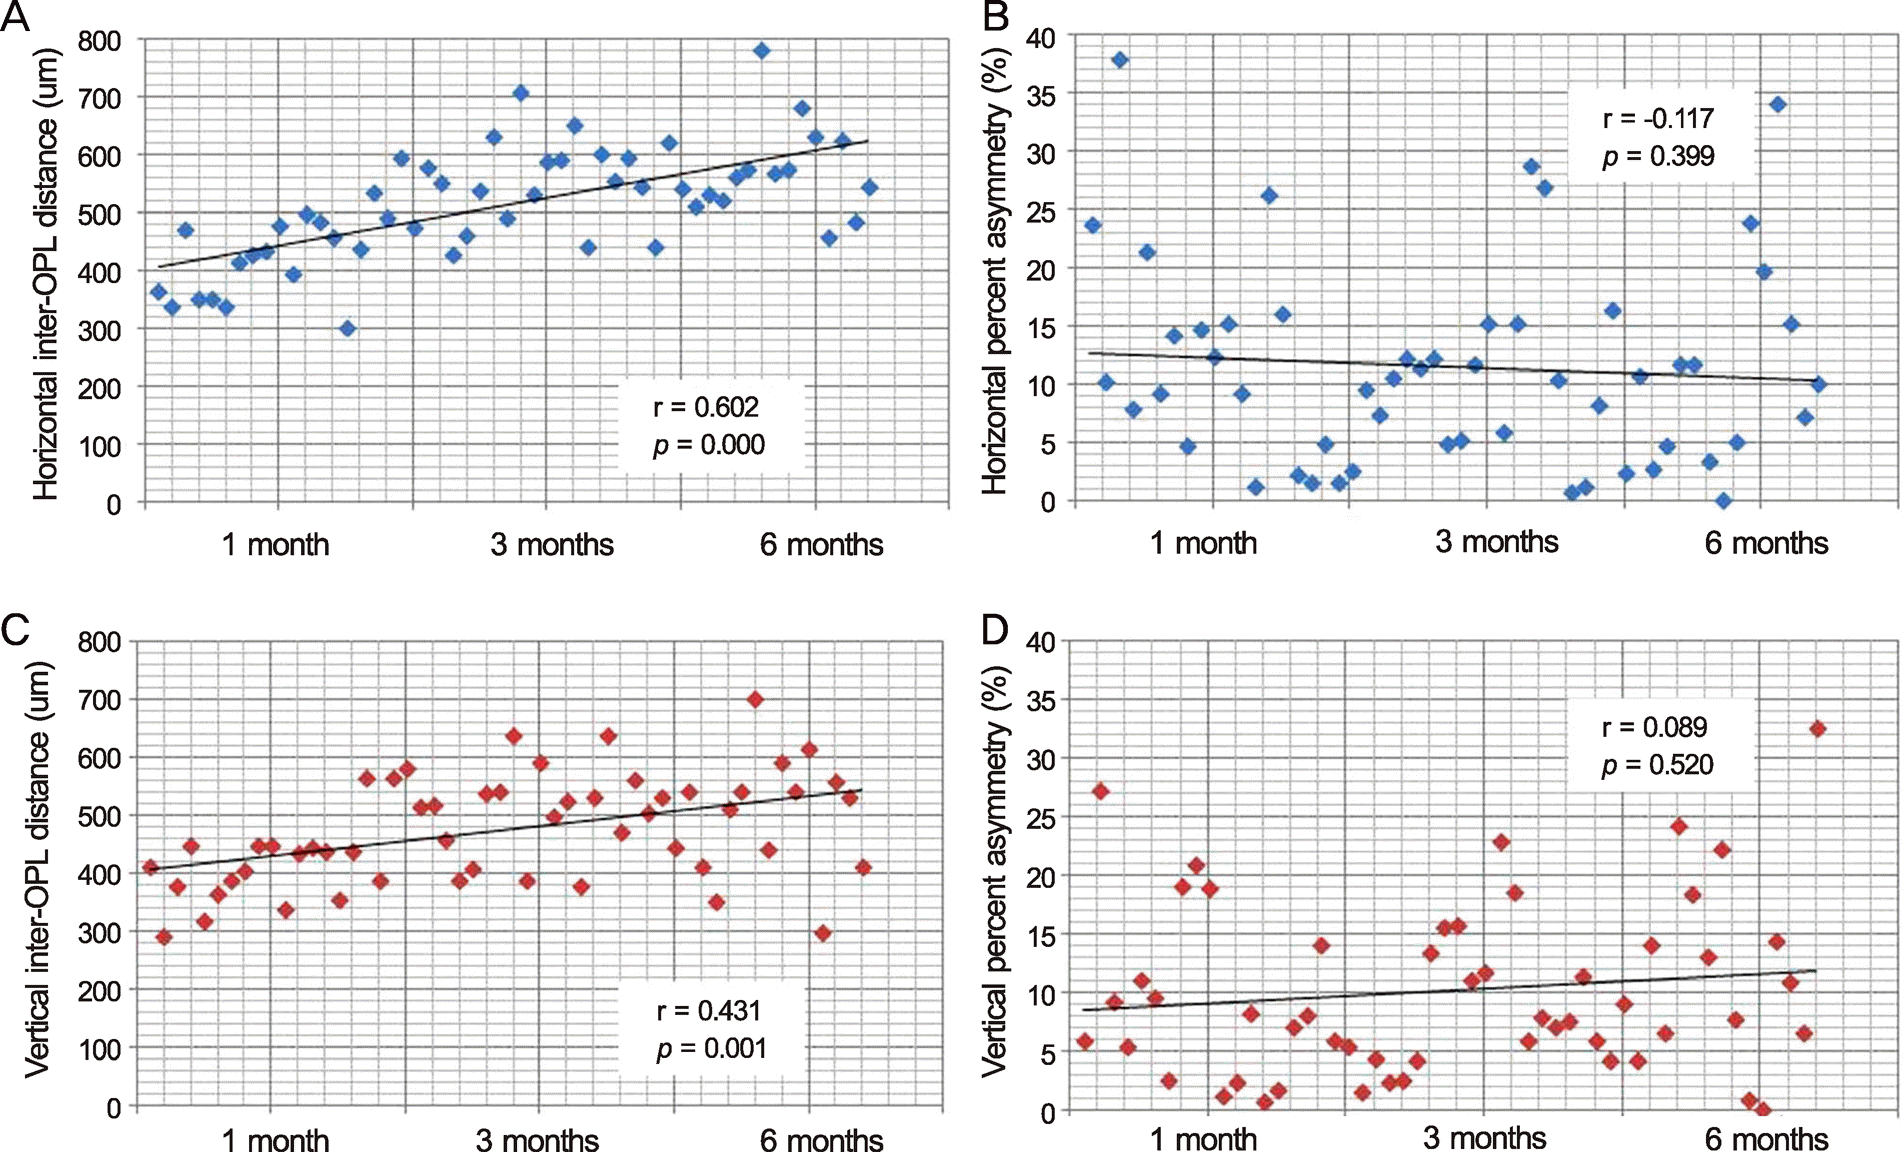
 | Figure 4.Scatter diagram of inter-outer plexiform layer (OPL) distance and percent asymmetry in each patient along with postoperative period. (A, B) Distribution of the horizontal inter-OPL distance and percent asymmetry. (C, D) Distribution of the vertical inter-OPL distance and percent asymmetry. |
Table 1.
Patient baseline characteristics
| Group A | Group B | Group C | p-value* | |
|---|---|---|---|---|
| No. of eyes (patients) | 9 (9) | 12 (12) | 8 (8) | |
| Age (years) | 63.75 ± 7.3 | 58.57 ± 5.44 | 59.29 ± 6.73 | 0.769 |
| Sex (M:F) | 2:7 | 6:6 | 1:7 | 0.174 |
| Hole diameter (μm) | 258.39 ± 97.46 | 261.67 ± 63.67 | 266.31 ± 106.13 | 0.980 |
| BCVA (log MAR) | 0.68 ± 0.29 | 0.6 ± 0.39 | 0.7 ± 0.3 | 0.560 |
| Axial length (mm) | 23.47 ± 0.92 | 23.46 ± 0.97 | 23.28 ± 0.53 | 0.885 |
| Follow-up duration (months) | 19.7 ± 11.81 | 10.72 ± 4.48 | 12.18 ± 6.04 | 0.137 |
Table 2.
Postoperative inter-OPL distance among the groups
| Group A | Group B | Group C | p-value* | |
|---|---|---|---|---|
| Horizontal inter-OPL distance | ||||
| PostOP 1M (μm) | 421.33 ± 109.97 | 436.58 ± 88.54 | 389.25 ± 48.75 | 0.485 |
| PostOP 3M (μm) | 509.44 ± 108.98 | 573.42 ± 81.58 | 529.5 ± 61.93 | 0.195 |
| Variations from 1M to 3M (μm) | 88.11 ± 41.57 | 136.83 ± 65.64 | 140.25 ± 68.51 | 0.244 |
| Vertical inter-OPL distance | ||||
| PostOP 1M (μm) | 404.14 ± 120.9 | 404.92 ± 78.55 | 400 ± 52.23 | 0.911 |
| PostOP 3M (μm) | 480 ± 111.98 | 508.83 ± 74.18 | 483.63 ± 70.09 | 0.537 |
| Variations from 1M to 3M (μm) | 75.89 ± 53.18 | 103.92 ± 73.37 | 83.63 ± 56.62 | 0.539 |
Table 3.
Postoperative asymmetry of foveal tissue elongation among the groups
| Group A | Group B | Group C | p-value* | |
|---|---|---|---|---|
| Horizontal direction | ||||
| PostOP 1M† | ||||
| Nasal length (μm) | 217 ± 55.52 | 218.42 ± 46.69 | 192 ± 45.95 | 0.461 |
| Temporal length (μm) | 204.33 ± 75.8 | 218.17 ± 65.81 | 197.25 ± 39.88 | 0.779 |
| Percent asymmetry (μm) | 16.86 ± 11.01 | 11.04 ± 10.93 | 15.12 ± 8.34 | 0.321 |
| PostOP 3M | ||||
| Nasal length (μm) | 256.56 ± 49.79 | 314.25 ± 64.88 | 270.25 ± 73.92 | 0.138 |
| Temporal length (μm) | 252.89 ± 97.26 | 259.17 ± 54.93 | 259.25 ± 67 | 0.874 |
| Percent asymmetry (μm) | 17.44 ± 16 | 13.84 ± 11.11 | 16.23 ± 16.9 | 0.750 |
| Vertical direction | ||||
| PostOP 1M | ||||
| Inferior length (μm) | 197.11 ± 65.63 | 203.42 ± 41.4 | 197.13 ± 37.27 | 0.925 |
| Superior length (μm) | 207 ± 59.87 | 201.5 ± 52 | 202.88 ± 37.26 | 0.899 |
| Percent asymmetry (μm) | 7.78 ± 3.96 | 11.07 ± 8.79 | 9.61 ± 7.83 | 0.543 |
| PostOP 3M | ||||
| Inferior length (μm) | 233.44 ± 41.82 | 277.08 ± 49.34 | 232 ± 41.54 | 0.078 |
| Superior length (μm) | 246.56 ± 85.27 | 231.75 ± 44.45 | 251.63 ± 44.09 | 0.792 |
| Percent asymmetry (μm) | 9.27 ± 7.16 | 11.19 ± 9.47 | 8.71 ± 5.23 | 0.842 |


 PDF
PDF ePub
ePub Citation
 Print
Print


 XML Download