

 PDF
PDF ePub
ePub Citation
 Print
Print


Abstract
Purpose
To present preoperative macular structure deformities and surgical outcomes in idiopathic epiretinal membrane (ERM) patient according to the presence of vitreomacular traction syndrome (VMTS).
Methods
This retrospective observational study included 54 eyes of 51 patients with idiopathic ERM, who underwent pars plana vitrectomy with ERM and internal limiting membrane (ILM) peeling, and were followed for more than 6 months. Subjects were classified into 2 groups according to the presence of VMTS using preoperative optical coherence tomography (group 1: ERM without VMTS, 29 eyes; group 2: ERM with VMTS, 22 eyes). Preoperative macular structure deformity and surgical outcomes were compared and prognostic factors were analyzed.
Results
Group 1 (ERM without VMTS) included 29 eyes, and group 2 (ERM with VMTS) included 22 eyes. Group 2 had a significantly higher occurrence of lamellar macular hole and a significantly lower preoperative best-corrected visual acuity (BCVA) compared to group 1. However, final postoperative BCVAs were not significantly different between the groups because BCVA changed more in group 2. Preoperative macular structure deformities (irregular retinal surface, retinal thickening, lamellar macular hole, and cystoid macular edema) did not affect visual outcomes. The presence of photoreceptor inner segment/outer segment (IS/OS) junction disruption and preoperative BCVA were highly related with visual outcomes.
Go to : 
References
1. Wickham L, Gregor Z. Epiretinal membrane. Ryan SJ, editor. Retina. 5th ed.Baltimore: Elsevier;2013. 3:chap. 116.
2. Kampik A. Pathology of epiretinal membrane, idiopathic macular hole, and vitreomacular traction syndrome. Retina. 2012; 32:S194–8. discussion S198-9.

3. Zhao F, Gand, orfer A, Haritoglou C, et al. Epiretinal cell proliferation in macular pucker and vitreomacular traction syndrome: analysis of flat-mounted internal limiting membrane specimens. Retina. 2013; 33:77–88.
4. Seo SJ, Lee SJ, Park JM. Surgical outcome according to morphology in epiretinal membrane based on optical coherence tomography (OCT). J Korean Ophthalmol Soc. 2013; 54:736–44.
5. Lee P, Lee TG, Kim MS, et al. Prognostic factors in vitrectomy for macular epiretinal membrane. J Korean Ophthalmol Soc. 2011; 52:1302–7.
6. Vinores SA, Campochiaro PA, Conway BP. Ultrastructural and electron-immunocytochemical characterization of cells in epiretinal membranes. Invest Ophthalmol Vis Sci. 1990; 31:14–28.
7. Gupta P, Yee KM, Garcia P, et al. Vitreoschisis in macular diseases. Br J Ophthalmol. 2011; 95:376–80.
8. Spaide RF. Vitreomacular traction syndrome. Retina. 2012; 32(Suppl 2):S187–90. discussion S190-3.
9. Koizumi H, Spaide RF, Fisher YL, et al. Three-dimensional evaluation of vitreomacular traction and epiretinal membrane using spectral-domain optical coherence tomography. Am J Ophthalmol. 2008; 145:509–17.
10. Sonmez K, Capone A Jr, Trese MT, Williams GA. Vitreomacular traction syndrome: impact of anatomical configuration on anatomical and visual outcomes. Retina. 2008; 28:1207–14.
11. Yamada N, Kishi S. Tomographic features and surgical outcomes of vitreomacular traction syndrome. Am J Ophthalmol. 2005; 139:112–7.
12. Odrobina D, Michalewska Z, Michalewski J, et al. Long-term evaluation of vitreomacular traction disorder in spectral-domain optical coherence tomography. Retina. 2011; 31:324–31.
13. Bottós JM, Elizalde J, Rodrigues EB, Maia M. Current concepts in vitreomacular traction syndrome. Curr Opin Ophthalmol. 2012; 23:195–201.
14. Kinoshita T, Kovacs KD, Wagley S, Arroyo JG. Morphologic differences in epiretinal membranes on ocular coherence tomography as a predictive factor for surgical outcome. Retina. 2011; 31:1692–8.
15. Wong JG, Sachdev N, Beaumont PE, Chang AA. Visual outcomes following vitrectomy and peeling of epiretinal membrane. Clin Experiment Ophthalmol. 2005; 33:373–8.
16. Lee HJ, Kim HC. The clinical outcome and prognostic factors of vitrectomy for macular epiretinal membranes. J Korean Ophthalmol Soc. 2003; 44:857–64.
17. Kim CH, Kim JI, Cho HY, Kang SW. Correlation between preoperative OCT pattern and visual improvement in macular epiretinal membrane. J Korean Ophthalmol Soc. 2007; 48:75–82.
18. Suh MH, Seo JM, Park KH, Yu HG. Associations between macular findings by optical coherence tomography and visual outcomes after epiretinal membrane removal. Am J Ophthalmol. 2009; 147:473–80.e3.
19. Ahn SJ, Ahn J, Woo SJ, Park KH. Photoreceptor change and visual outcome after idiopathic epiretinal membrane removal with or without additional internal limiting membrane peeling. Retina. 2014; 34:172–81.
20. Park DW, Dugel PU, Garda J, et al. Macular pucker removal with and without internal limiting membrane peeling: pilot study. Ophthalmology. 2003; 110:62–4.
21. Sandali O, El Sanharawi M, Basli E, et al. Epiretinal membrane recurrence: incidence, characteristics, evolution, and preventive and risk factors. Retina. 2013; 33:2032–8.
Go to :
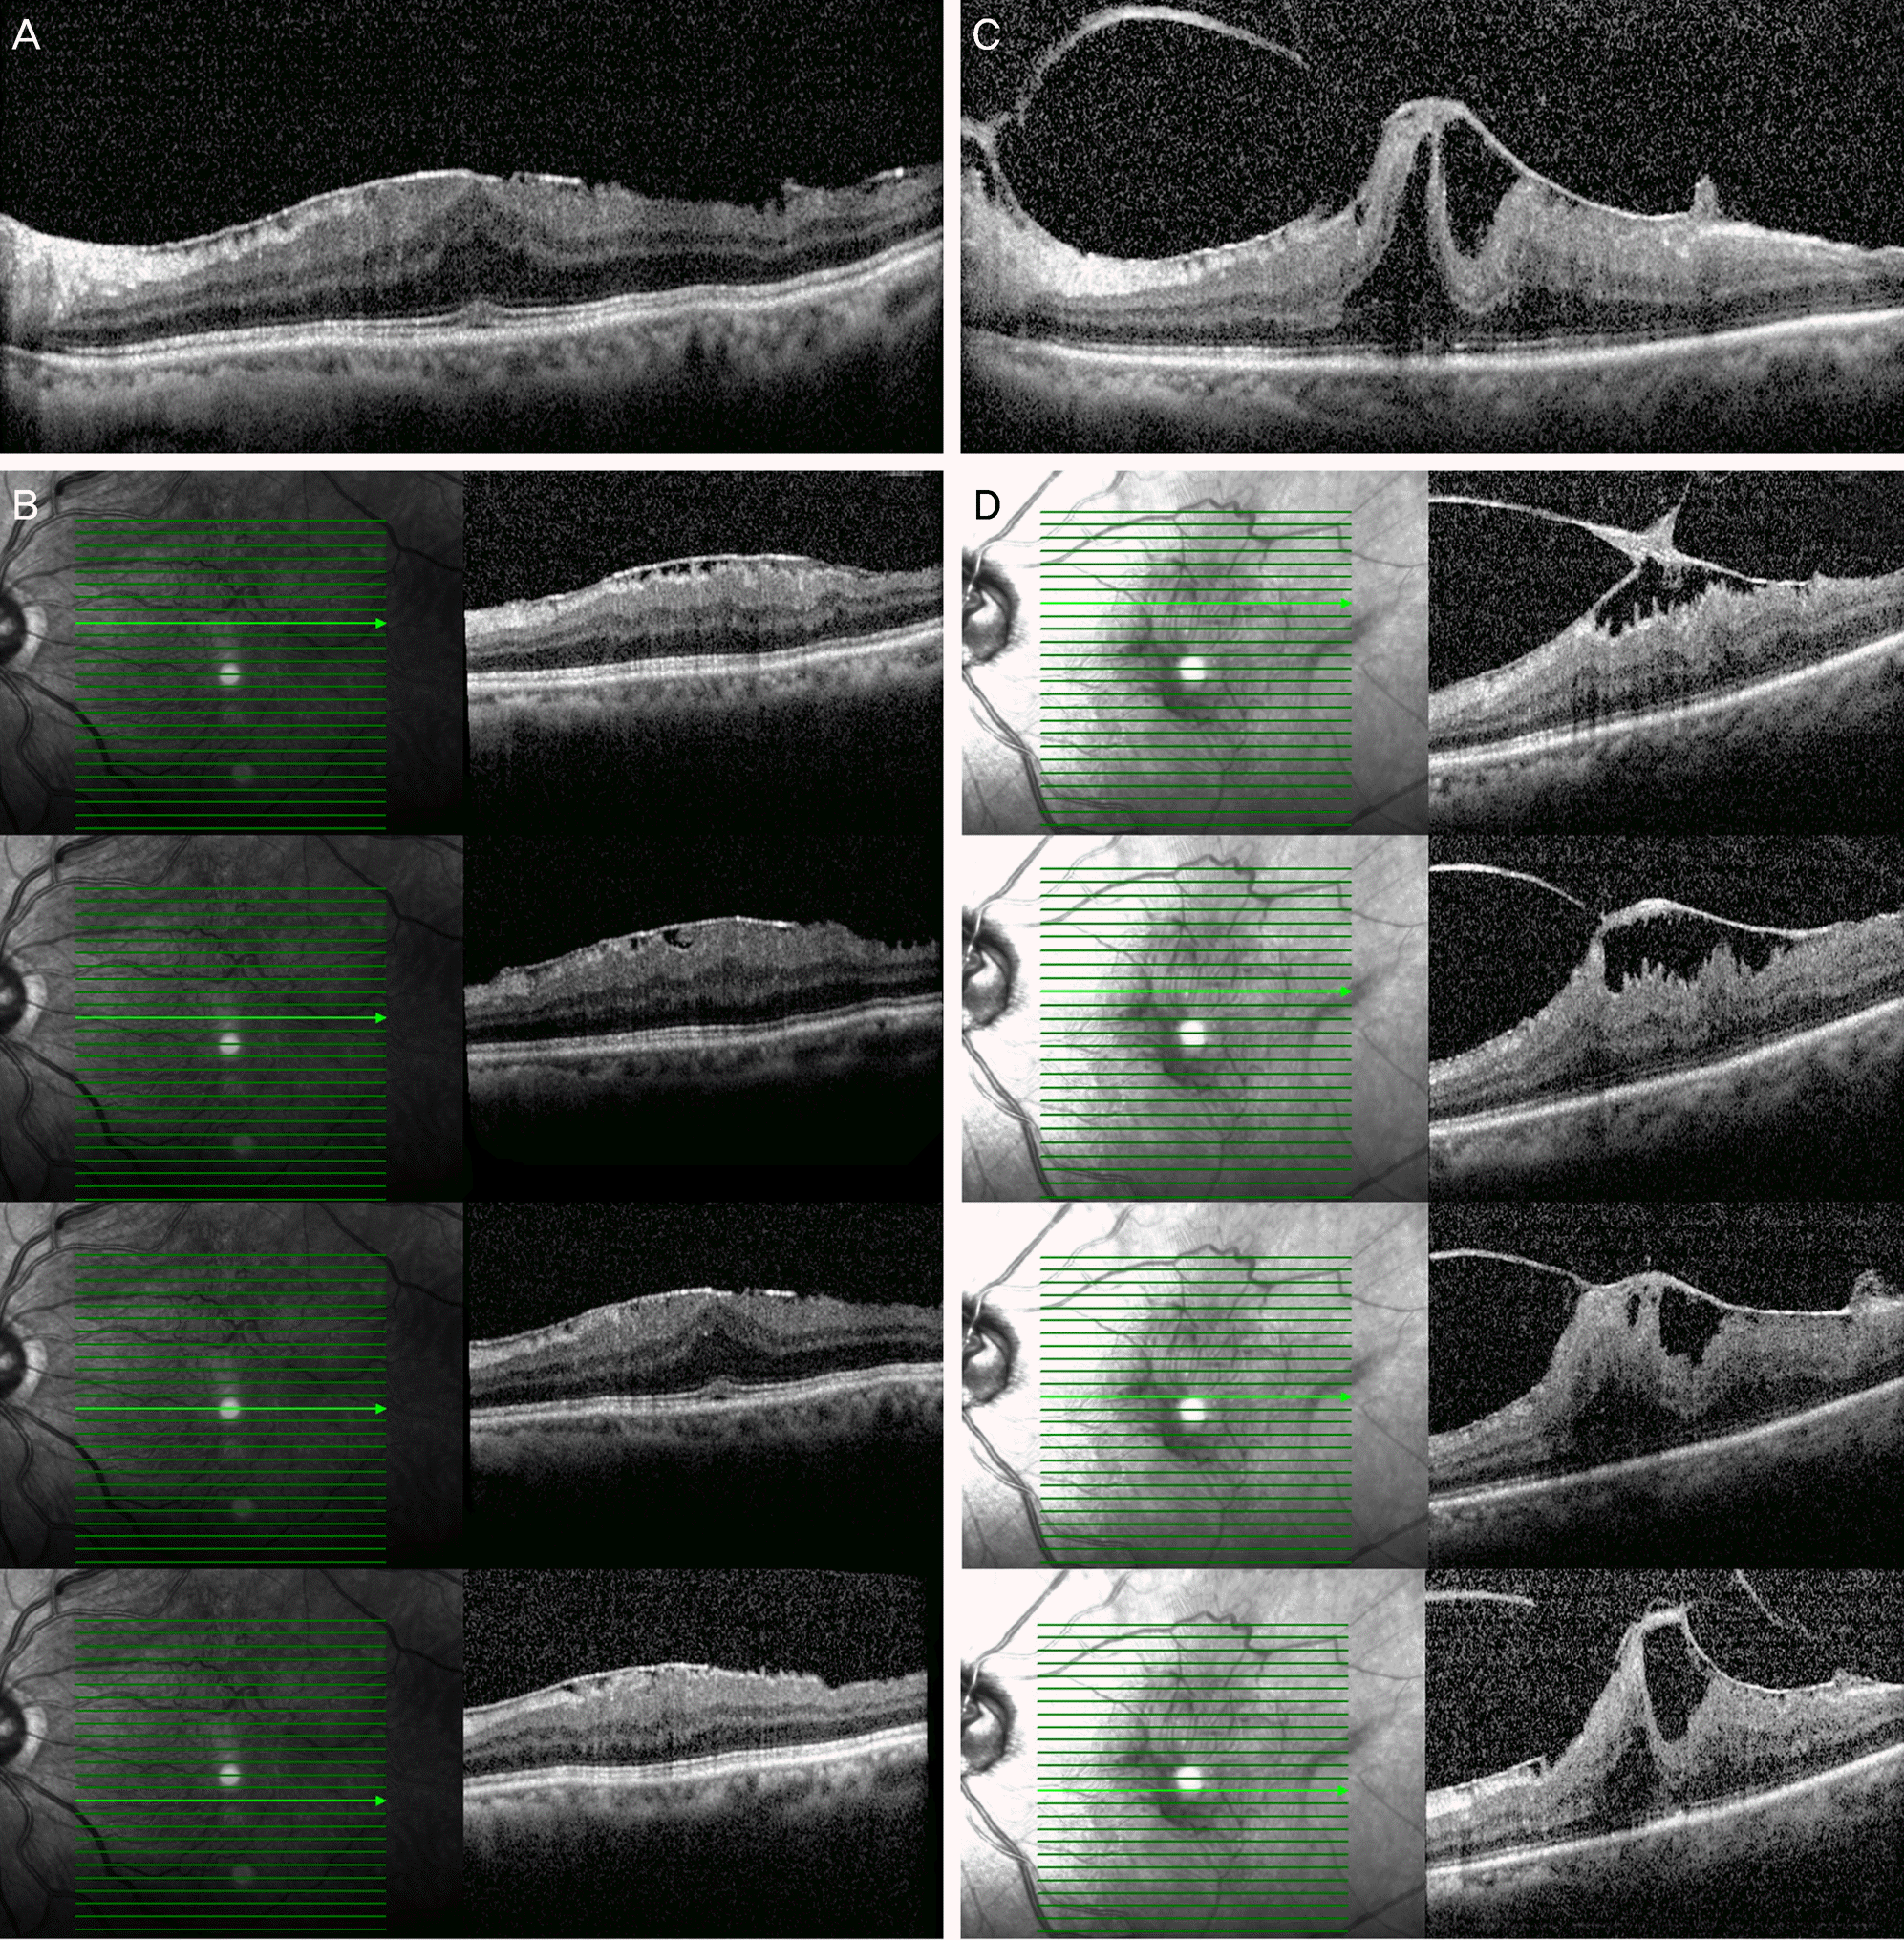 | Figure 1.Spectral domain optical coherence tomography (SD-OCT) images of 2 groups. (A, B) Epiretinal membrane (ERM) without vitreomacular traction syndrome (VMTS); hyper-reflective ERM above retinal surface and retinal thickening are seen, but posterior hyaloid is not seen. (C, D) ERM with VMTS; posterior hyaloid attached with ERM causing retinal traction and inner retinal plication are seen. |
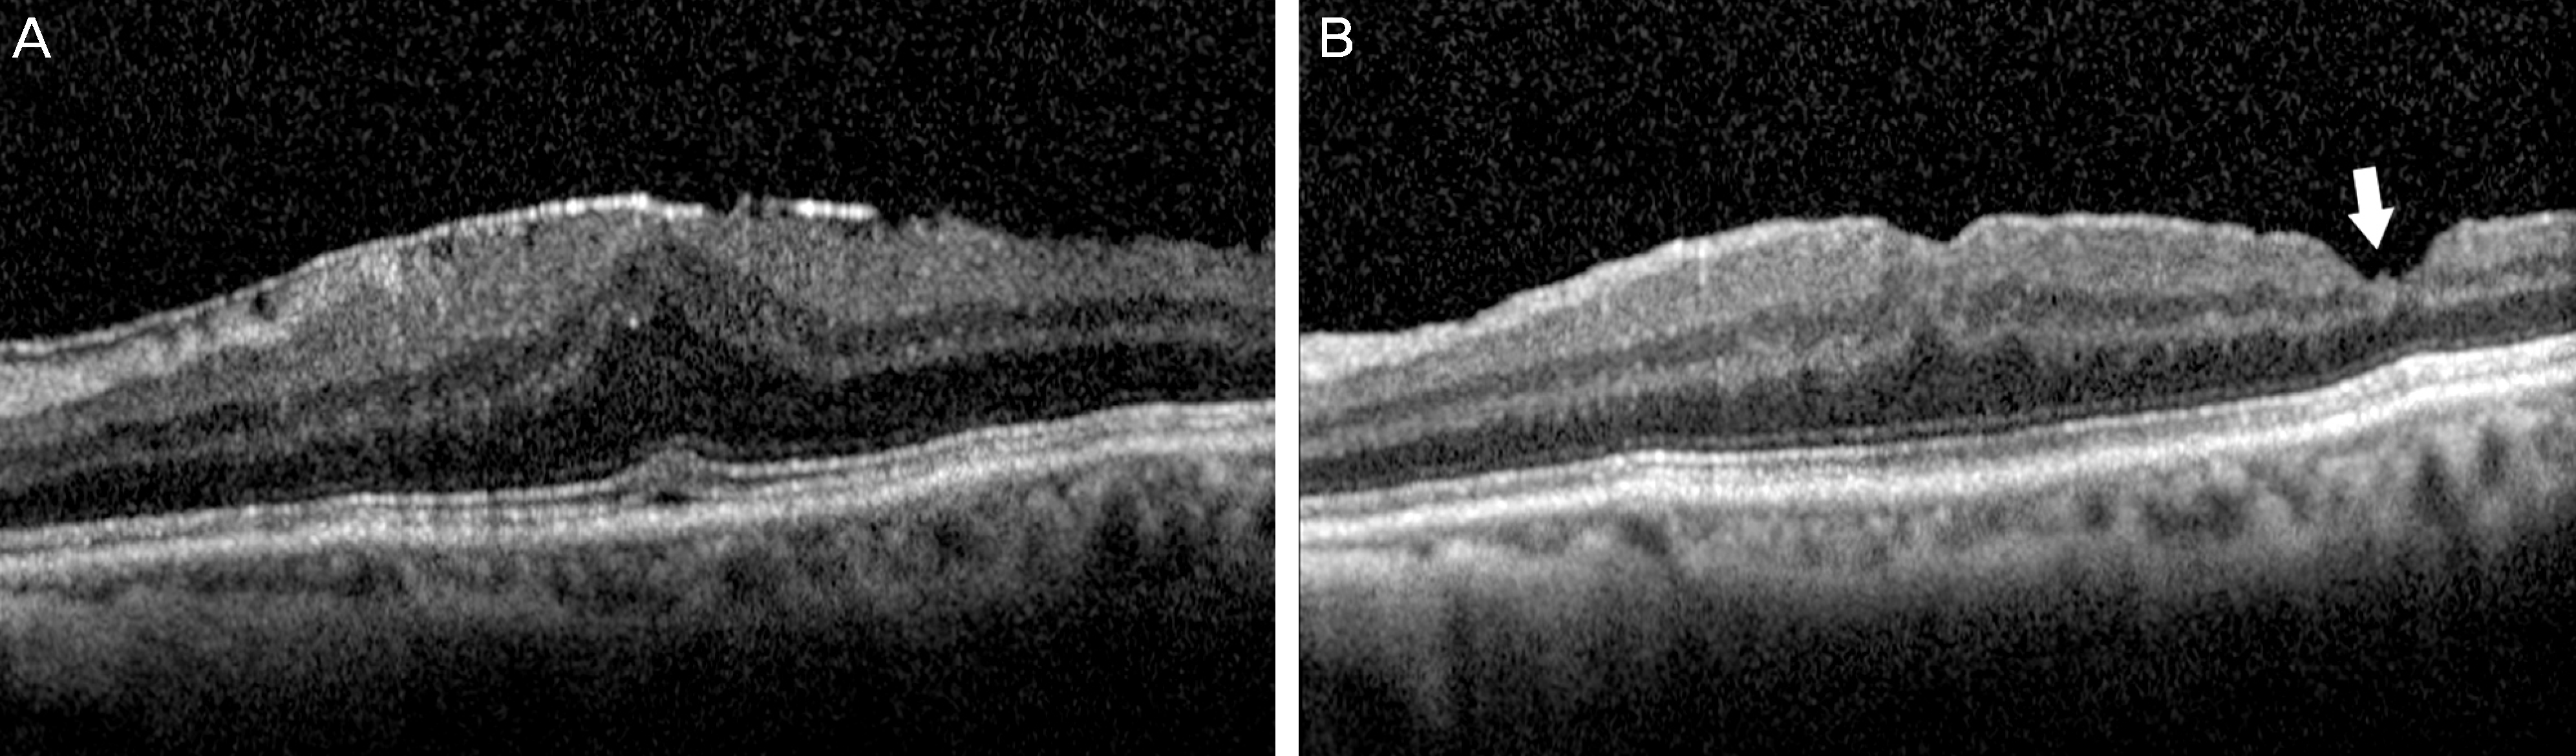
 | Figure 2.Spectral domain optical coherence tomography (SD-OCT) images of preoperative macular structure deformities. (A) Inner segment/outer segment (IS/OS) junction disruption; white arrow presents hypo-reflective discontinuity in the hyper-reflective IS/OS junction. (B) Irregular retinal surface beneath hyper-reflective epiretinal membrane (ERM) is seen. (C) Diffuse retinal thickening. (D) Cystoid macular edema. (E) Lamellar macular hole at fovea. Photoreceptor layers are intact. |
 | Figure 3.Spectral domain optical coherence tomography (SD-OCT) image changes after surgery of the same eye as in Fig. 1; Epiretinal membrane (ERM) without vitreomacular traction syndrome (VMTS). (A) Preoperative SD-OCT images with visual acuity log MAR 0.52. (B) SD-OCT image at 12 months after operation with visual acuity log MAR 0.30. Foveal contour is not completely recovered but fovea is depressed. White arrow presents damages of nerve fiber layer and ganglion cell layer during internal limiting membrane (ILM) peeling. |
 | Figure 4.Spectral domain optical coherence tomography (SD-OCT) image changes after surgery of the same eye as in Fig. 1; Epiretinal membrane (ERM) with vitreomacular traction syndrome (VMTS). (A) Preoperative SD-OCT images with visual acuity log MAR 0.70. (B) SD-OCT image at 12 months after operation with visual acuity log MAR 0.05. Inner retinal surface is still irregular, but overall retina is remarkably flattened and photoreceptor layers are intact. |
Table 1.
Patient's demographic findings in 2 groups
| Group 1* | Group 2† | Total | p-value | |
|---|---|---|---|---|
| No. of eyes | 32 | 22 | 54 | |
| Sex (M:F) | 8:21 | 8:14 | 16:35 | 0.773‡ |
| Age (years) | 69.6 ± 6.3 | 61.4 ± 11.8 | 66.2 ± 9.7 | 0.003§ |
| Duration of symptom (months) | 12.3 ± 11.5 | 7.4 ± 6.4 | 10.5 ± 10.0 | 0.248§ |
| Phakic:Pseudophakic | 28:4 | 21:1 | 49:5 | 0.638‡ |
| Surgery (%) | ||||
| Combined cataract surgery | 28 (87.5) | 21 (95.5) | 49 (90.7) | 0.638‡ |
| PPV + ERM removal + ILM peeling | 32 (100) | 22 (100) | 54 (100) | − |
| SF6 gas tamponade | 10 (31.3) | 17 (77.3) | 27 (50.5) | 0.002‡ |
| Follow-up (months) | 20.4 ± 14.6 | 20.9 ± 13.8 | 20.6 ± 14.2 | 0.832§ |
Table 2.
Comparisons of preoperative macular structure deformities by OCT in 2 groups
| OCT findings | Group 1* | Group 2† | p-value |
|---|---|---|---|
| IS/OS junction disruption (%) | 4/32 (12.5) | 7/22 (31.8) | 0.100§ |
| Presence of irregular retinal surface (%) | 12/32 (37.5) | 10/22 (45.5) | 0.559‡ |
| Increased retinal thickness (%) | 28/32 (87.5) | 20/22 (90.9) | 0.695§ |
| Presence of cystoid macular edema (%) | 5/32 (15.6) | 4/22 (18.2) | 0.702§ |
| Presence of lamellar macular hole (%) | 2/32 (6.3) | 10/22 (45.5) | 0.002§ |
Table 3.
Comparisons of best corrected visual acuity in 2 groups
| Group 1* | Group 2† | p-value | |
|---|---|---|---|
| Preoperative BCVA (log MAR) | 0.34 ± 0.24 | 0.50 ± 0.24 | 0.010‡ |
| Final BCVA (log MAR) | 0.19 ± 0.21 | 0.23 ± 0.19 | 0.258‡ |
| BCVA change (log MAR) | 0.14 ± 0.13 | 0.26 ± 0.23 | 0.003‡ |
| p-value | 0.001§ | 0.001§ |
Table 4.
Comparisons of central macular thickness in 2 groups
| Group 1* | Group 2† | p-value | |
|---|---|---|---|
| Preoperative CMT (μm) | 418.8 ± 107 | 510.6 ± 144.5 | 0.014‡ |
| Final CMT (μm) | 338.0 ± 83.0 | 328.5 ± 85.2 | 0.805‡ |
| CMT change (μm) | 80.8 ± 75.8 | 182.1 ± 147.6 | 0.003‡ |
| p-value | 0.001§ | 0.001§ |
Table 5.
Prognostic factors according to preoperative macular structure deformities by OCT in 2 groups
| OCT findings |
Postoperative BCVA (log MAR) |
p-value | |
|---|---|---|---|
| ≥0.3 (n = 19) | <0.3 (n = 35) | ||
| IS/OS junction disruption (%) | 9/19 (47.4) | 2/35 (5.7) | 0.000* |
| Presence of irregular retinal surface (%) | 7/19 (36.8) | 15/35 (42.9) | 0.667† |
| Increased retinal thickness (%) | 17/19 (89.5) | 29/35 (82.9) | 0.698* |
| Presence of cystoid macular edema (%) | 4/19 (21.1) | 4/35 (11.4) | 0.431* |
| Presence of lamellar macular hole (%) | 5/19 (26.3) | 7/35 (20.0) | 0.734* |
Table 6.
Prognostic factors for final BCVA
| Factors | p-value* |
|---|---|
| Age | 0.220 |
| Sex | 0.564 |
| Duration of symptom | 0.422 |
| Preoperative BCVA | 0.000 |
| Presence of VMTS | 0.303 |
| IS/OS junction disruption | 0.000 |
| Presence of irregular retinal surface | 0.989 |
| Increased retinal thickness | 0.379 |
| Presence of lamellar macular hole | 0.361 |
| Presence of cystoid macular edema | 0.790 |
| SF6 gas tamponade | 0.340 |
 XML Download