

 PDF
PDF ePub
ePub Citation
 Print
Print


Abstract
Purpose
To investigate identifiable peripheral retinal lesions in patients with myopia or high myopia and to evaluate the usefulness of ultra-widefield scanning laser ophthalmoscope in retina clinic settings.
Methods
We evaluated fundus images of 149 patients acquired using an ultra-widefield scanning laser ophthalmoscope. Manual fundus examination by a retinal specialist was performed and sensitivity and specificity were calculated by comparing the findings of the two different fundus examination methods.
Results
Variable peripheral retinal lesions were observed: lattice degeneration (24.1% in myopia, 36.6% in high myopia), white without pressure (17.7% in myopia, 20.7% in high myopia), retinal break (5.1% in myopia, 7.5% in high myopia) and retinal detachment (1.3% in myopia, 4.2% in high myopia). The incidence of lattice degeneration was significantly higher in myopic eyes than in highly myopic eyes (p = 0.043). The examination sensitivities were as follows: lattice degeneration (84.2% in myopia, 91.0% in high myopia), white without pressure (100.0% in both myopia and high myopia), retinal break (75.0% in myopia, 43.8% in high myopia) and retinal detachment (100.0% in myopia, 66.7% in high myopia). The examination specificities were 100.0% in all cases.
Conclusions
Diagnostic sensitivities of ultra-widefield scanning laser ophthalmoscope were 90.8% in patients with myopia, 91.0% in patients with high myopia and 90.9% in totally myopic patients, which were relatively high values. Therefore, the ultra-widefield scanning laser ophthalmoscope is useful as auxiliary equipment for myopic patients in retina clinic settings.
Go to : 
References
1. French AN, Morgan IG, Burlutsky G, et al. Prevalence and 5- to 6-year incidence and progression of myopia and hyperopia in Australian schoolchildren. Ophthalmology. 2013; 120:1482–91.

2. He M, Zeng J, Liu Y, et al. Refractive error and visual impairment in urban children in southern china. Invest Ophthalmol Vis Sci. 2004; 45:793–9.
3. Fan DS, Lam DS, Lam RF, et al. Prevalence, incidence, and progression of myopia of school children in Hong Kong. Invest Ophthalmol Vis Sci. 2004; 45:1071–5.
4. Pan CW, Zheng YF, Anuar AR, et al. Prevalence of refractive errors in a multiethnic Asian population: the Singapore epidemiology of eye disease study. Invest Ophthalmol Vis Sci. 2013; 54:2590–8.
5. Hyams SW, Neumann E. Peripheral retina in myopia. With particular reference to retinal breaks. Br J Ophthalmol. 1969; 53:300–6.
6. Pierro L, Camesasca FI, Mischi M, Brancato R. Peripheral retinal changes and axial myopia. Retina. 1992; 12:12–7.
7. Kim HW, Paik HJ, Ruh K. The relationship of axial length and peripheral retinal degeneration. J Korean Ophthalmol Soc. 1996; 37:999–1004.
8. Bansal AS, Hubbard GB 3rd. Peripheral retinal findings in highly myopic children < or =10 years of age. Retina. 2010; 30(4 Suppl):S15–9.
9. Lai TY, Fan DS, Lai WW, Lam DS. Peripheral and posterior pole retinal lesions in association with high myopia: a cross-sectional community-based study in Hong Kong. Eye (Lond). 2008; 22:209–13.
10. Chou B. Limitations of the Panoramic 200 Optomap. Optom Vis Sci. 2003; 80:671–2.
11. Yura T. The relationship between the types of axial elongation and the prevalence of lattice degeneration of the retina. Acta Ophthalmol Scand. 1998; 76:90–5.
12. Cheng SC, Yap MK, Goldschmidt E, et al. Use of the Optomap with lid retraction and its sensitivity and specificity. Clin Exp Optom. 2008; 91:373–8.
Go to :
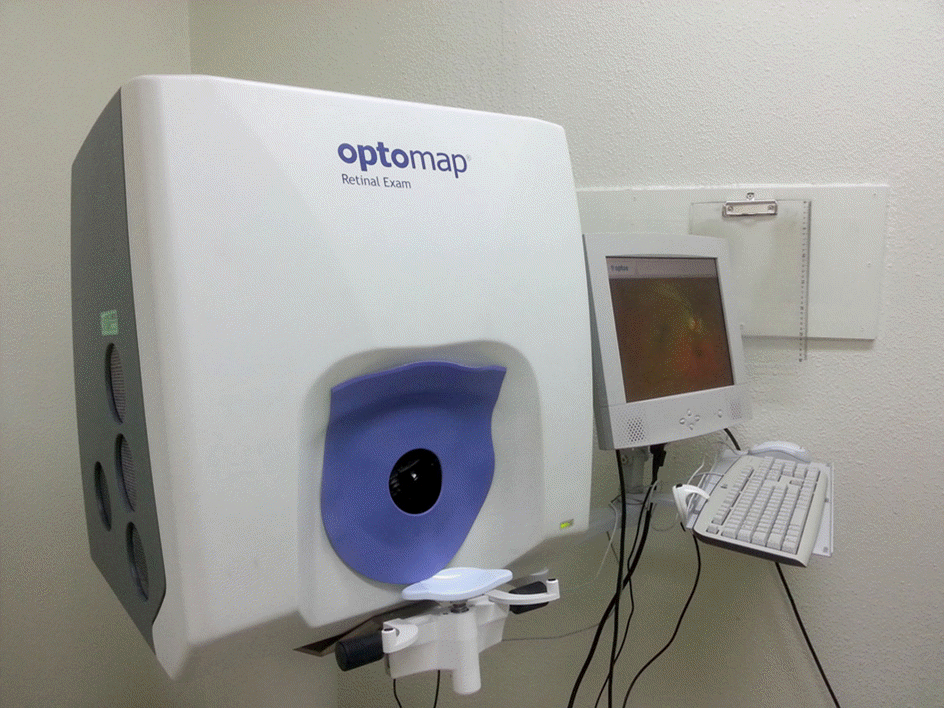 | Figure 1.Image of ultra-widefield imaging device, Optomap® Panoramic 200C (Optos PLC, Dunfermline, Fife, Scotland, UK). |
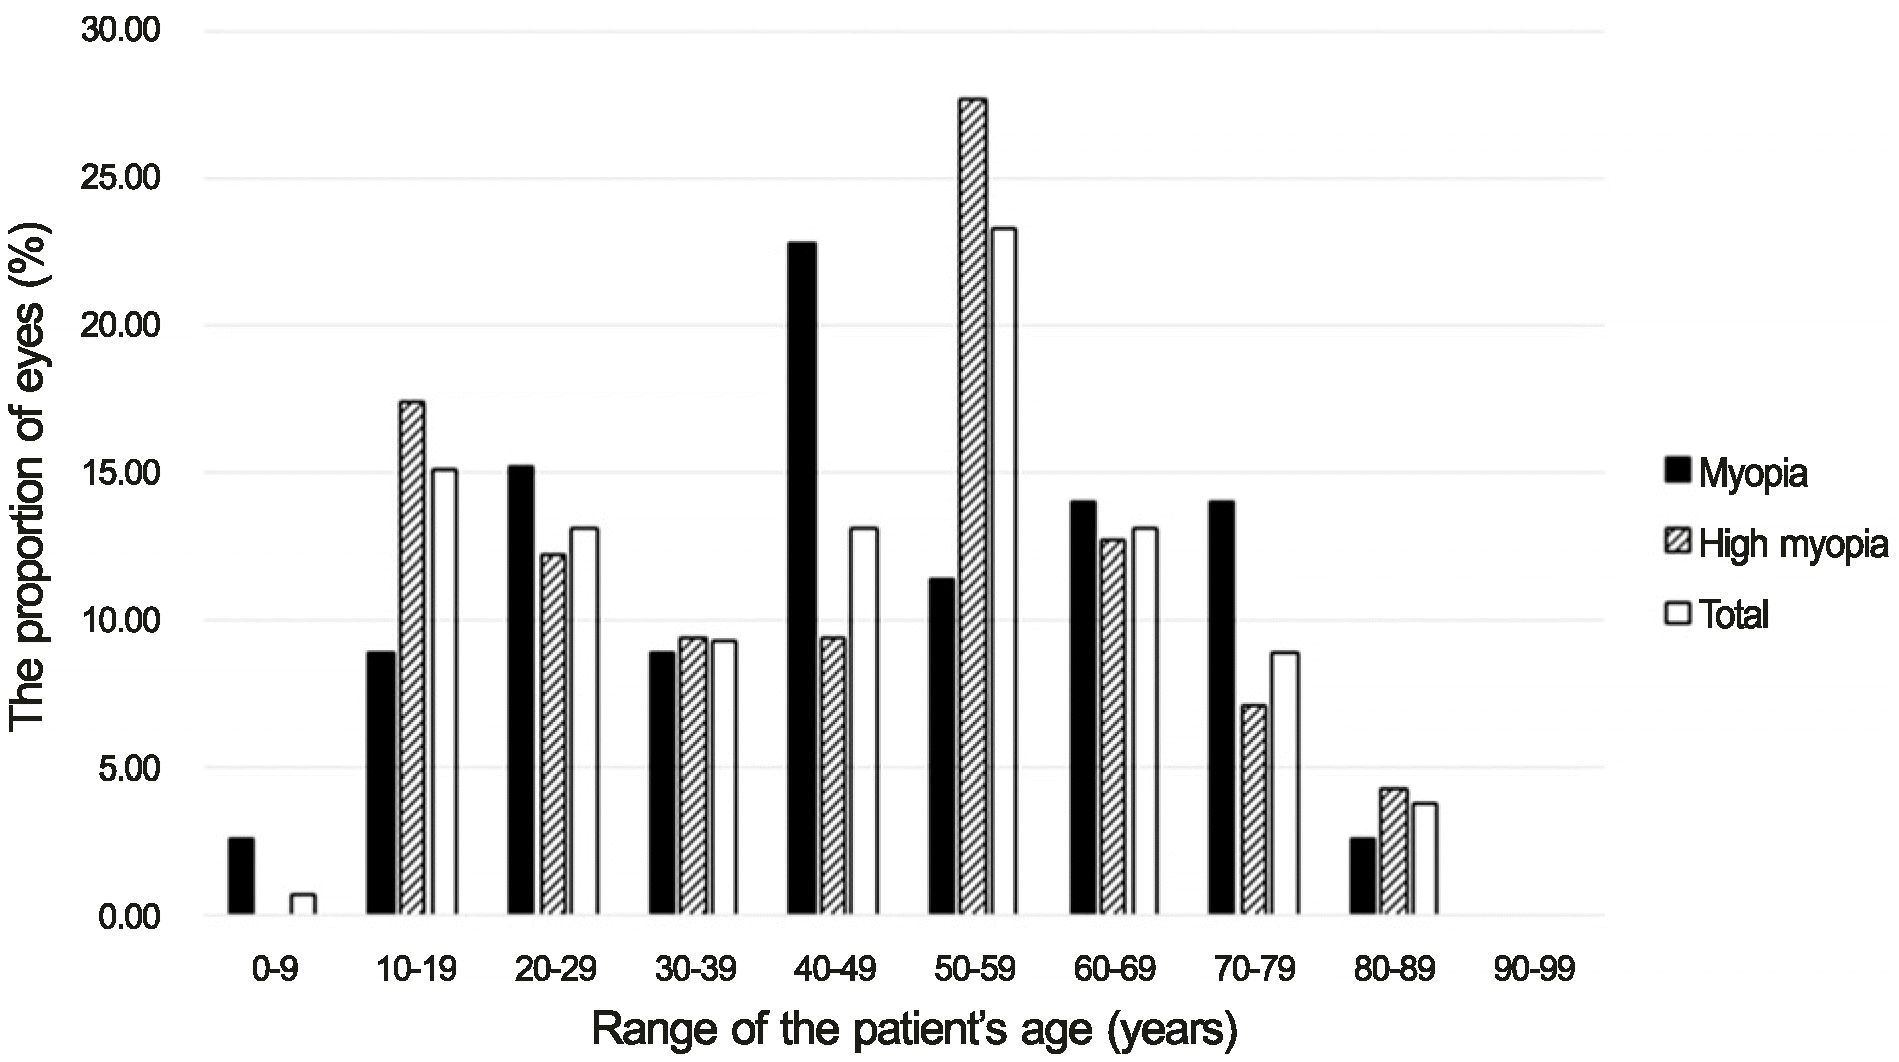 | Figure 2.Baseline age distribution of each group. 40-49 years old patients showed the highest proportion in myopic group (22.8%). 50-59-year-old patients showed the highest proportion in highly myopic group (27.7%) and in total eyes (23.3%). |
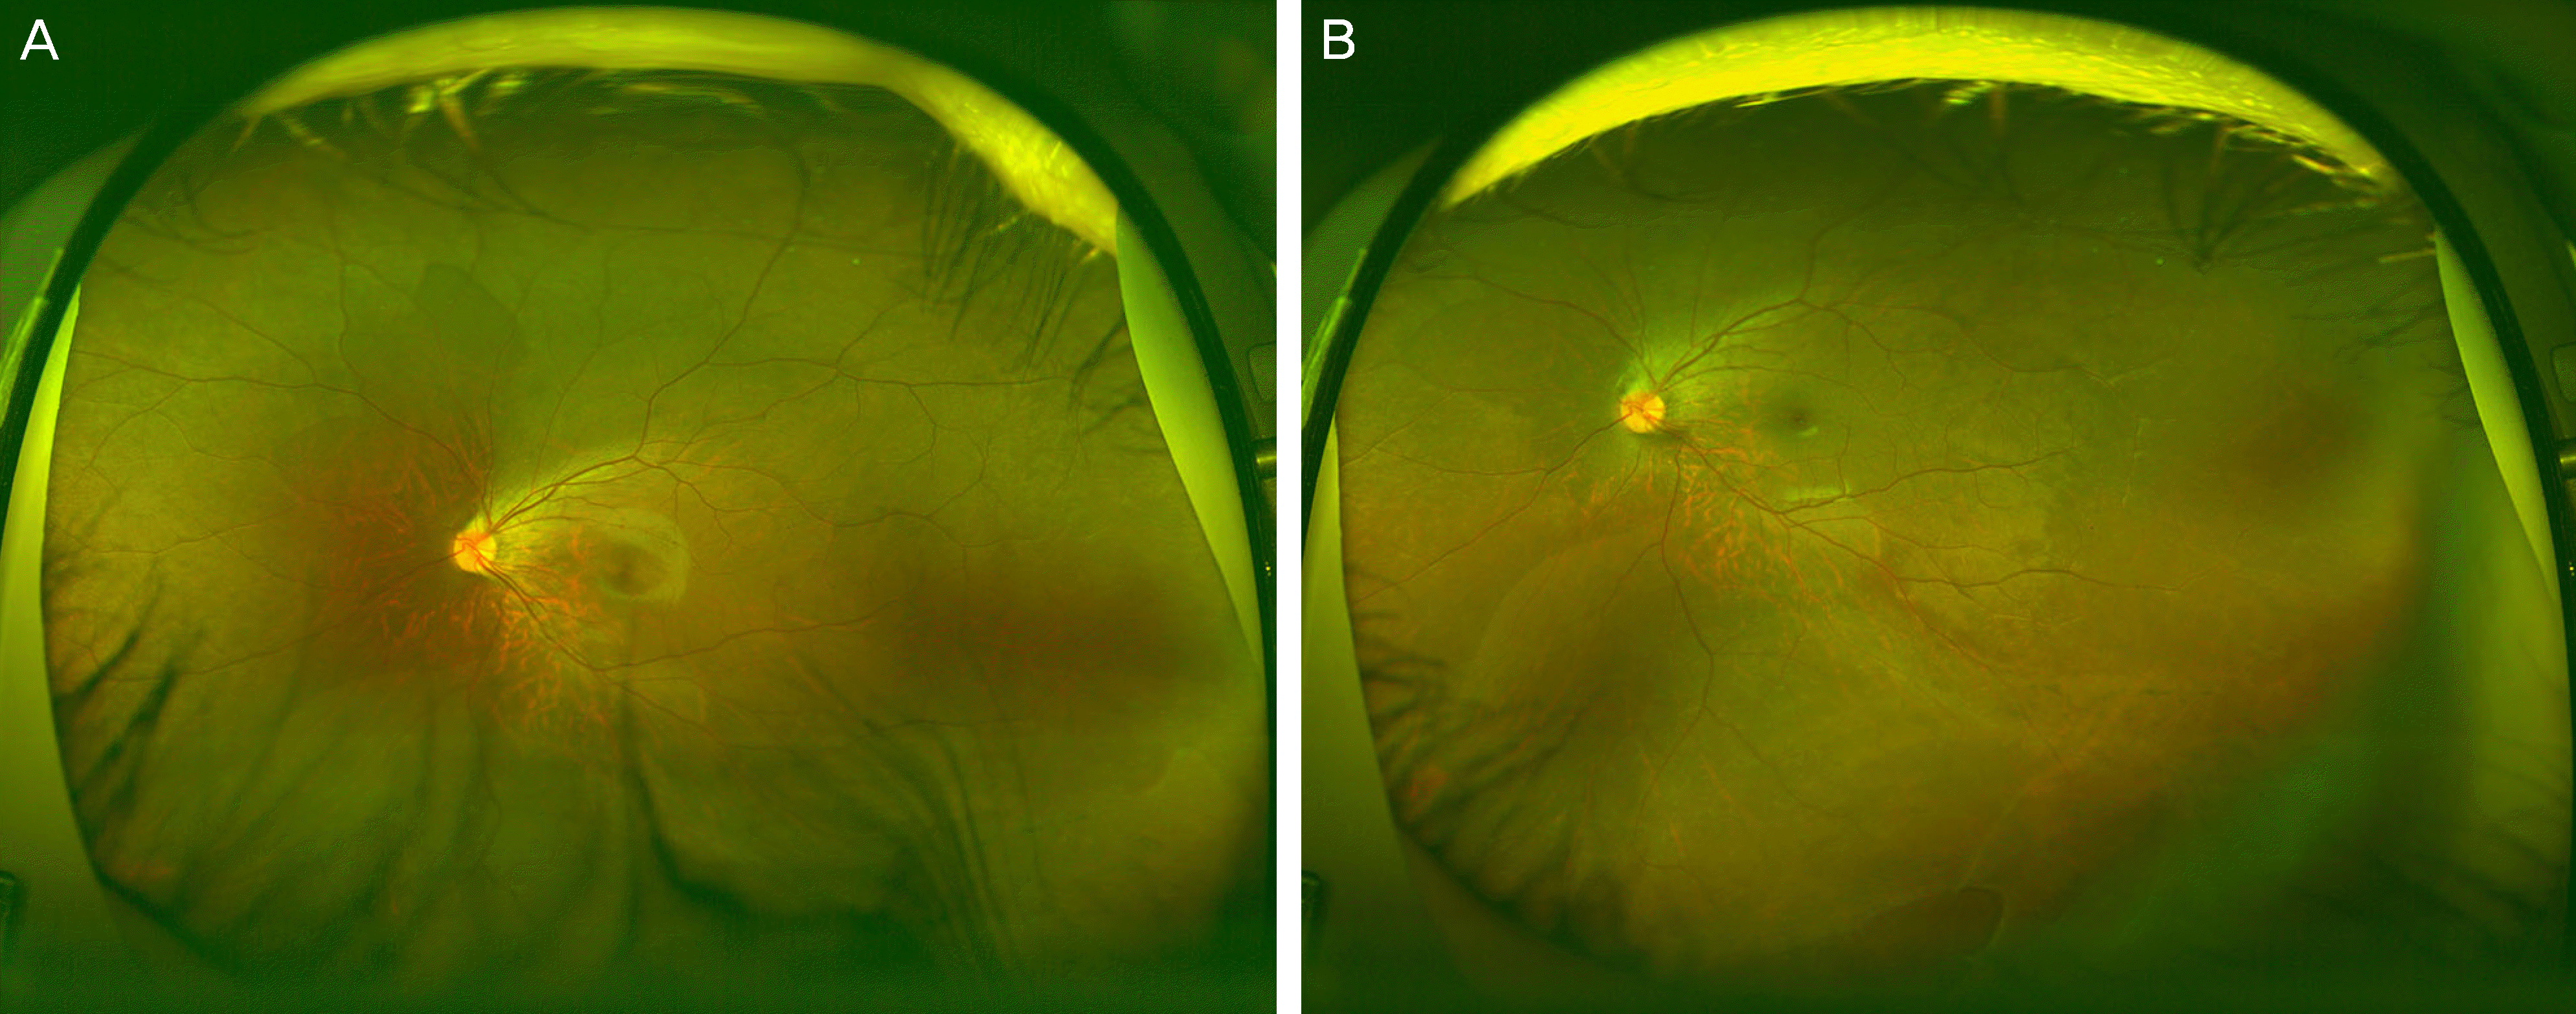 | Figure 3.An example of diagnostic failure of peripheral retinal lesions using ultra-widefield scanning laser ophthalmoscope. Nineteen-year-old male visited our clinic for known retinal detachment at the inferior quadrant of his left eye. (A) On primary gaze, ultra-widefield imaging device couldn't detect the lesion located at the inferior periphery due to eyelashes. (B) After downward gaze, a horseshoe retinal tear with bullous retinal detachment at the inferior was detected at last. |
Table 1.
Baseline characteristics of each group
| Myopia | High myopia | p-value | |
|---|---|---|---|
| Eyes (n) | 79 | 213 | |
| Age (years) | 46.44 ± 20.43 | 45.47 ± 20.42 | 0.718* |
| Age range (years) | 26.01-66.87 | 25.05-65.89 | |
| Sex (M/F) | 26/53 | 67/146 | 0.813† |
| Laterality (OD/OS) | 40/39 | 106/107 | 0.895† |
| log MAR BCVA | 0.38 ± 0.47 | 0.60 ± 0.61 | 0.002* |
| IOP (mm Hg) | 13.13 ± 4.17 | 13.79 ± 3.39 | 0.253* |
| Spherical diopter (diopter) | −2.98 ± 2.05 | −9.63 ± 4.19 | <0.001* |
| SE (diopter) | −3.12 ± 2.27 | −9.82 ± 4.96 | <0.001* |
| AXL (mm) | 24.65 ± 1.05 | 29.02 ± 2.15 | <0.001† |
Values are presented as mean ± SD unless otherwise indicated; Using the independent samples t-test, log MAR BCVA demonstrated significant differences between myopia group and high myopia group; The eyes were divided as myopic group and highly myopic group based on spherical diopter, spherical equivalent and axial length.
Table 2.
Identified peripheral retinal lesions in patients with myopia or high myopia
| Myopia (n = 79) | High myopia (n = 213) | p-value | |
|---|---|---|---|
| Barrier scar (n, %) | 10 (12.7) | 48 (22.5) | 0.060* |
| Cryotherapy scar (n, %) | 0 (0.0) | 1 (0.5) | 1.000† |
| Retinal detachment (n, %) | 1 (1.3) | 9 (4.2) | 0.297† |
| Retinal break (n, %) | 4 (5.1) | 16 (7.5) | 0.606† |
| Lattice degeneration (n, %) | 19 (24.1) | 78 (36.6) | 0.043* |
| Retinal pigmentation (n, %) | 1 (1.3) | 13 (6.1) | 0.086† |
| PVD (n, %) | 26 (32.9) | 86 (40.4) | 0.244* |
| PVR (n, %) | 1 (1.3) | 0 (0.0) | 0.271† |
| SE (n, %) | 0 (0.0) | 3 (1.4) | 0.566† |
| Vitreous opacity (n, %) | 0 (0.0) | 1 (0.5) | 1.000† |
| W s P (n, %) | 14 (17.7) | 44 (20.7) | 0.576* |
Table 3.
Detectability of peripheral retinal lesions using ultra-wide field scanning laser ophthalmoscope in patients with myopia or high myopia
Table 4.
Sensitivity and specificity of ultra-wide field scanning laser ophthalmoscope for detecting peripheral retinal lesions
 XML Download