Abstract
Purpose
To analyze the difference of the ganglion cell-inner plexiform layer (GCIPL) thickness in diabetic and normal eyes of patients using spectral domain optical coherence tomography (OCT) (Carl Zeiss Meditec, Dublin, CA, USA).
Methods
The authors compared and analyzed the difference of the GCIPL thickness measured with spectral domain optical coherence tomography (OCT) in 42 diabetic and 92 normal subjects.
Results
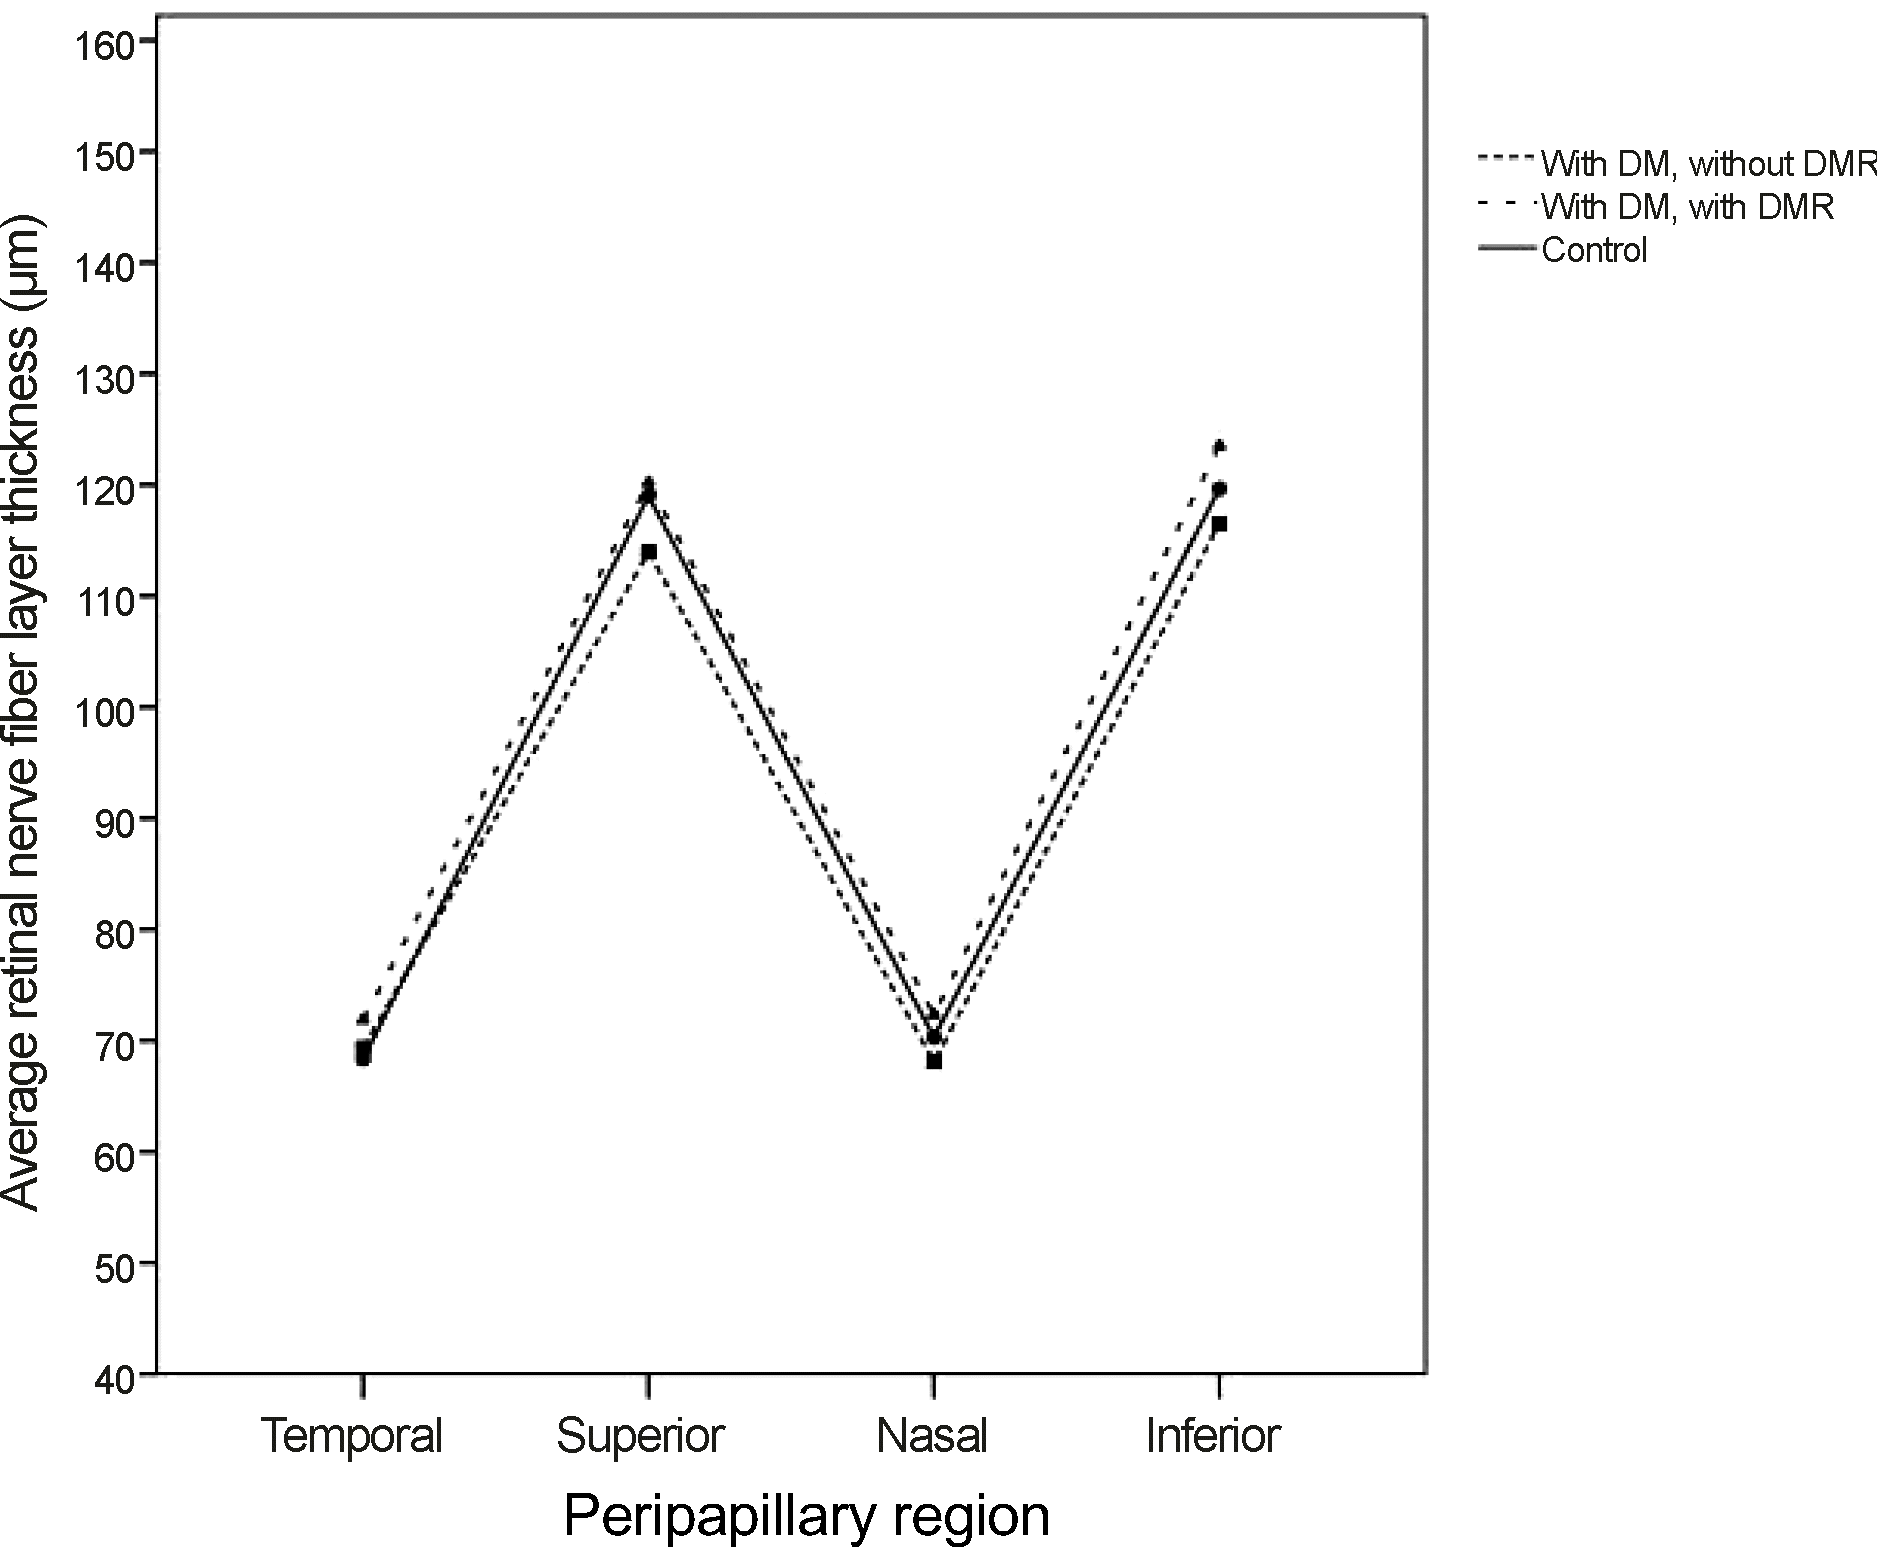
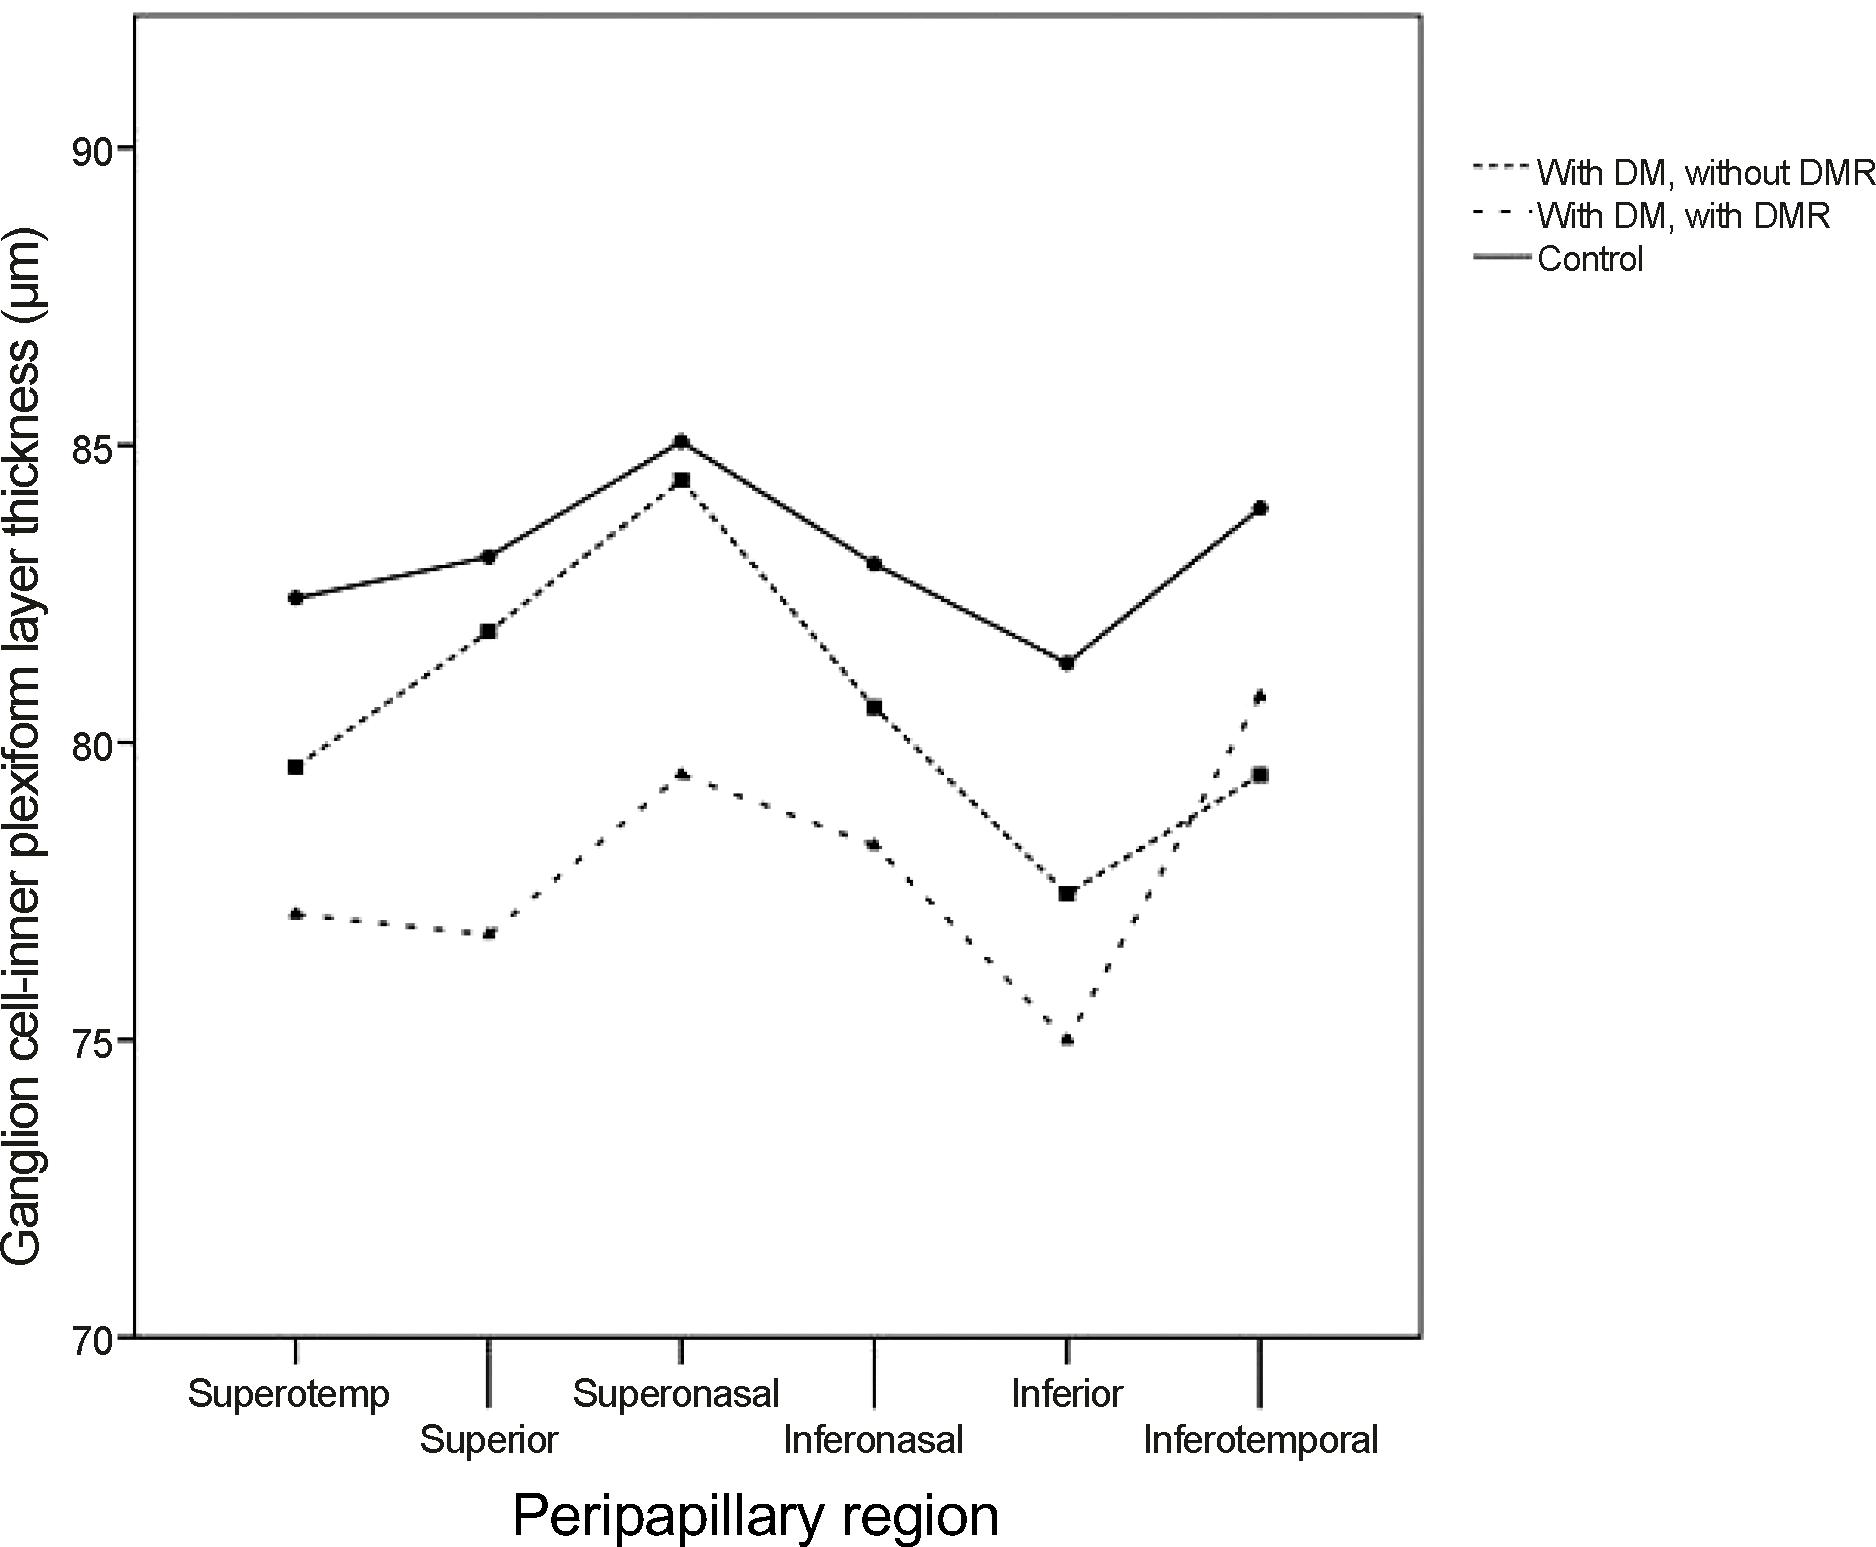
The study subjects were divided into 3 groups: 92 normal subjects, 22 diabetic patients without diabetic retinopathy, and 26 diabetic patients with diabetic retinopathy. Presence of diabetes mellitus (DM) or diabetic retinopathy did not influence the retinal nerve fiber layer (RNFL) thickness. The GCIPL thickness tended to be thinner especially in the superior sector GCIPL. The GCIPL thickness of normal subjects, diabetes patients without diabetic retinopathy, and diabetic retinopathy patients was 82.24 ± 7.21 μm, 81.86 ± 9.53 μm, and 76.77 ± 14.13 μm, respectively, especially in the superior sector GCIPL (p = 0.029).
References
1. Dyck PJ, Lais A, Karnes JL, et al. Fiber loss is primary and multifocal in sural nerves in diabetic polyneuropathy. Ann Neurol. 1986; 19:425–39.

2. Antonetti DA, Barber AJ, Bronson SK, et al. Diabetic retinopathy: seeing beyond glucose-induced microvascular disease. Diabetes. 2006; 55:2401–11.
3. Barber AJ, Lieth E, Khin SA, et al. Neural apoptosis in the retina during experimental and human diabetes. Early onset and effect of insulin. J Clin Invest. 1998; 102:783–91.

4. Barber AJ, Antonetti DA, Kern TS, et al. The Ins2Akita mouse as a model of early retinal complications in diabetes. Invest Ophthalmol Vis Sci. 2005; 46:2210–8.
5. Rungger-Brändle E, Dosso AA, Leuenberger PM. Glial reactivity, an early feature of diabetic retinopathy. Invest Ophthalmol Vis Sci. 2000; 41:1971–80.
6. Takahashi H, Goto T, Shoji T, et al. Diabetes-associated retinal nerve fiber damage evaluated with scanning laser polarimetry. Am J Ophthalmol. 2006; 142:88–94.

7. Lopes de Faria JM, Russ H, Costa VP. Retinal nerve fibre layer loss in patients with type 1 diabetes mellitus without retinopathy. Br J Ophthalmol. 2002; 86:725–8.

8. Ozdek S, Lonneville YH, Onol M, et al. Assessment of nerve fiber layer in diabetic patients with scanning laser polarimetry. Eye (Lond). 2002; 16:761–5.
9. Sugimoto M, Sasoh M, Ido M, et al. Detection of early diabetic change with optical coherence tomography in type 2 diabetes mellitus patients without retinopathy. Ophthalmologica. 2005; 219:379–85.

10. Lonneville YH, Ozdek SC, Onol M, et al. The effect of blood glucose regulation on retinal nerve fiber layer thickness in diabetic patients. Ophthalmologica. 2003; 217:347–50.

11. Zhang L, Ino-ue M, Dong K, Yamamoto M. Retrograde axonal transport impairment of large- and medium-sized retinal ganglion cells in diabetic rat. Curr Eye Res. 2000; 20:131–6.

12. Lieth E, Gardner TW, Barber AJ, Antonetti DA. Retinal neurodegeneration: early pathology in diabetes. Clin Experiment Ophthalmol. 2000; 28:3–8.

13. van Dijk HW, Verbraak FD, Kok PH, et al. Decreased retinal ganglion cell layer thickness in patients with type 1 diabetes. Invest Ophthalmol Vis Sci. 2010; 51:3660–5.

14. Garvin MK, Abràmoff MD, Wu X, et al. Automated 3-D intraretinal layer segmentation of macular spectral-domain optical coherence tomography images. IEEE Trans Med Imaging. 2009; 28:1436–47.

15. Photocoagulation for diabetic macular edema. Early Treatment Diabetic Retinopathy Study report number 1. Early Treatment Diabetic Retinopathy Study research group. Arch Ophthalmol. 1985; 103:1796–806.
16. Park HY, Kim IT, Park CK. Early diabetic changes in the nerve fibre layer at the macula detected by spectral domain optical coherence tomography. Br J Ophthalmol. 2011; 95:1223–8.

17. Mizutani M, Gerhardinger C, Lorenzi M. Müller cell changes in human diabetic retinopathy. Diabetes. 1998; 47:445–9.

18. Rungger-Brändle E, Dosso AA, Leuenberger PM. Glial reactivity, an early feature of diabetic retinopathy. Invest Ophthalmol Vis Sci. 2000; 41:1971–80.
19. Chung HS, Harris A, Halter PJ, et al. Regional differences in retinal vascular reactivity. Invest Ophthalmol Vis Sci. 1999; 40:2448–53.
20. Jonas JB, Naumann GO. Parapapillary retinal vessel diameter in normal and glaucoma eyes. II. Correlations. Invest Ophthalmol Vis Sci. 1989; 30:1604–11.
Figure 1.
Peripapillary retinal nerve fiber layer (RNFL) thickness of diabetic patients groups and control group. The illustration shows that the RNFL layer thickness had no difference among the 3 groups. DM = diabtes mellitus; DMR = diabetic retinopathy.

Figure 2.
Ganglion cell-inner plexiform layer (GCIPL) thickness of diabetic patients groups and control group. The illustration shows that the GCIPL thickness had tendency to be thinner in diabetic patients than norm al patients and in diabetic retinopathy than non-diabetic retinopathy diabetes mellitus patients. DM = diabtes mellitus; DMR = diabetic retinopathy.

Table 1.
Demographic characteristics of diabetic patients groups and control group
Table 2.
RNFL thickness of diabetic patients groups and control group
Table 3.
GCIPL thickness of diabetic patients groups and control group
| Control (n = 92) |
Diabetes mellitus |
p-value | ||
|---|---|---|---|---|
| No DMR (n = 22) | DMR (n = 26) | |||
| Average thickness (μm) | 81.77 ± 6.73 | 80.64 ± 8.59 | 77.96 ± 12.40 | 0.123 |
| Superotemporal thickness (μm) | 81.59 ± 7.97 | 79.59 ± 8.73 | 77.12 ± 11.88 | 0.074 |
| Superior thickness (μm) | 82.24 ± 7.21 | 81.86 ± 9.53 | 76.77 ± 14.13 | 0.029/0.031* |
| Superonasal thickness (μm) | 83.72 ± 7.76 | 84.41 ± 8.461 | 79.46 ± 17.94 | 0.154 |
| Inferiornasal thickness (μm) | 80.55 ± 8.40 | 80.59 ± 8.47 | 78.27 ± 11.43 | 0.298 |
| Inferior thickness (μm) | 79.13 ± 7.24 | 77.45 ± 9.52 | 75.00 ± 12.02 | 0.097 |
| Inferotemporal thickness (μm) | 82.39 ± 7.14 | 79.45 ± 10.13 | 80.77 ± 17.34 | 0.432 |
Table 4.
Macular thickness of diabetic patients groups and control group


 PDF
PDF ePub
ePub Citation
 Print
Print


 XML Download