

 PDF
PDF ePub
ePub Citation
 Print
Print


Abstract
Purpose
To investigate the effect of lens-corrected myopia on Humphrey Matrix and Humphrey Field Analyser (HFA).
Methods
A total of 59 lens-corrected myopic eyes of 59 normal volunteers underwent Humphrey Field Analyser and Humphrey Matrix (FDP) testing. Spherical equivalent divided into 3 groups: −3 ≤ D < 0, −6 ≤ D < −3, D < −6. HFA and FDP sensitivity for mean deviation (MD) and pattern standard deviation (PSD), as well as axial length and astigmatism, were compared between these 3 groups.
Results
The MD of the fields as determined by the HFA decreased significantly as the refractive errors increased, despite correction. However, there were no significant differences in MD or PSD of FDP, or in the PSD of HFA. There were no significant differences in axial length or astigmatism as calculated by MD and PSD for HFA and FDP.
Go to : 
References
1. Jung SK, Lee JH, Kakizaki H, Jee D. Prevalence of myopia and its association with body stature and educational level in 19-year-old male conscripts in seoul, South Korea. Invest Ophthalmol Vis Sci. 2012; 53:5579–83.

2. Lee JH, Jee D, Kwon JW, Lee WK. Prevalence and risk factors for myopia in a rural Korean population. Invest Ophthalmol Vis Sci. 2013; 54:5466–71.
3. Aung T, Foster PJ, Seah SK, et al. Automated static perimetry: the influence of myopia and its method of correction. Ophthalmology. 2001; 108:290–5.
4. Mitchell P, Hourihan F Sand, bach J, Wang JJ. The relationship between glaucoma and myopia: the Blue Mountains Eye Study. Ophthalmology. 1999; 106:2010–5.
5. Marcus MW, de Vries MM, Junoy Montolio FG, Jansonius NM. Myopia as a risk factor for open-angle glaucoma: a systematic review and meta-analysis. Ophthalmology. 2011; 118:1989–94.e2.
6. David R, Zangwill LM, Tessler Z, Yassur Y. The correlation between intraocular pressure and refractive status. Arch Ophthalmol. 1985; 103:1812–5.
7. Rudnicka AR, Edgar DF. Automated static perimetry in myopes with peripapillary crescents–Part II. Ophthalmic Physiol Opt. 1996; 16:416–29.
8. Kawabata H, Fujimoto N, Adachi-Usami E. [Sensitivity loss of short wavelength sensitive cones in myopic eyes by blue-on-yellow perimetry]. Nihon Ganka Gakkai Zasshi. 1997; 101:648–55.
9. Anand A, De Moraes CG, Teng CC, et al. Short-duration transient visual evoked potential for objective measurement of refractive errors. Doc Ophthalmol. 2011; 123:141–7.
10. Kawabata H, Adachi-Usami E. Multifocal electroretinogram in myopia. Invest Ophthalmol Vis Sci. 1997; 38:2844–51.
11. Johnson CA, Adams AJ, Casson EJ, Brandt JD. Blue-on-yellow perimetry can predict the development of glaucomatous visual field loss. Arch Ophthalmol. 1993; 111:645–50.
12. Kim JH, Kee C. The effect of myopic optical defocus on the humphrey matrix 30-2 test. J Korean Ophthalmol Soc. 2008; 49:119–24.
13. Cheon HC, Jeung WJ, Rho SH. The comparison of the matrix perimetry and humphrey standard perimetry in various patients group. J Korean Ophthalmol Soc. 2007; 48:678–85.
14. Anderson AJ, Johnson CA. Frequency-doubling technology perimetry and optical defocus. Invest Ophthalmol Vis Sci. 2003; 44:4147–52.
15. Tay E, Seah SK, Chan SP, et al. Optic disk ovality as an index of tilt and its relationship to myopia and perimetry. Am J Ophthalmol. 2005; 139:247–52.
16. Yoshii T, Matsuura T, Yukawa E, Hara Y. Effects of astigmatism on the Humphrey Matrix perimeter. Eur J Ophthalmol. 2009; 19:425–8.
Go to :
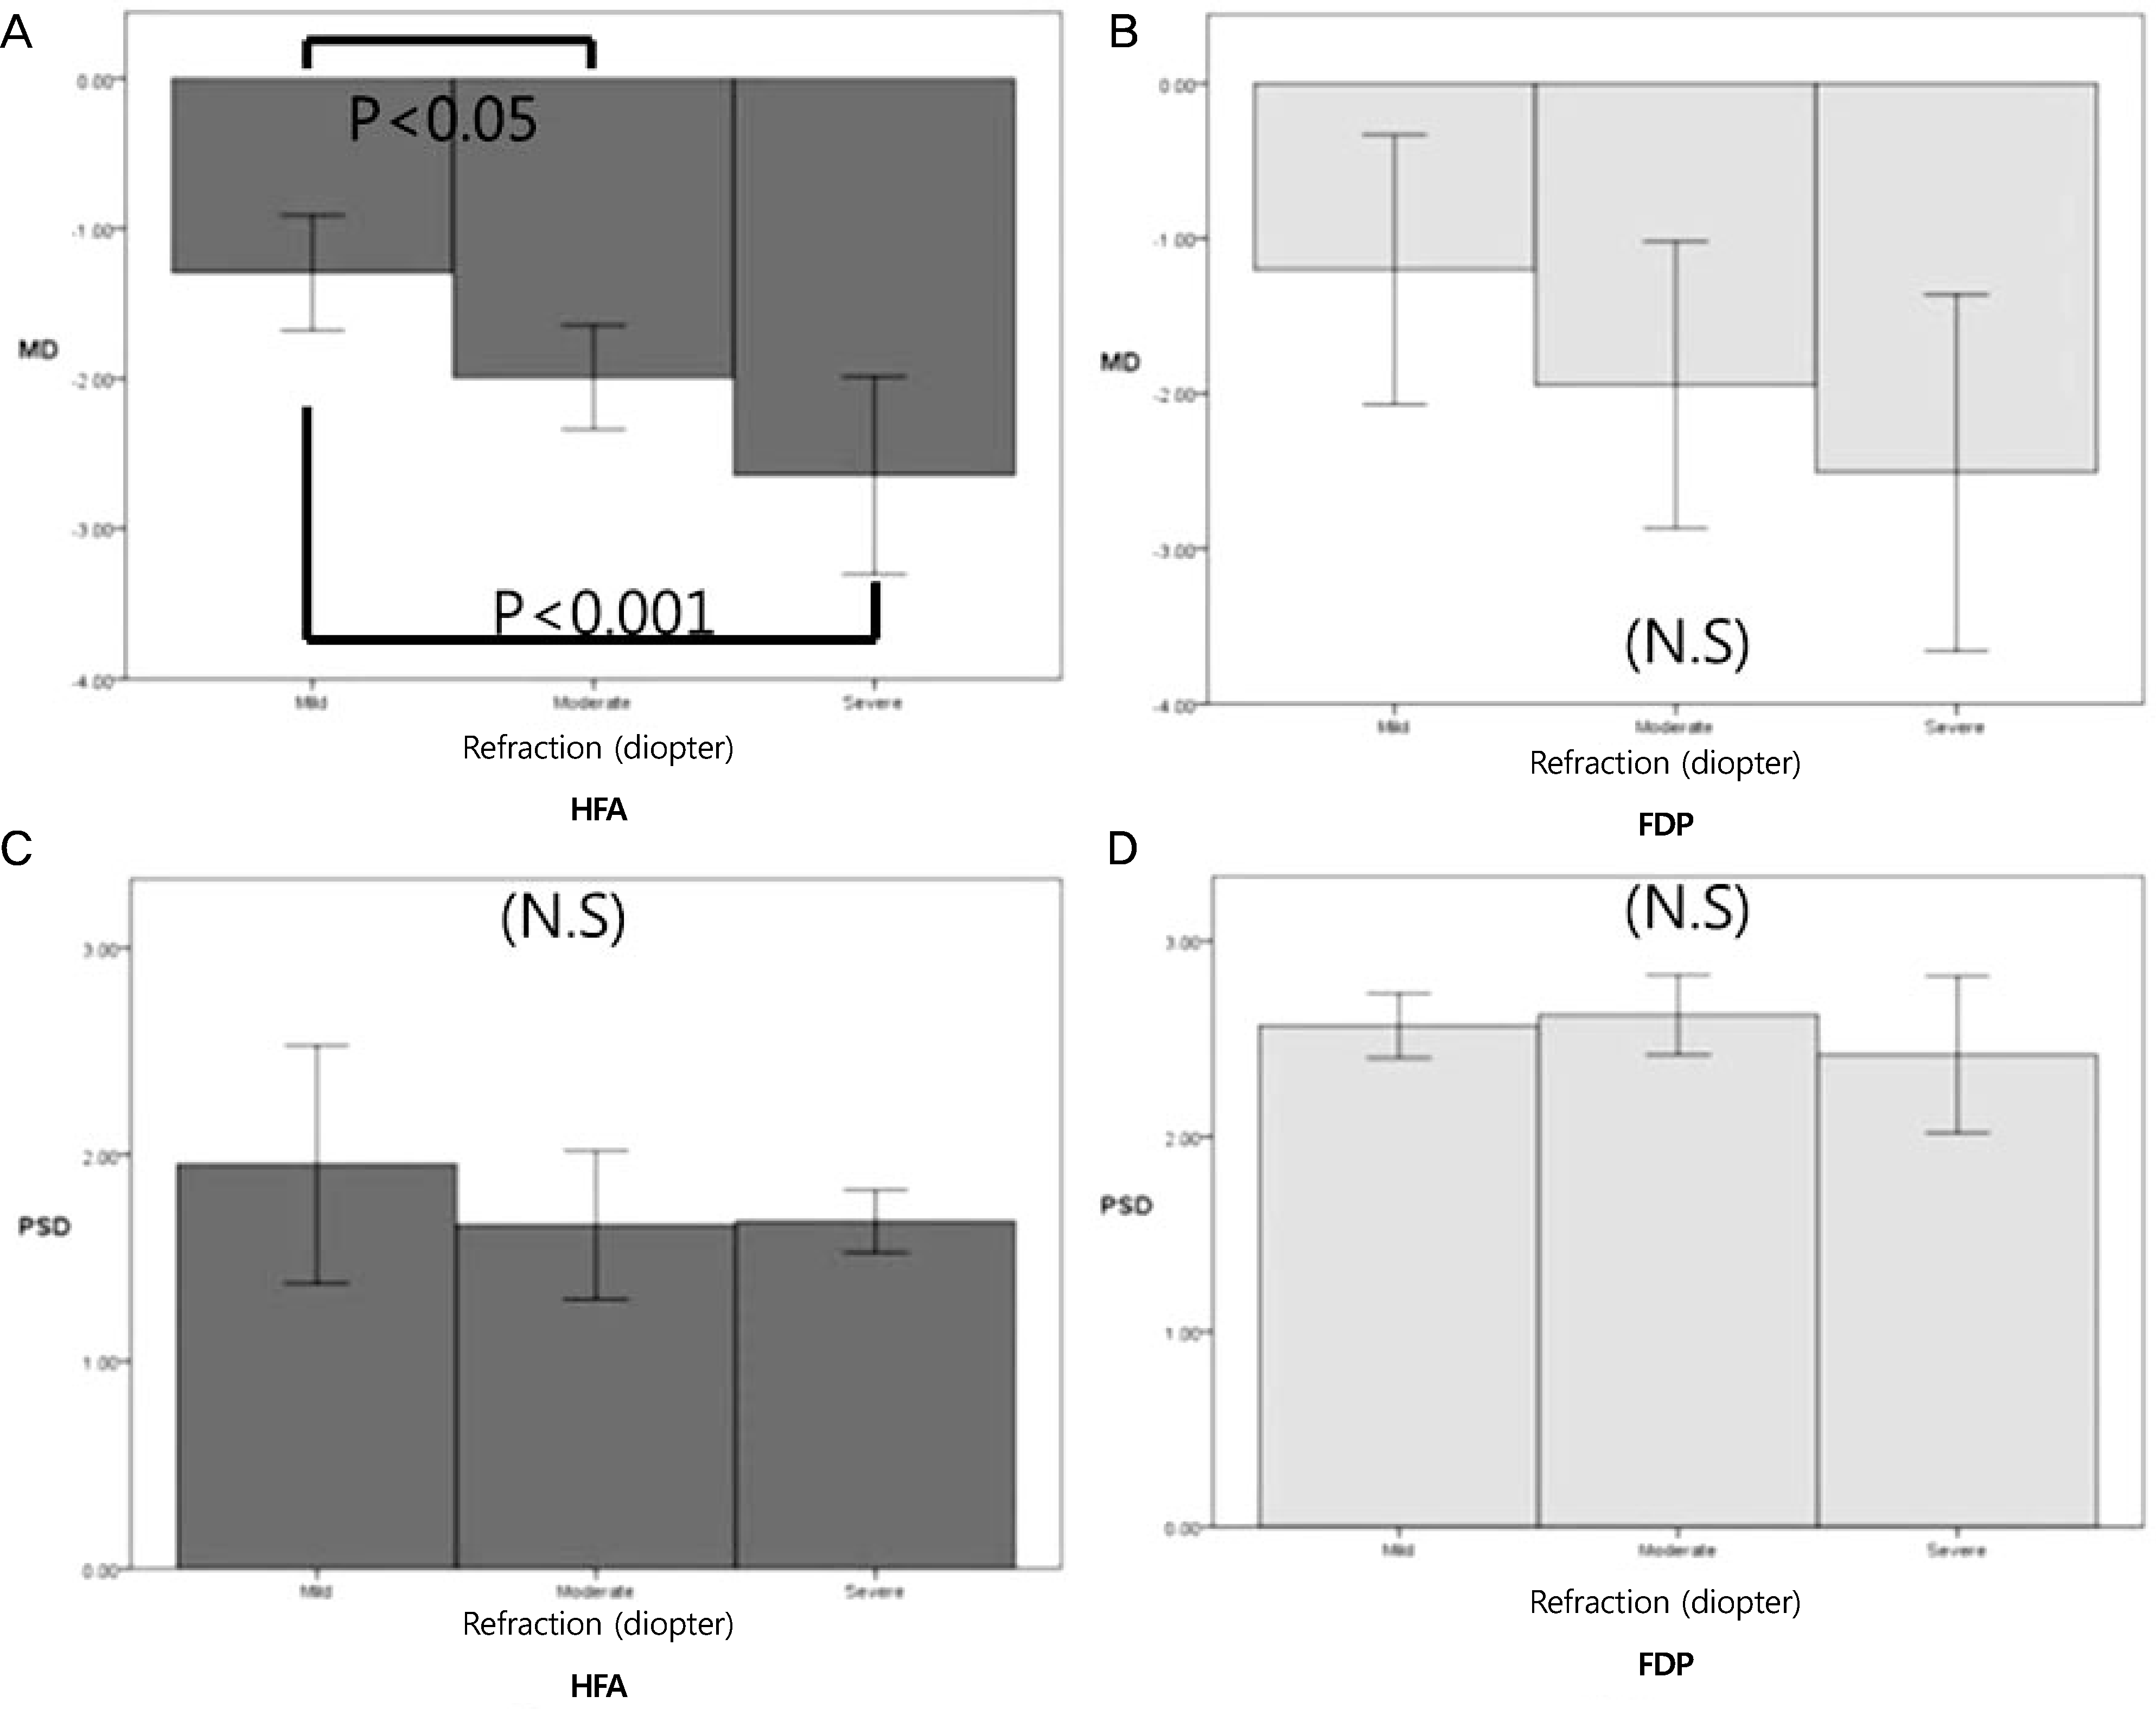 | Figure 1.Graph shows each groups of mean deviation (MD) and pattern standard deviation (PSD) for Humphrey Field Analyser (HFA), Humphrey Matrix (FDP) test. (A) The MD for HFA test shows moderate (p < 0.05) and severe myopia groups (p < 0.001) were significantly lower than mild group despite of correction. (B, C, D) MD for FDP, PSD for HFA, PSD for FDP shows not significant differences. FDP = frequency doubling perimeter. N.S = non specific. |
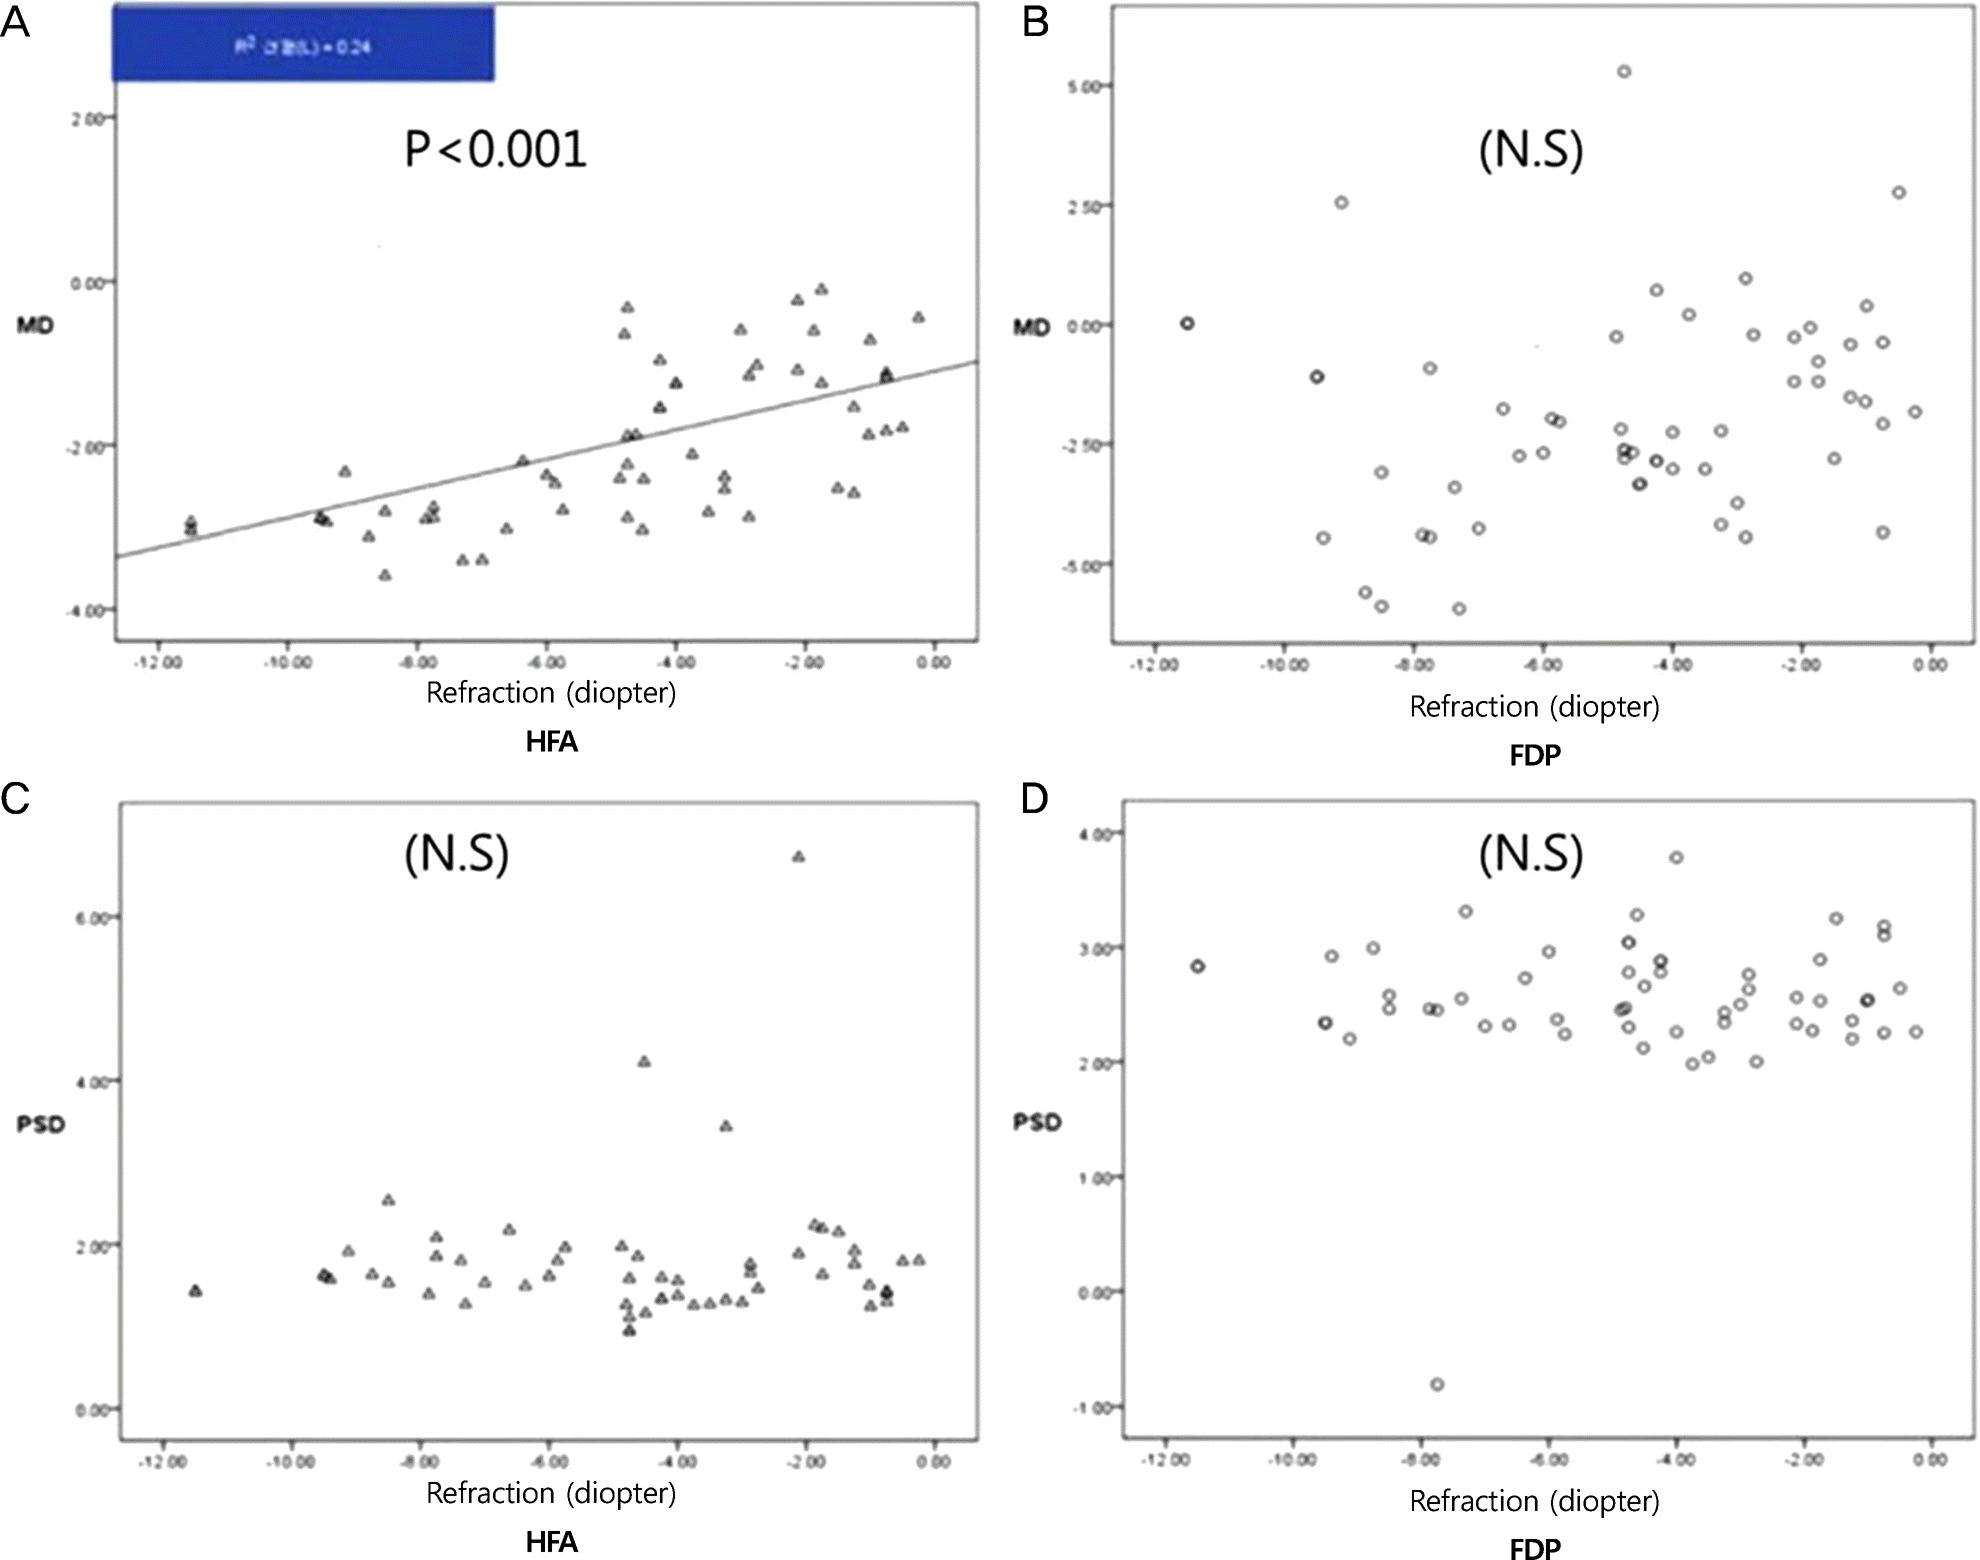 | Figure 2.Scatter diagram shows correlation of mean deviation (MD), pattern standard deviation (PSD) with refraction for Humphrey Field Analyser (HFA), PSD (A) positive correlation of MD for Humphrey Field Analyser test (B, C, D) others were not significantly different. FDP = frequency doubling perimeter. N.S = non specific. |
Table 1.
Number of subjects in each group, together with the means for age, refraction and visual field sensitivity
| Refraction* (diopter) | Number of eye† | Age‡ (years) | HFA MD (dB) | HFA PSD (dB) | FDP MD (dB) | FDP PSD (dB) | |
|---|---|---|---|---|---|---|---|
| Mild myopia (-3 ≤ D < 0) | −1.59 ± 0.86 | 19 | 24.58 ± 0.84 | −1.29 ± 0.79 | 1.95 ± 1.19 | −1.20 ± 1.80 | 2.56 ± 0.34 |
| Moderate myopia (-6 ≤ D < −3) | −4.50 ± 0.76 | 21 | 25.57 ± 2.71 | −1.99 ± 0.76 | 1.66 ± 0.79 | −1.95 ± 2.04 | 2.62 ± 0.45 |
| Severe myopia (D < −6) | −8.70 ± 1.58 | 19 | 24.74 ± 0.93 | −2.65 ± 1.37 | 1.68 ± 0.31 | −2.51 ± 2.38 | 2.42 ± 0.83 |
| Total | −4.91 ± 3.09 | 59 | 24.98 ± 1.80 | −1.98 ± 1.13 | 1.76 ± 0.84 | −1.89 ± 2.12 | 2.54 ± 0.57 |
 XML Download