Abstract
Purpose
In neovascular age-related macular degeneration (AMD), it is reported that retinal nerve fiber layer (RNFL) thickness becomes gradually thinner due to degeneration of the outer retinal layer. To our knowledge, there is no previous report regarding RNFL thickness in patients with non-neovascular AMD. Therefore, in this study, we compared RNFL thickness in patients with non-neovascular AMD and normal controls.
Methods
Thirty-one eyes with AMD category 3a (AREDS research group), 11 eyes suffering foveal geographic atrophy AMD category 4a, and 31 age-matched normal eyes were evaluated. In every group, regional RNFL thickness (General, Temporal, Superotemporal, Superonasal, Superior, Nasal, Inferonasal, Inferotemporal, and Inferior) was measured using spectral domain optical coherence tomography (SD-OCT).
Results
There were no significant differences in age or intraocular pressure among the 3 groups. The mean best corrected visual acuity (BCVA) (log MAR) of the category 4a group was significantly decreased compared to those of the other 2 groups. The mean RNFL thickness in total area in the category 3a group, category 4a group, and normal control group was 99.5 ± 14.0 µm, 99.3 ± 9.4 µm, and 99.4 ± 9.6 µm, respectively. The difference was not statistically significant. No other regional mean values of RNFL thickness in the three groups were significantly different.
References
1. Friedman DS, O'Colmain BJ, Muñoz B, et al. Prevalence of age-related macular degeneration in the United States. Arch Ophthalmol. 2004; 122:564–72.

2. Youm DJ, Oh HS, Yu HG, Song SJ. The prevalence of vitreoretinal diseases in a screened Korean population 50 years and older. J Korean Ophthalmol Soc. 2009; 50:1645–51.

3. Klein R, Klein BE, Knudtson MD, et al. Fifteen-year cumulative incidence of age-related macular degeneration: the Beaver Dam Eye Study. Ophthalmology. 2007; 114:253–62.
4. Medeiros NE, Curcio CA. Preservation of ganglion cell layer neurons in age-related macular degeneration. Invest Ophthalmol Vis Sci. 2001; 42:795–803.
5. Chen TC, Cense B, Pierce MC, et al. Spectral domain optical coherence tomography: ultra-high speed, ultra-high resolution ophthalmic imaging. Arch Ophthalmol. 2005; 123:1715–20.
6. Leung CK, Cheung CY, Weinreb RN, et al. Retinal nerve fiber layer imaging with spectral-domain optical coherence tomography: a variability and diagnostic performance study. Ophthalmology. 2009; 116:1257–63. 1263.e1-2.
7. Kim JS, Ishikawa H, Sung KR, et al. Retinal nerve fibre layer thickness measurement reproducibility improved with spectral domain optical coherence tomography. Br J Ophthalmol. 2009; 93:1057–63.

8. Age-Related Eye Disease Study Research Group. The Age-Related Eye Disease Study (AREDS): design implications. AREDS report no. 1. Control Clin Trials. 1999; 20:573–600.
9. Bowes Rickman C, Farsiu S, Toth CA, Klingeborn M. Dry age-related macular degeneration: mechanisms, therapeutic targets, and imaging. Invest Ophthalmol Vis Sci. 2013; 54:ORSF68–80.

10. Seddon JM, Willett WC, Speizer FE, Hankinson SE. A prospective study of cigarette smoking and age-related macular degeneration in women. JAMA. 1996; 276:1141–6.

11. Christen WG, Glynn RJ, Manson JE, et al. A prospective study of cigarette smoking and risk of age-related macular degeneration in men. JAMA. 1996; 276:1147–51.

12. Sommer A, Tielsch JM, Katz J, et al. Racial differences in the cause-specific prevalence of blindness in east Baltimore. N Engl J Med. 1991; 325:1412–7.

13. Hammond CJ, Webster AR, Snieder H, et al. Genetic influence on early age-related maculopathy: a twin study. Ophthalmology. 2002; 109:730–6.
14. Quigley HA, Katz J, Derick RJ, et al. An evaluation of optic disc and nerve fiber layer examinations in monitoring progression of early glaucoma damage. Ophthalmology. 1992; 99:19–28.

15. Kotowski J, Wollstein G, Ishikawa H, Schuman JS. Imaging of the optic nerve and retinal nerve fiber layer: an essential part of glaucoma diagnosis and monitoring. Surv Ophthalmol. 2014; 59:458–67. doi: 10.1016/j.survophthal.2013.04.007.Epub 2013 Oct 16.

16. Newman NM, Stevens RA, Heckenlively JR. Nerve fibre layer loss in diseases of the outer retinal layer. Br J Ophthalmol. 1987; 71:21–6.

17. Bush RA, Hawks KW, Sieving PA. Preservation of inner retinal responses in the aged Royal College of Surgeons rat. Evidence against glutamate excitotoxicity in photoreceptor degeneration. Invest Ophthalmol Vis Sci. 1995; 36:2054–62.
18. Curcio CA, Medeiros NE, Millican CL. Photoreceptor loss in age-related macular degeneration. Invest Ophthalmol Vis Sci. 1996; 37:1236–49.
19. Yuda K, Inoue Y, Tomidokoro A, et al. Nerve fiber layer thickness in exudative age-related macular degeneration in Japanese patients. Graefes Arch Clin Exp Ophthalmol. 2010; 248:353–9.

20. Oh JY, Chung TY, Kim DM, Yu HG. Assessment of retinal ganglion cell using retinal nerve fiber layer photography in age-related macular degeneration. J Korean Ophthalmol Soc. 2004; 45:2036–40.
21. Klaver CC, Wolfs RC, Vingerling JR, et al. Age-specific prevalence and causes of blindness and visual impairment in an older population: the Rotterdam Study. Arch Ophthalmol. 1998; 116:653–8.
22. Wang D, Huang Y, Huang C, et al. Association analysis of cigarette smoking with onset of primary open-angle glaucoma and glaucoma-related biometric parameters. BMC Ophthalmol. 2012; 12:59. doi: 10.1186/1471-2415-12-59.

23. Jiang X, Varma R, Wu S, et al. Baseline risk factors that predict the development of open-angle glaucoma in a population: the Los Angeles Latino Eye Study. Ophthalmology. 2012; 119:2245–53.
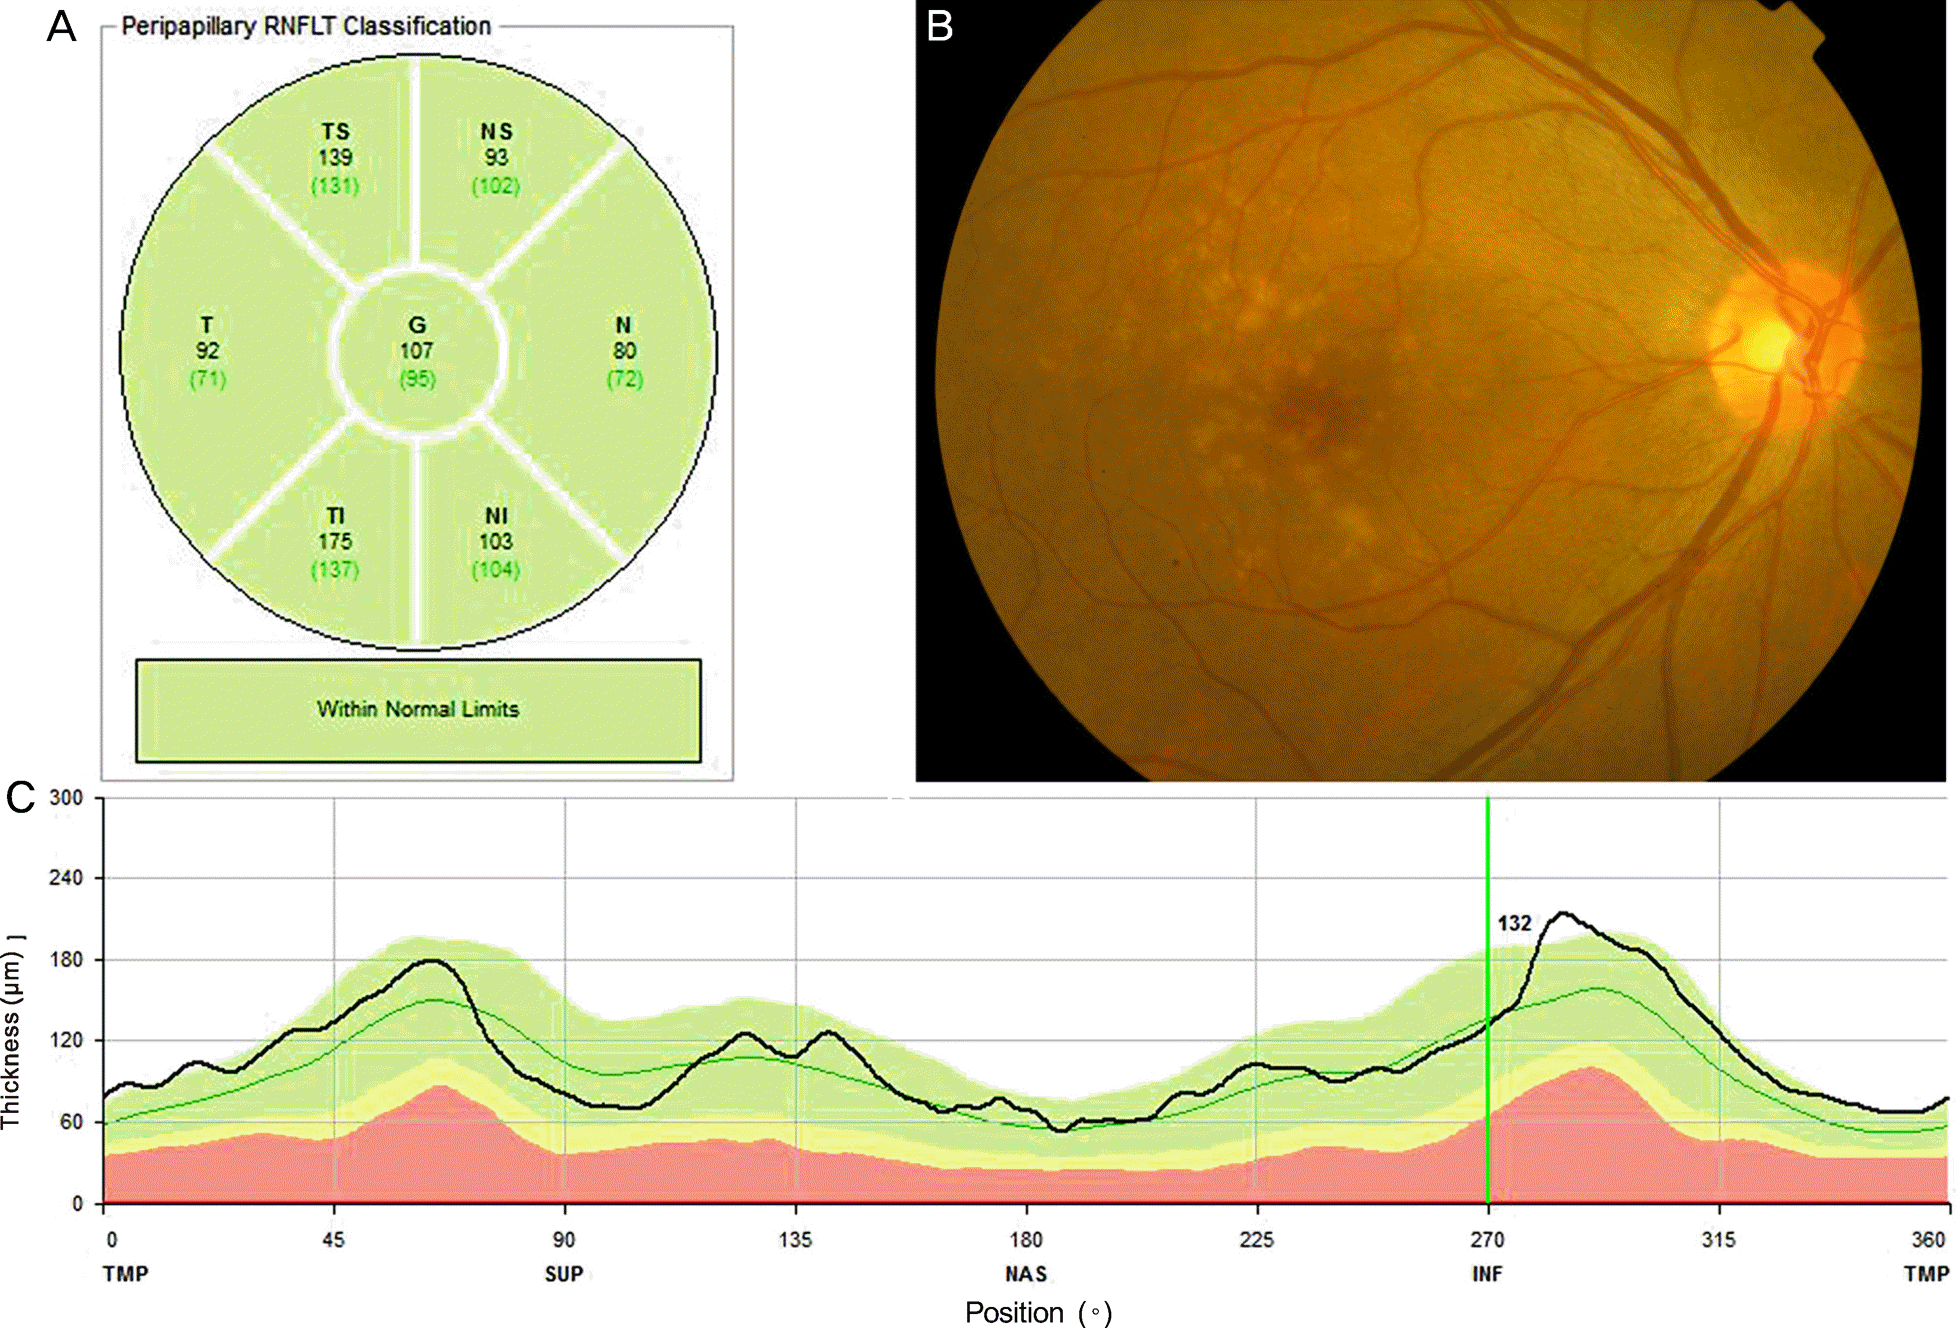
Figure 1.
Representative case of a 67-year old patient with non-neovascular age-related macular degeneration (AMD). (A) means retinal nerve fiber layer (RNFL) thickness of each region. (B) Fundus photography showed multiple large drusen. (C) Peripapillary RNFL thickness at 360 degree was within normal range in this patient. TS = temporosuperior; NS = nasosuperior; T = temporal; G = general; N = nasal; TI = temporoinferior; NI = nasoinferior; TMP = temporal; SUP = superior; NAS = nasal; INF = inferior.

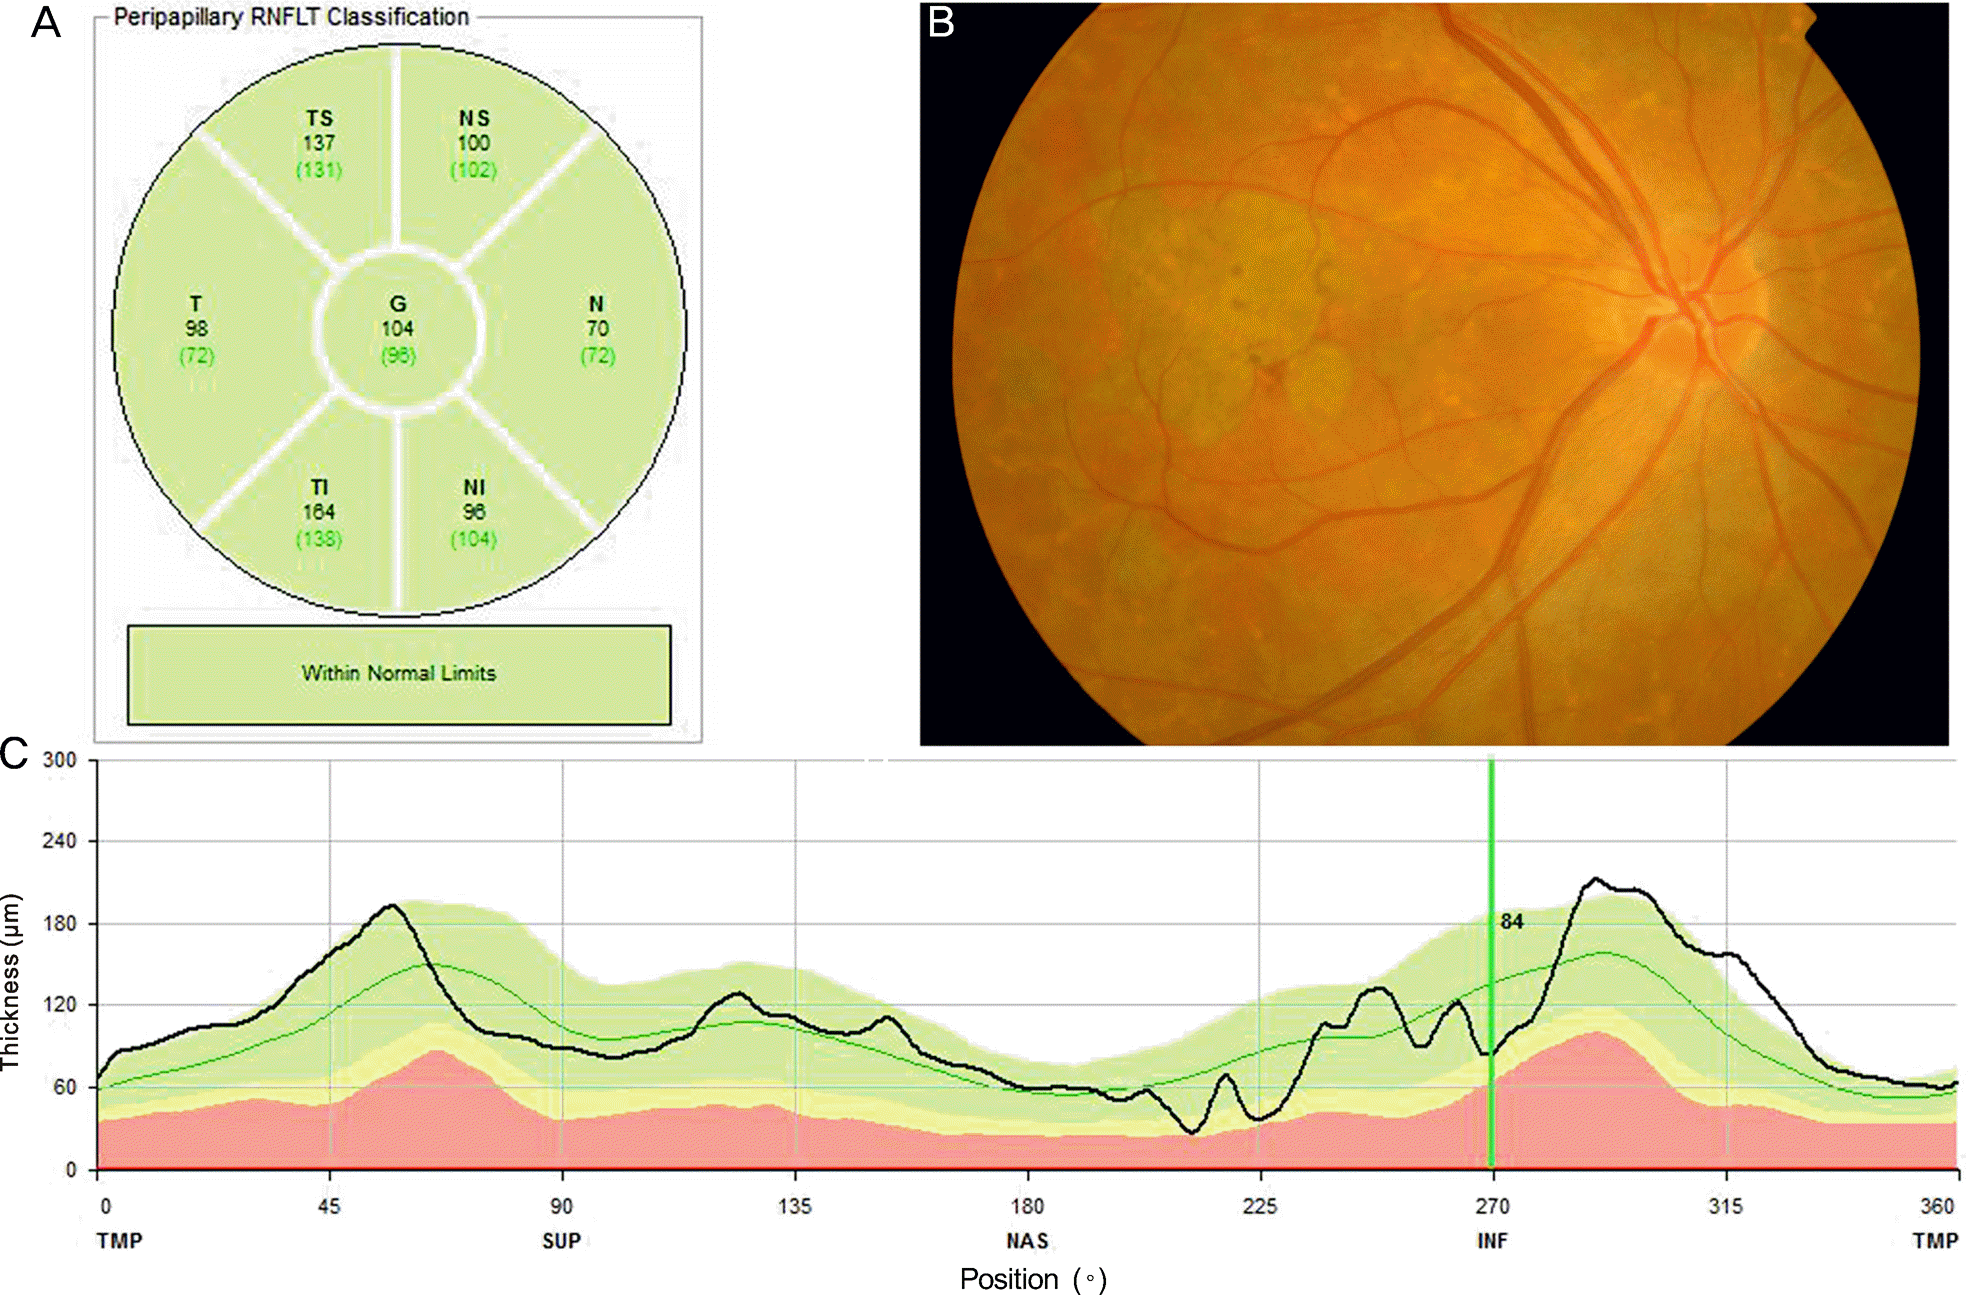
Figure 2.
Representative case of a 62-year old patient with non-neovascular age-related macular degeneration (AMD) with foveal geographic atrophy. (A) means retinal nerve fiber layer (RNFL) thickness of each region. (B) Fundus photography showed foveal geographic atrophy. (C) Peripapillary RNFL thickness at 360 degree was within normal range in this patient although there were local regions having slightly decreased thickness.

Table 1.
Baseline characteristics in each group
| Normal | Category 3a | Category 4a | p-value | |
|---|---|---|---|---|
| Eyes (n) | 31 | 31 | 11 | 0.488 |
| Age (years) | 69.7 ± 8.2 | 68.0 ± 6.4 | 69.6 ± 8.8 | |
| Sex* (M/F) | 13 (41.9%)/18 (58.1%) | 9 (29.0%)/22 (71.0%) | 9 (81.8%)/2 (18.26%) | 0.009 |
| BCVA (log MAR) | 0.122 ± 0.152 | 0.081 ± 0.113 | 1.295 ± 1.090 | <0.001 |
| IOP (mm Hg) | 13.4 ± 3.1 | 14.9 ± 2.4 | 14.6 ± 2.6 | 0.185 |
Table 2.
Retinal nerve fiber layer (RNFL) thickness at various location (μm)


 PDF
PDF ePub
ePub Citation
 Print
Print


 XML Download