Abstract
Purpose
To investigate the usefulness of the measurement of disc-to-fovea distance to disc-diameter ratio (DF/DD ratio) in detecting large and small discs.
Methods
A total of 300 randomly selected subjects were included in the present study. All patients underwent stereo-scopic disc photography and DF/DD ratio, which is the shortest distance between disc margin and fovea divided by mean disc diameter was determined by planimetry. The diagnostic accuracy of DF/DD ratio was evaluated using areas under the receiver operating characteristics curves (AUCs), sensitivity, and specificity.
Results
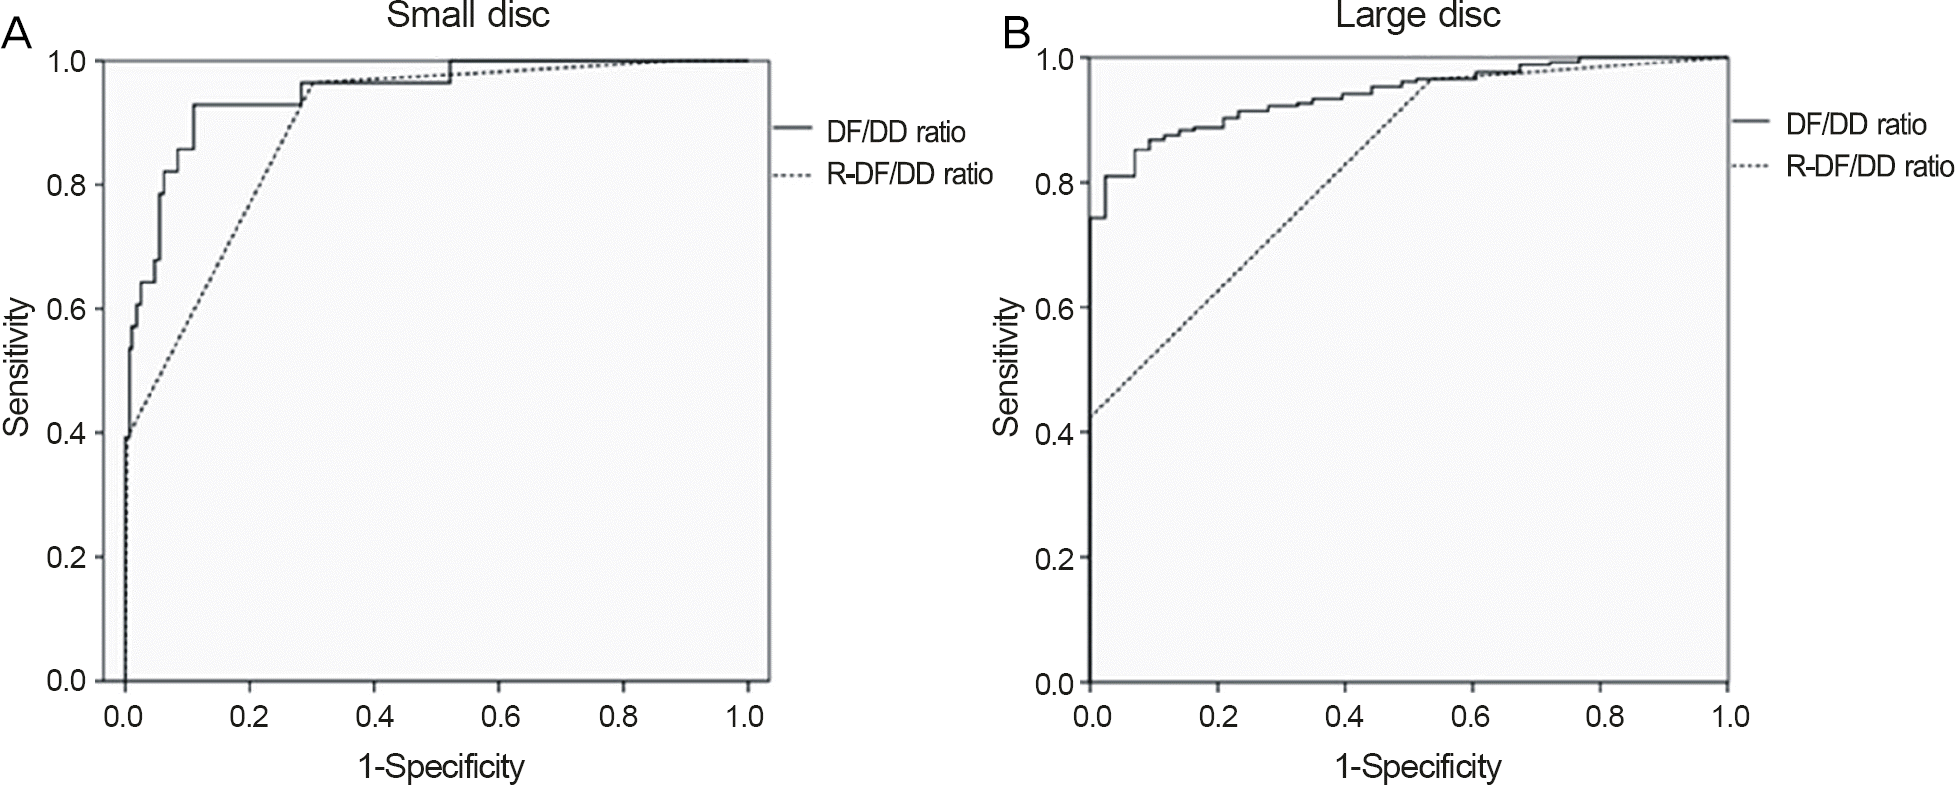
No significant differences in disc-to-fovea distance were observed among small and large disc groups. The DF/DD ratio was significantly lower in subjects with large discs (1.74 ± 0.27) compared with subjects with small discs (2.70 ± 0.15). AUCs of the DF/DD ratio were 0.942 and 0.947 in detecting large and small discs, respectively. In detecting disc size by a fixed DF/DD ratio of 2.0, sensitivity was 100% for both large and small discs, and specificity was 70.1% and 40.9% for the large and small discs, respectively.
Go to : 
References
1. Jonas JB, Budde WM, Panda-Jonas S. Ophthalmoscopic evaluation of the optic nerve head. Surv Ophthalmol. 1999; 43:293–320.

2. Savini G, Zanini M, Carelli V. . Correlation between retinal nerve fibre layer thickness and optic nerve head size: an optical co-herence tomography study. Br J Ophthalmol. 2005; 89:489–92.

3. Kaushik S, Pandav SS, Ichhpujani P, Gupta A. Correlation of fre-quency-doubling perimetry with retinal nerve fiber layer thickness and optic disc size in ocular hypertensives and glaucoma suspects. J Glaucoma. 2011; 20:366–70.

4. Iester M, Mikelberg FS, Drance SM. The effect of optic disc size on diagnostic precision with the Heidelberg retina tomograph. Ophthalmology. 1997; 104:545–8.

5. Bathija R, Zangwill L, Berry CC. . Detection of early glaucom-atous structural damage with confocal scanning laser tomography. J Glaucoma. 1998; 7:121–7.

6. Medeiros FA, Zangwill LM, Bowd C. . Influence of disease se-verity and optic disc size on the diagnostic performance of imaging instruments in glaucoma. Invest Ophthalmol Vis Sci. 2006; 47:1008–15.

7. Ferreras A, Pajarin AB, Polo V. . Diagnostic ability of Heidelberg Retina Tomograph 3 classifications: glaucoma probability score versus Moorfields regression analysis. Ophthalmology. 2007; 114:1981–7.
8. Hoesl LM, Mardin CY, Horn FK. . Influence of glaucomatous damage and optic disc size on glaucoma detection by scanning la-ser tomography. J Glaucoma. 2009; 18:385–9.

9. Tuulonen A, Airaksinen PJ. Optic disc size in exfoliative, primary open angle, and low-tension glaucoma. Arch Ophthalmol. 1992; 110:211–3.

10. Quigley HA, Brown AE, Morrison JD, Drance SM. The size and shape of the optic disc in normal human eyes. Arch Ophthalmol. 1990; 108:51–7.

11. Jonas JB, Fernandez MC, Naumann GO. Correlation of the optic disc size to glaucoma susceptibility. Ophthalmology. 1991; 98:675–80.

12. Bayer A, Harasymowycz P, Henderer JD. . Validity of a new disk grading scale for estimating glaucomatous damage: correlation with visual field damage. Am J Ophthalmol. 2002; 133:758–63.

13. Oddone F, Centofanti M, Rossetti L. . Exploring the Heidelberg Retinal Tomograph 3 diagnostic accuracy across disc sizes and glaucoma stages: a multicenter study. Ophthalmology. 2008; 115:1358–65.
14. Mok KH, Lee VW. Disc-to-macula distance to disc-diameter ratio for optic disc size estimation. J Glaucoma. 2002; 11:392–5.

15. Alvarez E, Wakakura M, Khan Z, Dutton GN. The disc-macula distance to disc diameter ratio: a new test for confirming optic nerve hypoplasia in young children. J Pediatr Ophthalmol Strabismus. 1988; 25:151–4.

16. Wakakura M, Alvarez E. A simple clinical method of assessing patients with optic nerve hypoplasia. The disc-macula distance to disc diameter ratio (DM/DD). Acta Ophthalmol. 1987; 65:612–7.
Go to : 
 | Figure 1.Receiver operating characteristic (ROC) curve of the DF/DD ratio and R-DF/DD ratio for detection of small disc (A) and large disc (B). DF/DD ratio = disc-to-fovea distance to disc-diameter ratio; R-DF/DD ratio = round up scale of disc-to-fovea distance to disc-diameter ratio. |
Table 1.
Distribution of patients
| Disc size | Round up scale of disc-to-fovea distance to disc-diameter ratio | ||||
|---|---|---|---|---|---|
| 1.50 Group* | 2.00 Group† | 2.50 Group‡ | 3.00 Group§ | Total | |
| Small disc∏ | 0 | 1 | 16 | 11 | 28 |
| Medium disc# | 9 | 138 | 81 | 1 | 229 |
| Large disc** | 20 | 23 | 0 | 0 | 43 |
| Total | 29 | 162 | 97 | 12 | 300 |
Table 2.
Sensitivity and specificity of the DF/DD ratio and R-DF/DD ratio scales for diagnosing small and large disc
| Parameter | Scale | Small disc* | Large disc† | ||
|---|---|---|---|---|---|
| Sensitivity (%) | Specificity (%) | Sensitivity (%) | Specificity (%) | ||
| DF/DD ratio | 2.0 | 100 | 40.9 | 100 | 70.2 |
| R‐ DF/DD ratio | 1.5 | 100 | 0.0 | 71.4 | 96.7 |
| 2.0 | 100 | 10.9 | 100 | 39.7 | |
| 2.5 | 97.7 | 73.9 | 100 | 4.4 | |
| 3.0 | 4.3 | 99.6 | 100 | 0.0 | |
Table 3.
Comparison of disc diameter and disc area between R-DF/DD ratio groups
| 1.50 Group* (n = 29) | 2.00 Group† (n = 162) | 2.50 Group‡ (n = 97) | 3.00 Group§ (n = 12) | |
|---|---|---|---|---|
| VDD (mm) | 2.18 ± 0.27 | 1.94 ± 0.19 | 1.69 ± 0.14 | 1.58 ± 0.07 |
| HDD (mm) | 2.03 ± 0.14 | 1.73 ± 0.14 | 1.48 ± 0.11 | 1.21 ± 0.12 |
| DD (mm) | 2.10 ± 0.18 | 1.84 ± 0.15 | 1.58 ± 0.09 | 1.39 ± 0.07 |
| DA (mm2) | 3.39 ± 0.52 | 2.66 ± 0.44 | 1.98 ± 0.24 | 1.47 ± 0.16 |


 PDF
PDF ePub
ePub Citation
 Print
Print


 XML Download