

 PDF
PDF ePub
ePub Citation
 Print
Print


Abstract
Purpose
To determine the influence of morphologic classification based on optical coherence tomography (OCT) on epi-retinal membrane (ERM) surgery outcomes.
Methods
We retrospectively reviewed the medical records of 77 eyes with ERM treated by vitrectomy with ERM peeling. By using OCT, the preoperative ERM was classified into four types: diffuse (DIF), cystoids macular edema (CME), pseudo-lamellar hole (PLH), and vitreomacular traction (VMT). The postoperative changes of central macular thickness (CMT) and best-corrected visual acuity (BCVA) were compared.
Results
Approximately six months postoperatively, the DIF type had the best BCVA for both idiopathic and secondary ERM, followed by the PLH, CME, and VMT types. On the other hand, regarding the mean BCVA improvement, the VMT type was the best, followed by the DIF, PLH, and CME types. When comparing the difference in BCVA improvement by each type, idiopathic ERM showed a clearer distinction when the inner segment/outer segment (IS/OS) junction was not disrupted.
Go to : 
References
1. Margherio RR, Cox MS Jr, Trese MT, et al. Removal of epimacular membranes. Ophthalmology. 1985; 92:1075–83.

2. Michels RG. Vitrectomy for macular pucker. Ophthalmology. 1984; 91:1384–8.
3. Wise GN. Clinical features of idiopathic preretinal macular fibrosis. Schoenberg Lecture. Am J Ophthalmol. 1975; 79:349–7.
4. Hillenkamp J, Saikia P, Gora F, et al. Macular function and mor-phology after peeling of idiopathic epiretinal membrane with and without the assistance of indocyanine green. Br J Ophthalmol. 2005; 89:437–43.
5. Arndt C, Rebollo O, Séguinet S, et al. Quantification of meta-morphopsia in patients with epiretinal membranes before and after surgery. Graefes Arch Clin Exp Ophthalmol. 2007; 245:1123–9.
6. Wong JG, Sachdev N, Beaumont PE, et al. Visual outcomes fol-lowing vitrectomy and peeling of epiretinal membrane. Clin Experiment Ophthalmol. 2005; 33:373–8.
7. Hassenstein A, Scholz F, Richard G. [OCT in epiretinal gliosis]. Ophthalmologe. 2005; 102:127–32.
8. Park SJ, Lee JH. Clinical feature of macular preretinal membrane and visual changes after vitrectomy. J Korean Ophthalmol Soc. 1994; 35:824–9.
9. Rice TA, De Bustros S, Michels RG, et al. Prognostic factors in vi-trectomy for epiretinal membranes of the macula. Ophthalmology. 1986; 93:602–10.
10. Niwa T, Terasaki H, Kondo M, et al. Function and morphology of macula before and after removal of idiopathic epiretinal membrane. Invest Ophthalmol Vis Sci. 2003; 44:1652–6.
11. Wilkins JR, Puliafito CA, Hee MR, et al. Characterization of epiretinal membranes using optical coherence tomography. Ophthalmology. 1996; 103:2142–51.
12. Massin P, Allouch C, Hanouchine B, et al. Optical coherence to-mography of idiopathic macular epiretinal membranes before and after surgery. Am J Ophthalmol. 2000; 130:732–9.
13. Kim CH, Kim JI, Cho HY, Kang SW. Correlation between pre-operative OCT pattern and visual improvement in macular epi-retinal membrane. J Korean Ophthalmol Soc. 2007; 48:75–82.
14. Suh MH, Seo JM, Park KH, Yu HG. Associations between macular findings by optical coherence tomography and visual outcomes af-ter epiretinal membrane removal. Am J Ophthalmol. 2009; 147:473–80.
15. Kinoshita T, Kovacs KD, Wagley S, Arroyo JG. Morphologic dif-ferences in epiretinal membranes on ocular coherence tomography as a predictive factor for surgical outcome. Retina. 2011; 31:1692–8.
16. Green WR, Kenyon KR, Michels RG, et al. Ultrastructure of epi-retinal membranes causing macular pucker after retinal reattach-ment surgery. Trans Ophthalmol Soc U K. 1979; 99:65–77.
17. Smiddy WE, Michels RG, Glaser BM, et al. Vitrectomy for mac-ular traction caused by incomplete vitreous separation. Arch Ophthalmol. 1988; 106:624–8.
18. Smiddy WE, Maguire AM, Green WR, et al. Idiopathic epiretinal membranes. Ultrastructural characteristics and clinic pathologic correlation. Ophthalmology. 1989; 96:811–20; discussion 821.
19. Gastaud P, Bétis F, Rouhette H, Hofman P. Ultrastructural findings of epimacular membrane and detached posterior hyaloid in vitre-omacular traction syndrome. J Fr Ophthalmol. 2000; 23:587–93.
20. Puliafito CA, Hee MR, Lin CP, et al. Imaging of macular diseases with optical coherence tomography. Ophthalmology. 1995; 102:217–29.
21. Koizumi H, Spaide RF, Fisher YL, et al. Three-dimensional evalu-ation of vitreomacular traction and epiretinal membrane using spectral-domain optical coherence tomography. Am J Ophthalmol. 2008; 145:509–17.
22. Mori K, Gehlbach PL, Sano A, et al. Comparison of epiretinal membranes of differing pathogenesis using optical coherence tomography. Retina. 2004; 24:57–62.
23. Dugas B, Ouled-Moussa R, Lafontaine P, et al. Idiopathic epi-retinal macular membrane and cataract extraction: combined ver-sus consecutive surgery. Am J Ophthalmol. 2010; 149:302–6.
24. Muselier A, Dugas B, Burelle X, et al. Macular hole surgery and cataract extraction: combined vs consecutive surgery. Am J Ophthalmol. 2010; 150:387–91.
Go to :
 | Figure 1.The type of macular epiretinal membrane (ERM) in OCT images. (A) The DIF type: The DIF type shows globally adherent membrane widely covering macular area in the sur-face of retina, diffuse edema and increasing retinal thickness, (B) The CME type: The CME type shows globally adherent membrane and the formation of intraretinal cystoids space, (C) The PLH type: The PLH type shows steepened foveal pit, (D) The VMT type: The VMT type shows a focal and adherent membrane bridging between vitreous and retina. |
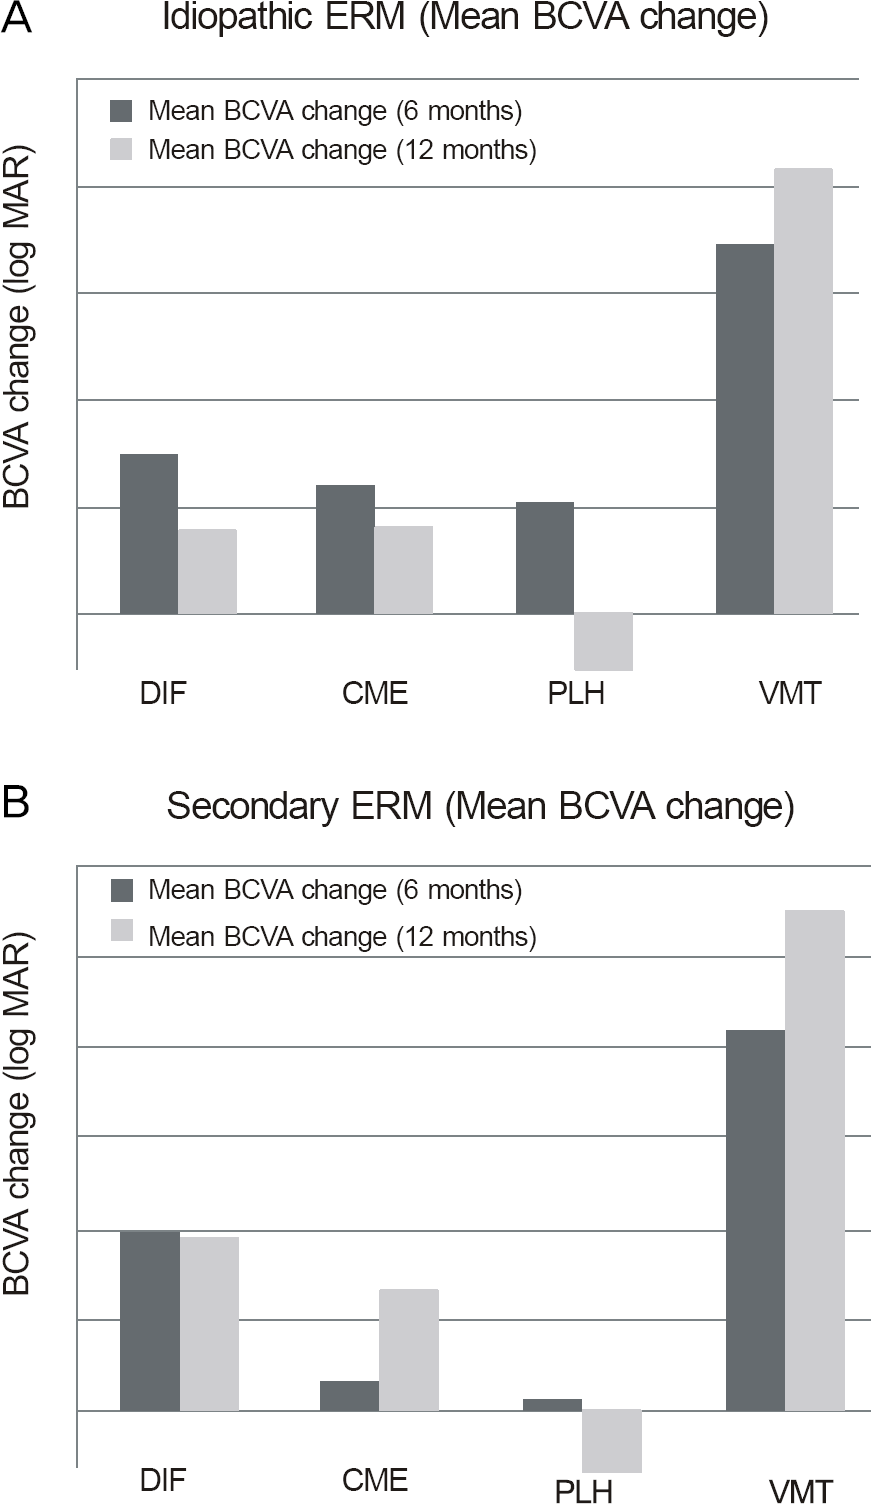 | Figure 2.Mean BCVA change in each type. (A) Idiopathic ERM, VMT > DIF > CME > PLH, (B) Secondary ERM, VMT > DIF > CME > PLH. BCVA = best corrected visual acuity; ERM = epiretinal membrane; DIF = diffuse; CME = cystoid macular edema; PLH = pseudolamellar hole; VMT = vitreomaculartraction. |
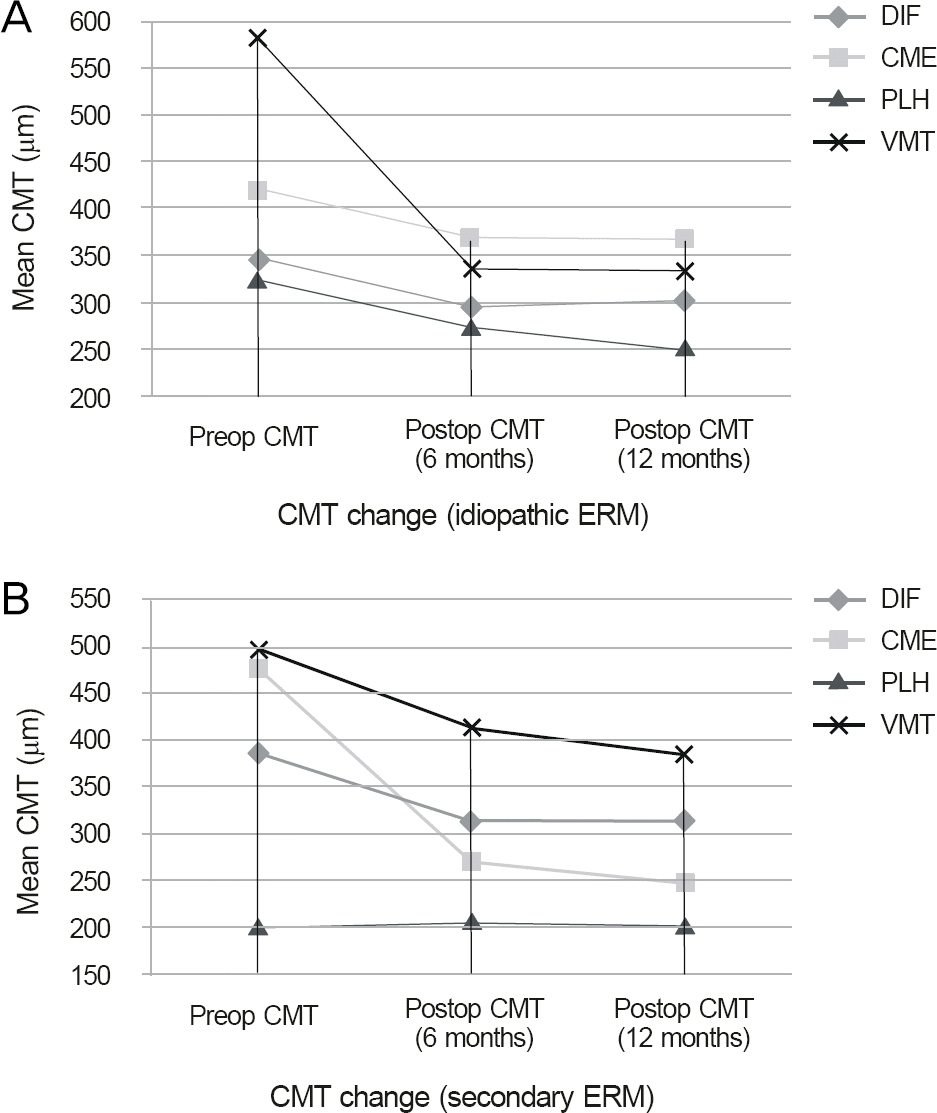 | Figure 3.CMT change in each type. (A) Idiopathic ERM, VMT > CME > DIF > PLH, (B) Secondary ERM, CME > VMT > DIF > PLH. CMT = central macualr thickness; ERM = epiretinal membrane; DIF = diffuse; CME = cystoid macular edema; PLH = pseudolamellar hole; VMT = vitreo- maculartraction. |
Table 1.
Preoperative demographic and clinical characteristics of the patients
| Total | DIF | CME | PLH | VMT | p-value | ||
|---|---|---|---|---|---|---|---|
| Total | Number of eyes | 77 | 33 | 23 | 13 | 8 | |
| Gender (F:M) | 53:24 | 21:12 | 17:6 | 10:3 | 5:3 | 0.767* | |
| Age (years) | 64.7 ± 9.6 | 64.9 ± 9.8 | 63.3 ± 9.5 | 65.5 ± 8.6 | 66.3 ± 11.3 | 0.760† | |
| Number of combination with Phaco with PCL (%) | 51 (66.2) | 21 (66.7) | 14 (60.9) | 10 (76.9) | 6 (75) | 0.792* | |
| Idiopathic | Number of eyes | 50 | 22 | 11 | 11 | 5 | |
| Gender (F:M) | 38:12 | 16:6 | 8:3 | 9:2 | 4:1 | 0.961* | |
| Age (years) | 66.7 ± 8.9 | 67.2 ± 9.4 | 66 ± 7.7 | 64.7 ± 9.1 | 69.6 ± 11.6 | 0.788† | |
| Number of combination with Phaco with PCL (%) | 35 (71.4) | 13 (59.1) | 9 (81.8) | 9 (81.8) | 4 (80) | 0.501* | |
| Secondary | Number of eyes | 28 | 11 | 12 | 2 | 3 | |
| Gender (F:M) | 16:12 | 5:6 | 9:3 | 1:1 | 1:2 | 0.377* | |
| Age (years) | 60.9 ± 9.6 | 60.3 ± 9.3 | 60.8 ± 10.7 | 70 ± 1.41 | 60.7 ± 10.0 | 0.738† | |
| Number of combination with Phaco with PCL (%) | 16 (57.1) | 8 (72.7) | 5 (41.7) | 1 (50) | 2 (66.7) | 0.697* |
Table 2.
Preoperative & postoperative log MAR visual acuity & mean BCVA change according to ERM type
| DIF | CME | PLH | VMT | p-value* | ||
|---|---|---|---|---|---|---|
| Total | Preoperative BCVA | 0.66 ± 0.34 | 0.74 ± 0.29 | 0.55 ± 0.81 | 1.50 ± 1.01 | 0.002† |
| Postoperative BCVA (6 months) | 0.27 ± 0.21 | 0.59 ± 0.37 | 0.37 ± 0.23 | 0.76 ± 0.43 | <0.001† | |
| Postoperative BCVA (12 months) | 0.38 ± 0.60 | 0.52 ± 0.37 | 0.42 ± 0.50 | 0.71 ± 0.48 | 0.030† | |
| Mean BCVA change (6 months) | 0.39 ± 0.30 | 0.16 ± 0.30 | 0.18 ± 0.75 | 0.75 ± 0.80 | 0.001† | |
| Mean BCVA change (12 months) | 0.27 ± 0.58 | 0.23 ± 0.24 | -0.12 ± 0.30 | 0.92 ± 0.75 | <0.001† | |
| Idiopathic | Preoperative BCVA | 0.66 ± 0.31 | 0.62 ± 0.27 | 0.58 ± 0.88 | 1.27 ± 0.97 | 0.029† |
| Postoperative BCVA (6 months) | 0.27 ± 0.22 | 0.38 ± 0.23 | 0.37 ± 0.21 | 0.57 ± 0.20 | 0.045† | |
| Postoperative BCVA (12 months) | 0.45 ± 0.82 | 0.43 ± 0.32 | 0.39 ± 0.32 | 0.43 ± 0.19 | 0.419† | |
| Mean BCVA change (6 months) | 0.38 ± 0.29 | 0.24 ± 0.23 | 0.21 ± 0.88 | 0.70 ± 0.93 | 0.034† | |
| Mean BCVA change (12 months) | 0.16 ± 0.76 | 0.17 ± 0.18 | -0.12 ± 0.33 | 0.84 ± 0.83 | 0.004† | |
| Secondary | Preoperative BCVA | 0.69 ± 0.39 | 0.86 ± 0.26 | 0.40 ± 0.43 | 1.90 ± 1.15 | 0.058† |
| Postoperative BCVA (6 months) | 0.28 ± 0.22 | 0.78 ± 0.37 | 0.37 ± 0.46 | 1.06 ± 0.58 | 0.006† | |
| Postoperative BCVA (12 months) | 0.30 ± 0.24 | 0.58 ± 0.27 | 0.52 ± 0.67 | 1.40 ± 0.39 | 0.025† | |
| Mean BCVA change (6 months) | 0.40 ± 0.30 | 0.07 ± 0.34 | 0.03 ± 0.04 | 0.84 ± 0.68 | 0.019† | |
| Mean BCVA change (12 months) | 0.39 ± 0.27 | 0.27 ± 0.27 | -0.13 ± 0.25 | 1.10 ± 0.70 | 0.042† |
Table 3.
Proportion of inner segment/outer segment (IS/OS) Junction Disruption according to ERM type
| DIF | CME | PLH | VMT | p-value* | ||
|---|---|---|---|---|---|---|
| Preoperative BCVA | 0.67±0.32 | 0.61±0.32 | 0.63±0.99 | 0.82±0 | 0.246† | |
| IS/OS Junction disruption | Total | 18.2% | 60.9% | 30.8% | 87.5% | 0.001§ |
| Idiopathic | 13.6% | 45.5% | 36.4% | 80.0% | 0.022§ | |
| Secondary | 27.3% | 75.0% | 0% | 100% | 0.012§ |
Table 4.
Preoperative & postoperative log MAR visual acuity & mean BCVA change in Idiopathic ERM with Intact inner seg-ment/outer segment (IS/OS) junction
| DIF | CME | PLH | VMT | p-value* | |
|---|---|---|---|---|---|
| Preoperative BCVA | 0.67 ± 0.32 | 0.61 ± 0.32 | 0.63 ± 0.99 | 0.82 ± 0 | 0.246 |
| Postoperative BCVA (6 months) | 0.22 ± 0.15 | 0.24 ± 0.16 | 0.35 ± 0.20 | 0.30 ± 0 | 0.406 |
| Postoperative BCVA (12 months) | 0.21 ± 0.16 | 0.30 ± 0.32 | 0.38 ± 0.35 | 0.22 ± 0 | 0.710 |
| Mean BCVA change (6 months) | 0.46 ± 0.22 | 0.38 ± 0.19 | 0.28 ± 0.90 | 0.52 ± 0 | 0.015† |
| Mean BCVA change (12 months) | 0.40 ± 0.20 | 0.20 ± 0.08 | ‐0.01 ± 0.21 | 0.62 ± 0 | 0.011† |
Table 5.
Comparison of group of combination with Cataract surgery between Pseudophakia for each type ( p-value*)
 XML Download