Abstract
Methods
The fourth Korea National Health and Nutrition Examination Survey (KNHANES IV) is a nationwide survey. The present study included 11,022 Koreans who completed the KNHANES IV. The relation of visual acuity and QOL was verified, and EuroQoL 5D (EQ-5D) was identified using the adjusted mean based on linear regression analysis.
Results
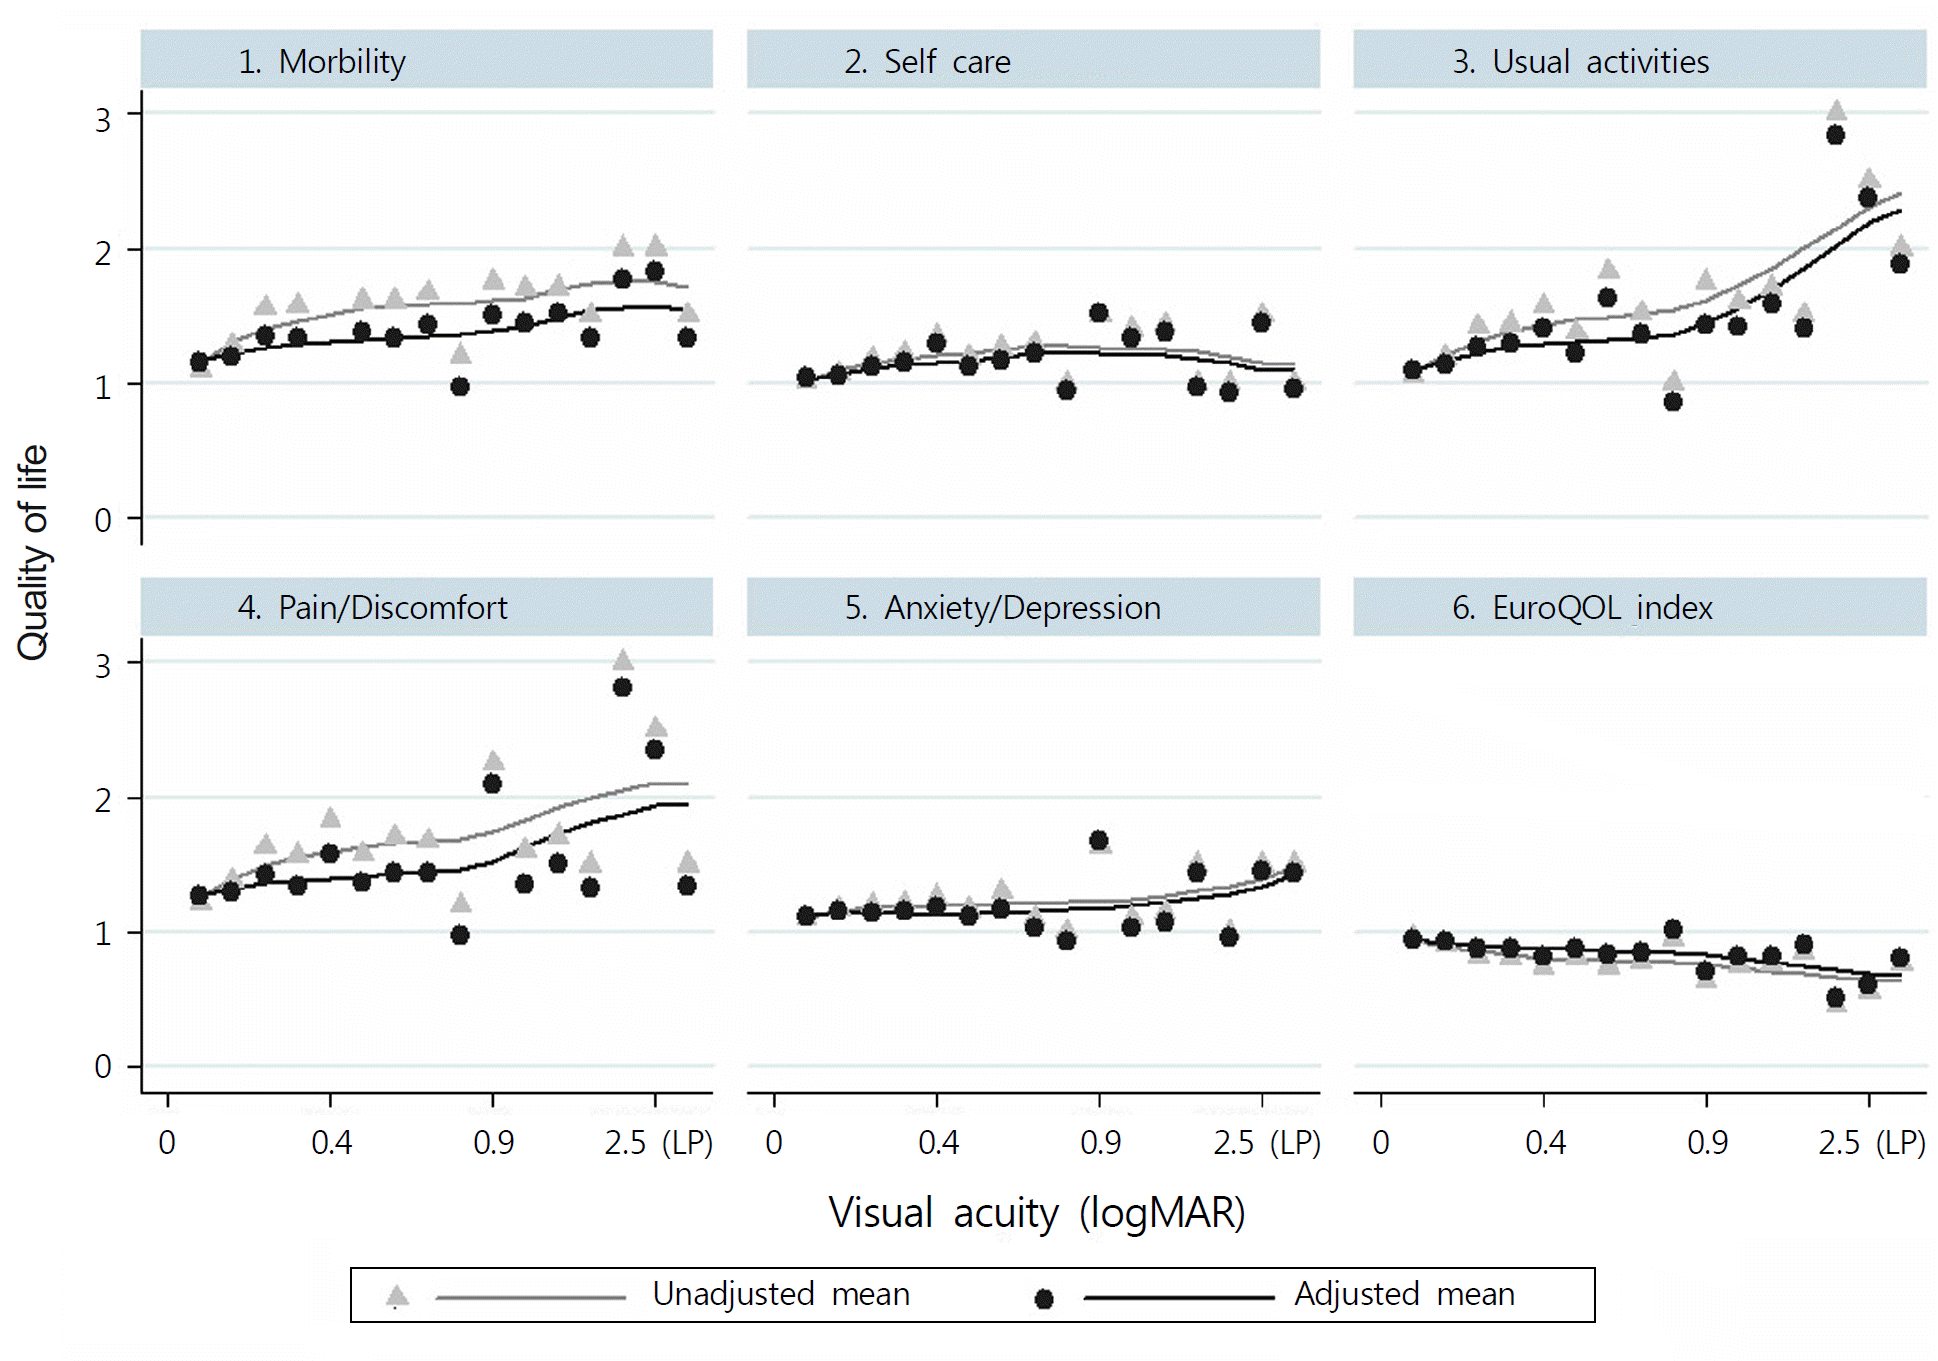
As visual acuity decreased, QOL decreased. QOL in mobility, usual activities, and pain/discomfort were affected by the vision gradient, while self-care and anxiety/depression were less influenced by the vision gradient. In particular, QOL in usual activities was significantly affected by the visual gradient. Subjects with a visual acuity of 1.6–3.0 were less likely to have a low QOL in usual activities compared to subjects with a visual acuity of 0.0–0.5 as a reference group (adjusted Odds Ratio = 23.6, 95% CI, 4.8–115.5). QOL in usual activities was statistically low in subjects older than 65 years of age, with low household monthly income, low education, and living without a spouse.
Conclusions
As visual acuity decreased, QOL in the aspect of mobility, usual activities, and pain/discomfort decreased severely, which resulted from activity limitation. Considering that the risk group with increasing age, low income, low education, and living without a spouse had lower QOL, the most important is to increase activity, which can induce the improvement of QOL in Koreans who have low visual acuity and related risk factors is.
Go to : 
References
1. Janca A, Prilipko L, Costa e Silva JA. The World Health Organization's global initiative on neurology and public health. J Neurol Sci. 1997; 145:1–2.
2. The Children's Vaccine Initiative and the Global Programme for Vaccines and Immunization. Recommendations from the Special Advisory Group of Experts. Part 1. Wkly Epidemiol Rec. 1997; 72:237–43.
3. Resnikoff S, Pascolini D, Etya'ale D, et al. Global data on visual impairment in the year 2002. Bull World Health Organ. 2004; 82:844–51.
4. Murray McGavin DD. Global initiative for the elimination of avoidable blindness. Community Eye Health. 1998; 11:3.
5. Park JH, Lee JY, Kim Y, Moon NJ. Epidemiological analysis and low vision rehabilitation of the visually impaired registered in Seoul. J Korean Ophthalmol Soc. 2009; 50:572–9.

6. Zou H, Zhang X, Xu X, et al. Vision-related quality of life and self-rated satisfaction outcomes of rhegmatogenous retinal abdominal surgery: three-year prospective study. PLoS One. 2011; 6:e28597.
7. Lau J, Michon JJ, Chan WS, Ellwein LB. Visual acuity and quality of life outcomes in cataract surgery patients in Hong Kong. Br J Ophthalmol. 2002; 86:12–7.

8. Yoon KC, Mun GH, Kim SD, et al. Prevalence of eye diseases in South Korea: data from the Korea national health and nutrition abdominal survey 2008–2009. Korean J Ophthalmol. 2011; 25:421–33.
9. Sung Nam Hae, Yuep Kim Kun, Suk Kwon Soon, et al. Research Report for estimated weight for Quality of Life Survey(EQ-5D). Korea Centers for Disease Control and Prevention 2007.
10. Bansback N, Tsuchiya A, Brazier J, Anis A. Canadian valuation of EQ-5D health states: preliminary value set and considerations for future valuation studies. PLoS One. 2012; 7:e31115.

11. Cleemput I, Kesteloot K, Moons P, et al. The construct and abdominal validity of the EQ-5D in a renal transplant population. Value Health. 2004; 7:499–509.
12. Gerding MN, Terwee CB, Dekker FW, et al. Quality of life in abdominals with Graves' ophthalmopathy is markedly decreased: abdominal by the medical outcomes study instrument. Thyroid. 1997; 7:885–9.
13. Egle UT, Kahaly GJ, Petrak F, et al. The relevance of physical and psychosocial factors for the quality of life in patients with abdominal-associated orbitopathy (TAO). Exp Clin Endocrinol Diabetes. 1999; 107(Suppl 5):S168–71.
14. Lee H, Roh HS, Yoon JS, Lee SY. Assessment of quality of life and depression in Korean patients with Graves' ophthalmopathy. Korean J Ophthalmol. 2010; 24:65–72.

15. Nah YS, Seong GJ, Kim CY. Visual function and quality of life in Korean patients with glaucoma. Korean J Ophthalmol. 2002; 16:70–4.

16. Leung JC, Kwok TC, Chan DC, et al. Visual functioning and abdominal of life among the older people in Hong Kong. Int J Geriatr Psychiatry. 2012; 8:807–15.
Go to : 
 | Figure 1.Association between quality of life and visual acuity (log MAR) using LOWESS fit line. Gray line and triangle mean unadjusted mean of quality of life, black line and circle mean adjusted mean of quality of life after adjusting age, sex, income, education, occupation, residential area, and spouse. Vertical axis mean degree of quality of life; 1 no problem, 2 some/moder-ate problem, and 3 extreme problem. In terms of “6. EuroQOL index”, maximum score is 1 that mean the best quality of life. Horizontal axis mean visual acuity by log MAR. 2.5, 3.0, and 0 mean light perception, no light perception, and 1.0 as a decimal unit of visual acuity repectively. |
Table 1.
Characteristics of study population (n = 11,022)
Table 2.
Factors associated with quality of life in usual activities – multivariate logistic regression analysis (n = 11,022)


 PDF
PDF ePub
ePub Citation
 Print
Print


 XML Download