Abstract
Purpose
To analyze the clinical effectiveness of tafluprost used in the treatment of glaucoma, using ocular pulse amplitude (OPA) measurements with dynamic contour tonometry (DCT).
Methods
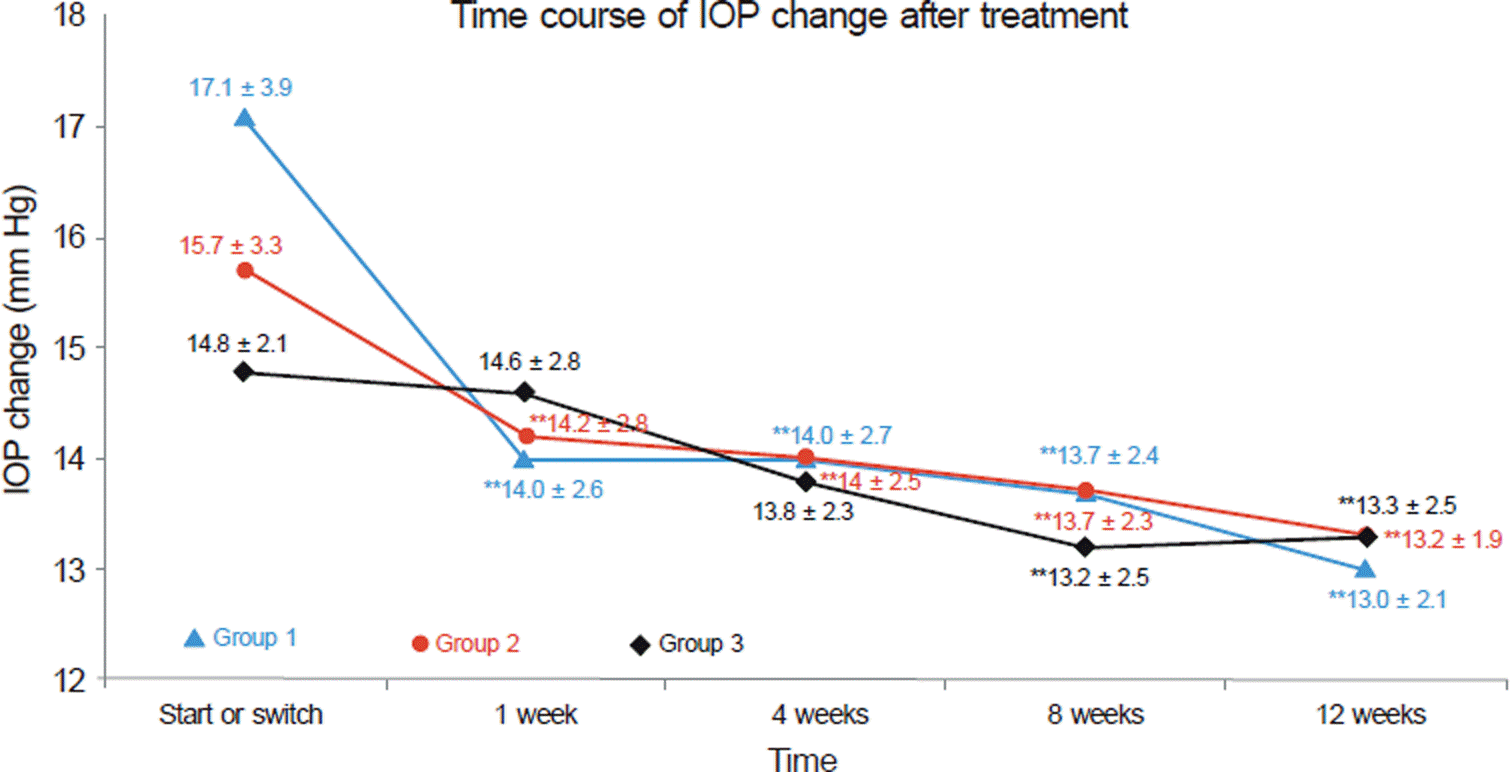
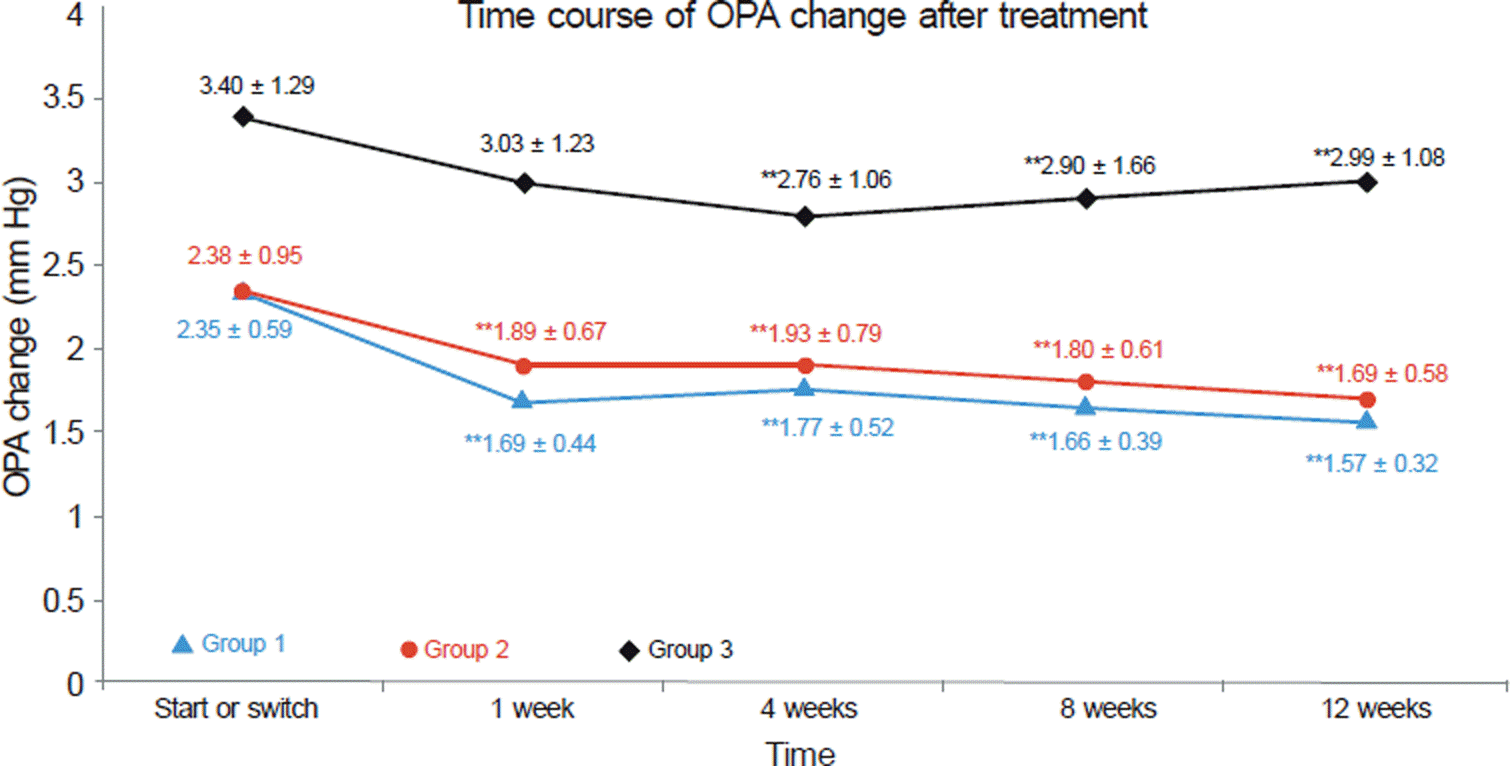
Sixty patients (119 eyes) with normal tension glaucoma (NTG) or primary open angle glaucoma (POAG) treated with tafluprost or other eyedrops were investigated in the present study. Intraocular pressure (IOP) was measured with Goldmann applanation tonometry (GAT), and OPA was measured with DCT, before and after treatment, retrospectively. Results: In 20 patients treated with tafluprost, IOP decreased from 17.1 mm Hg before treatment to 13.0 mm Hg 3 months after treatment (24.0% descent rate), and OPA decreased from 2.35 to 1.57 (33.2% descent rate). For 20 patients who switched from another monotherapy to tafluprost, IOP decreased from 15.7 mm Hg to 13.2 mm Hg from 15.7 mm Hg (15.3%) and OPA from 2.38 to 1.69 (27.7%).
References
1. Pozarowska D. Safety and tolerability of tafluprost in treatment of elevated intraocular pressure in open-angle glaucoma and ocular hypertension. Clin Ophthalmol. 2010; 4:1229–36.

2. Hommer A, Kimmich F. Switching patients from preserved prostaglandin-analog monotherapy to preservative-free tafluprost. Clin Ophthalmol. 2011; 5:623–31.
3. Stalmans I, Harris A, Vanbellinghen V, et al. Ocular pulse amplitude in normal tension and primary open angle glaucoma. J Glaucoma. 2008; 17:403–7.

4. Harris A, Rechtman E, Siesky B, et al. The role of optic nerve blood flow in the pathogenesis of glaucoma. Ophthalmol Clin North Am. 2005; 18:345–53.

5. Georgopoulos GT, Diestelhorst M, Fisher R, et al. The short-term effect of latanoprost on intraocular pressure and pulsatile ocular blood flow. Acta Ophthalmol Scand. 2002; 80:54–8.

6. Grover DS, Budenz DL. Ocular perfusion pressure and glaucoma. Int Ophthalmol Clin. 2011; 51:19–25.

7. Flammer J, Orgül S, Costa VP, et al. The impact of ocular blood flow in glaucoma. Prog Retin Eye Res. 2002; 21:359–93.

9. Suh W, Park SC, Kee CW. Comparison of primary vascular dysregulation in normal tension glaucoma and primary open angle glaucoma. J Korean Ophthalmol Soc. 2010; 51:393–400.

10. Lee NY, Ahn MD. Analysis of systemic factors through blood examination in normal-tension glaucoma patients. J Korean Ophthalmol Soc. 2010; 51:241–7.

11. Punjabi OS, Kniestedt C, Stamper RL, Lin SC. Dynamic contour tonometry: principle and use. Clin Experiment Ophthalmol. 2006; 34:837–40.

12. Seo JW, Shin DM, Rho SH. Comparison of dynamic contour tonometry and goldmann applanation tonometry. J Korean Ophthalmol Soc. 2009; 50:242–6.

13. Hoffmann EM, Grus FH, Pfeiffer N. Intraocular pressure and ocular pulse amplitude using dynamic contour tonometry and contact lens tonometry. BMC Ophthalmol. 2004; 4:4.

14. Grieshaber MC, Katamay R, Gugleta K, et al. Relationship between ocular pulse amplitude and systemic blood pressure measurements. Acta Ophthalmol. 2009; 87:329–34.

15. Dastiridou AI, Ginis HS, De Brouwere D, et al. Ocular rigidity, ocular pulse amplitude, and pulsatile ocular blood flow: the effect of intraocular pressure. Invest Ophthalmol Vis Sci. 2009; 50:5718–22.

16. Fogagnolo P, Figus M, Frezzotti P, et al. Test-retest variability of intraocular pressure and ocular pulse amplitude for dynamic contour tonometry: a multicentre study. Br J Ophthalmol. 2010; 94:419–23.

17. Anderson MF, Agius-Fernandez A, Kaye SB. Comparison of the utility of pascal dynamic contour tonometry with goldmann appla-nation tonometry in routine clinical practice. J Glaucoma. 2012.

18. Katz LJ, Cohen JS, Batoosingh AL, et al. Twelve-month, randomized, controlled trial of bimatoprost 0.01%, 0.0125%, and 0.03% in patients with glaucoma or ocular hypertension. Am J Ophthalmol. 2010; 149:661–71.e1.

19. Izumi N, Nagaoka T, Sato E, et al. Short-term effects of topical tafluprost on retinal blood flow in cats. J Ocul Pharmacol Ther. 2008; 24:521–6.

20. Weizer JS, Asrani S, Stinnett SS, Herndon LW. The clinical utility of dynamic contour tonometry and ocular pulse amplitude. J Glaucoma. 2007; 16:700–3.

21. Vulsteke C, Stalmans I, Fieuws S, Zeyen T. Correlation between ocular pulse amplitude measured by dynamic contour tonometer and visual field defects. Graefes Arch Clin Exp Ophthalmol. 2008; 246:559–65.

22. Kaufmann C, Bachmann LM, Robert YC, Thiel MA. Ocular pulse amplitude in healthy subjects as measured by dynamic contour tonometry. Arch Ophthalmol. 2006; 124:1104–8.

23. Kac MJ, Solari HP, Velarde GC, et al. Ocular pulse amplitude in patients with asymmetric primary open-angle glaucoma. Curr Eye Res. 2011; 36:727–32.

24. Aihara M. Clinical appraisal of tafluprost in the reduction of elevated intraocular pressure (IOP) in open-angle glaucoma and ocular hypertension. Clin Ophthalmol. 2010; 4:163–70.

25. Pantcheva MB, Seibold LK, Awadallah NS, Kahook MY. Tafluprost: a novel prostaglandin analog for treatment of glaucoma. Adv Ther. 2011; 28:707–15.

26. Detorakis ET, Arvanitaki V, Pallikaris IG, et al. Applanation tonometry versus dynamic contour tonometry in eyes treated with latanoprost. J Glaucoma. 2010; 19:194–8.

27. Frayer WC, Laties AM. Some consequences of ciliary process swelling in the rabbit and in the human. Trans Am Ophthalmol Soc. 1976; 74:107–21.
Figure 1.
Time course of IOP change after treatment. Data represent: mean ± SD. **p < 0.01, compared with start or switch value (ANOVA test: Scheffe, Dunnet T3 test). Not significant, comparison between three groups, only significant at base line point between Group 1 and Group 3. IOP reduction from base line to 12 weeks after treatment. Group 1: 24.0%, Group 2: 15.3%, Group 3: 10.1%. Group 1 = Initiation of glaucoma treatment with tafluprost. Group 2 = Switching of anti-glaucoma eye drop (monotherapy) to tafluprost. Group 3 = Switching of anti-glaucoma eye drop to another eye drop except tafluprost.

Figure 2.
Time course of OPA change after treatment. Data represent: mean ± SD. **p < 0.01, compared with start or switch value (ANOVA test : Scheffe, Dunnet T3 test Not significant, comparison between Group 1 and Group 2, but significant Group 1, 2 vs Group 3, at all time points. OPA reduction from base line to 12 weeks after treatment. Group 1: 33.2%, Group 2: 27.7%, Group 3: 11.7%. Group 1 = Initiation of glaucoma treatment with tafluprost. Group 2 = Switching of anti-glaucoma eye drop (monotherapy) to tafluprost. Group 3 = Switching of anti-glaucoma eye drop to another eye drop except tafluprost.

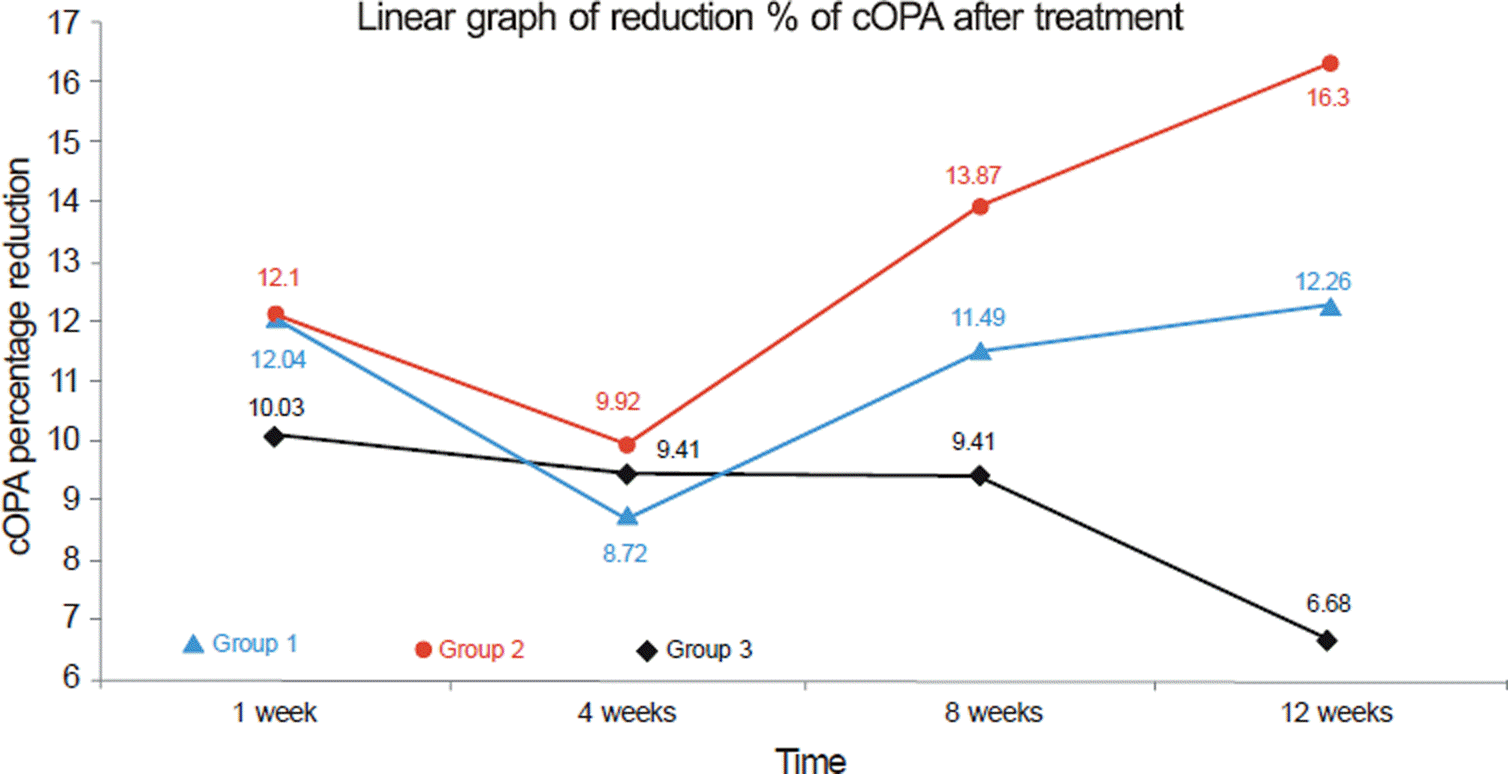
Figure 3.
Linear graph of reduction % of cOPA after treatment. Data represent efficacy of cOPA reduction. cOPA: corrected the OPA values by the IOP difference by the time course (ΔIOP). cOPA = OPA − (ΔIOP × 0.12). cOPA means the value of OPA, excluding influence of intraocular pressure. Not significant difference in cOPA, comparison between 3 Groups (ANOVA test), but differ in reduction % of cOPA between 3 Groups, because of difference ΔIOP in each groups. High reduction % of cOPA is meaningful in Group 2, in which IOP has already reduced by another eyedrop. cOPA reduction. Group 1: 16.3%, Group 2: 12.3%, Group 3: 6.7%. Group 1 = Initiation of glaucoma treatment with tafluprost. Group 2 = Switching of anti-glaucoma eye drop (monotherapy) to tafluprost. Group 3 = Switching of anti-glaucoma eye drop to another eye drop except tafluprost.

Table 1.
Background characteristics in three groups
| Group 1* (n = 20, 39 eyes) | Group 2† (n = 20, 40 eyes) | Group 3‡ (n = 20, 40 eyes) | p-value (ANOVA§) | |
|---|---|---|---|---|
| Mean Age ± SD (years) | 53.55 ± 11.67 | 59.61 ± 12.38 | 65.53 ± 7.97 | # |
| Sex | NSП | |||
| Male | 8 | 9 | 8 | |
| Female | 12 | 11 | 12 | |
| Past history | ||||
| DM | 5 | 3 | 7 | |
| HTN | 2 | 1 | 4 | NSП |
| Glaucoma diagnosis | ||||
| NTG | 15 | 13 | 14 | NSП |
| POAG | 5 | 7 | 6 | NSП |
| CCT ± SD (μm) | 525.9 ± 11.7 | 526.9 ± 31.4 | 521.7 ± 22.4 | NSП |
| C/D ratio | 0.69 ± 1.4 | 0.7± 1.1 | 0.72 ± 1.5 | NSП |


 PDF
PDF ePub
ePub Citation
 Print
Print


 XML Download