

 PDF
PDF ePub
ePub Citation
 Print
Print


Abstract
Purpose
To report the results according to anterior elevation changes following corneal crosslinking (CXL) treatment for keratoconus.
Methods
The present retrospective study included 14 patients (15 eyes) with progressive keratoconus who underwent CXL with a follow-up of 12 months. Patients were classified into 2 groups according to pre and postoperative anterior elevation difference maps. On the preoperative anterior elevation map, distances from maximum anterior elevation to pupil center were compared between the 2 groups. The outcome of best correct visual acuity (BCVA), maximum keratometry and parameters of corneal topography were compared between the 2 groups before CXL as well as 6 and 12 months after CXL.
Results
The anterior elevation changes were classified as group 1 (-7.88 ± 10.53 μm) or group 2 (8.71 ± 5.99 μm) (p = 0.001). The preoperative corneal topography of eyes observed in group 1 (0.19 ± 0.13 mm) had shorter mean distances from maximum anterior elevation to pupil center than eyes in group 2 (0.47 ± 0.23 mm) (p = 0.018). BCVA (log MAR) improved from 0.68 ± 0.78 to 0.57 ± 0.81 (p = 0.115) 12 months after CXL in group 1 and decreased from 0.51 ± 0.34 to 0.56 ± 0.38 (p = 0.109) 12 months after CXL in group 2. The maximum keratometry decreased from 63.01 ± 19.07D to 58.95 ± 16.32D (p = 0.017) in group 1 and increased from 60.70 ± 9.46D to 61.29 ± 7.51D (p = 0.674) in group 2.
Conclusions
Clinical and optical effects improved postoperatively in group 1, and were stabilized in group 2. The pre-operative distance from maximum anterior elevation to pupil center and the anterior elevation changes after CXL were factors in predicting the CXL outcome. J Korean Ophthalmol Soc 2013;54(2):199-209
References
1. Hafezi F, Kanellopoulos J, Wiltfang R, Seiler T.Corneal collagen crosslinking with riboflavin and ultraviolet A to treat induced keratectasia after laser in situ keratomileusis. J Cataract Refract Surg. 2007; 33:2035–40.

2. Wollensak G, Spoerl E, Seiler T.Riboflavin/ultraviolet-a-induced collagen crosslinking for the treatment of keratoconus. Am J Ophthalmol. 2003; 135:620–7.
3. Tomkins O, Garzozi HJ.Collagen cross-linking: Strengthening the unstable cornea. Clin Ophthalmol. 2008; 2:863–7.
4. Hersh PS, Greenstein SA, Fry KL.Corneal collagen crosslinking for keratoconus and corneal ectasia: One-year results. J Cataract Refract Surg. 2011; 37:149–60.
5. Greenstein SA, Fry KL, Hersh PS.Corneal topography indices after corneal collagen crosslinking for keratoconus and corneal ectasia: one-year results. J Cataract Refract Surg. 2011; 37:1282–90.
6. Caporossi A, Baiocchi S, Mazzotta C, et al. Parasurgical therapy for keratoconus by riboflavin-ultraviolet type A rays induced cross-linking of corneal collagen: preliminary refractive results in an Italian study. J Cataract Refract Surg. 2006; 32:837–45.
7. Lee P, Jin KH.Clinical results of riboflavin and ultravioletA-Induced corneal cross-linking for progressive keratoconus in Korean patients. J Korean Ophthalmol Soc. 2011; 52:23–8.
8. Maeda N, Klyce SD, Smolek MK.Comparison of methods for detecting keratoconus using videokeratography. Arch Ophthalmol. 1995; 113:870–4.
9. Wittig-Silva C, Whiting M, Lamoureux E, et al. A randomized controlled trial of corneal collagen cross-linking in progressive keratoconus: preliminary results. J Refract Surg. 2008; 24:S720–5.
10. Vinciguerra P, Albé E, Trazza S, et al. Refractive, topographic, tomographic, and aberrometric analysis of keratoconic eyes undergoing corneal cross-linking. Ophthalmology. 2009; 116:369–78.
11. Andreassen TT, Simonsen AH, Oxlund H.Biomechanical properties of keratoconus and normal corneas. Exp Eye Res. 1980; 31:435–41.
12. Rabinowitz YS.Keratoconus. Surv Ophthalmol. 1998; 42:297–319.
13. Daxer A, Fratzl P.Collagen fibril orientation in the human corneal stroma and its implication in keratoconus. Invest Ophthalmol Vis Sci. 1997; 38:121–9.
14. Boote C, Dennis S, Huang Y, et al. Lamellar orientation in human cornea in relation to mechanical properties. J Struct Biol. 2005; 149:1–6.
15. Polack FM.Contributions of electron microscopy to the study of corneal pathology. Surv Ophthalmol. 1976; 20:375–414.
16. Meek KM, Tuft SJ, Huang Y, et al. Changes in collagen orientation and distribution in keratoconus corneas. Invest Ophthalmol Vis Sci. 2005; 46:1948–56.
17. Tu KL, Aslanides IM.Orbscan II anterior elevation changes following corneal collagen cross-linking treatment for keratoconus. J Refract Surg. 2009; 25:715–22.
18. Spoerl E, Mrochen M, Sliney D, et al. Safety of UVA-riboflavin cross-linking of the cornea. Cornea. 2007; 26:385–9.
19. Bottós KM, Dreyfuss JL, Regatieri CV, et al. Immunofluorescence confocal microscopy of porcine corneas following collagen cross-linking treatment with riboflavin and ultraviolet A. J Refract Surg. 2008; 24:S715–9.
20. Kohlhaas M, Spoerl E, Schilde T, et al. Biomechanical evidence of the distribution of cross-links in corneas treated with riboflavin and ultraviolet A light. J Cataract Refract Surg. 2006; 32:279–83.
21. Mazzotta C, Traversi C, Baiocchi S, et al. Corneal healing after riboflavin ultraviolet-A collagen cross-linking determined by confocal laser scanning microscopy in vivo: early and late modifications. Am J Ophthalmol. 2008; 146:527–33.
22. Kymionis G, Portaliou D.Corneal crosslinking with riboflavin and UVA for the treatment of keratoconus. J Cataract Refract Surg. 2007; 33:1143–4.
23. Patel S, Marshall J, Fitzke FW. 3rd. Model for deriving the optical performance of the myopic eye corrected with an intracorneal ring. J Refract Surg. 1995; 11:248–52.
24. Piñero DP, Alio JL, Barraquer RI, Michael R.Corneal bio-mechanical changes after intracorneal ring segment implantation in keratoconus. Cornea. 2012; 31:491–9.
25. Koller T, Mrochen M, Seiler T.Complication and failure rates after corneal crosslinking. J Cataract Refract Surg. 2009; 35:1358–62.
26. Caporossi A, Mazzotta C, Baiocchi S, Caporossi T.Long-term results of riboflavin ultraviolet a corneal collagen cross-linking for keratoconus in Italy : the Siena eye cross study. Am J Ophthalmol. 2010; 149:585–93.
27. Greenstein SA, Shah VP, Fry KL, Hersh PS.Corneal thickness changes after corneal collagen crosslinking for keratoconus and corneal ectasia: one-year results. J Cataract Refract Surg. 2011; 37:691–700.
Figure 1.
The anterior elevation map in topography of Pentacam in keratoconus patients. (A) Anterior elevation from best fit sphere (BFS) at preoperative period. (B) Anterior elevation from BFS at postoperative 6 months. (C) Anterior elevation form BFS at postoperative 12 months. (D) Anterior elevation (12 months after CXL to preoperative) difference maps. (E) Color bar showing the elevation scale as gradation of the color scale. If the area of the cornea shows red color, examination results show highest area in the cornea.
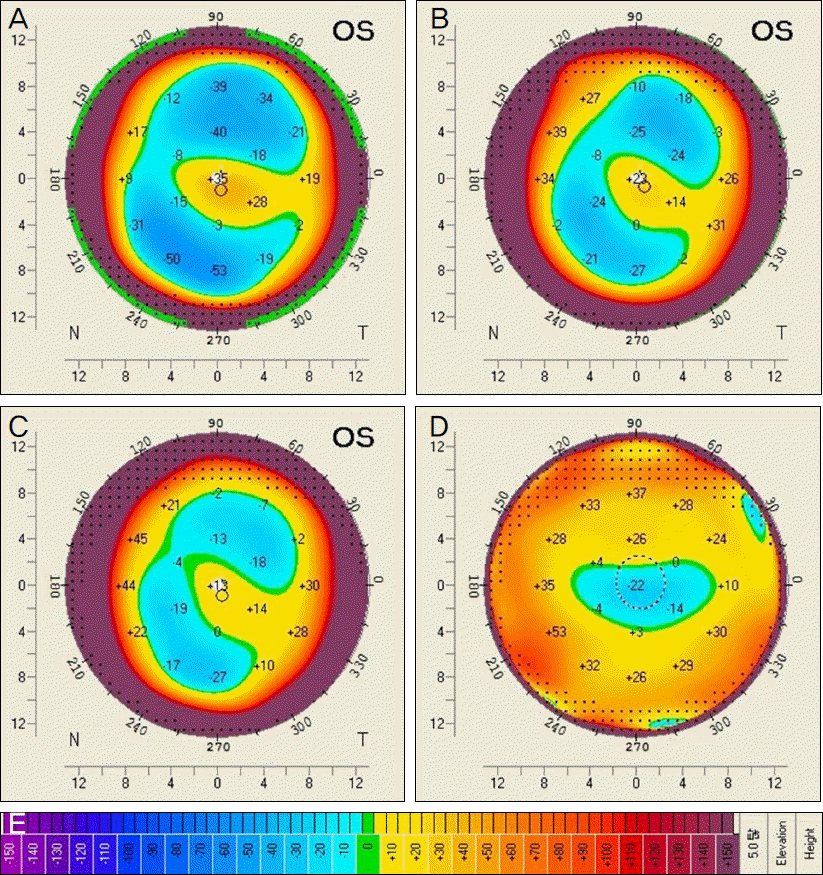
Figure 2.
(A) Anterior chamber analysis of Pentacam showed location of the pupil center (a, b) and the apex of the cornea (0, especially. (B) The 2 Cartesian coordinates was performed after converting (a, b) of the pupil center into (0, 0). That is, (-a, -b) correspond to the corneal apex and (0, 0) correspond to the pupil center; D is distance between the pupil center and the apex of the cornea.
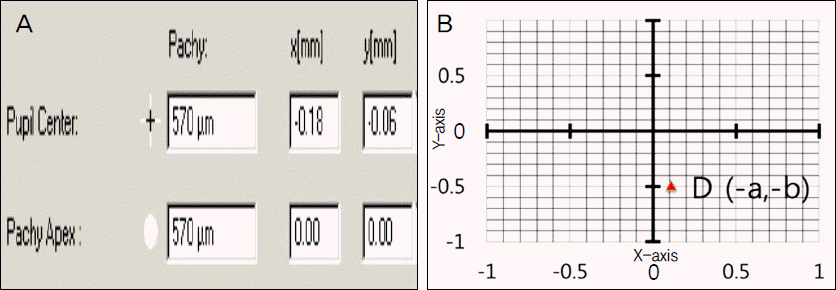
Figure 3.
Anterior elevation (12 months after CXL to preoperative) difference maps in eight eyes. Difference map showed para-central steepening, no change or flattening centrally in group 1.
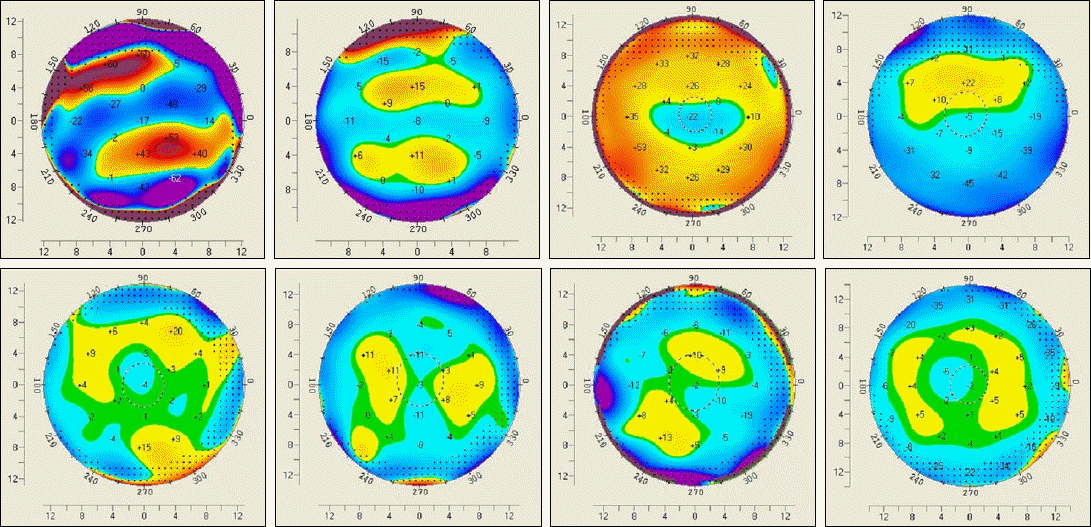
Figure 4.
Anterior elevation (12 months after CXL to preoperative) difference maps in seven eyes. Difference map showed para-central flattening with central steepening in group 2.
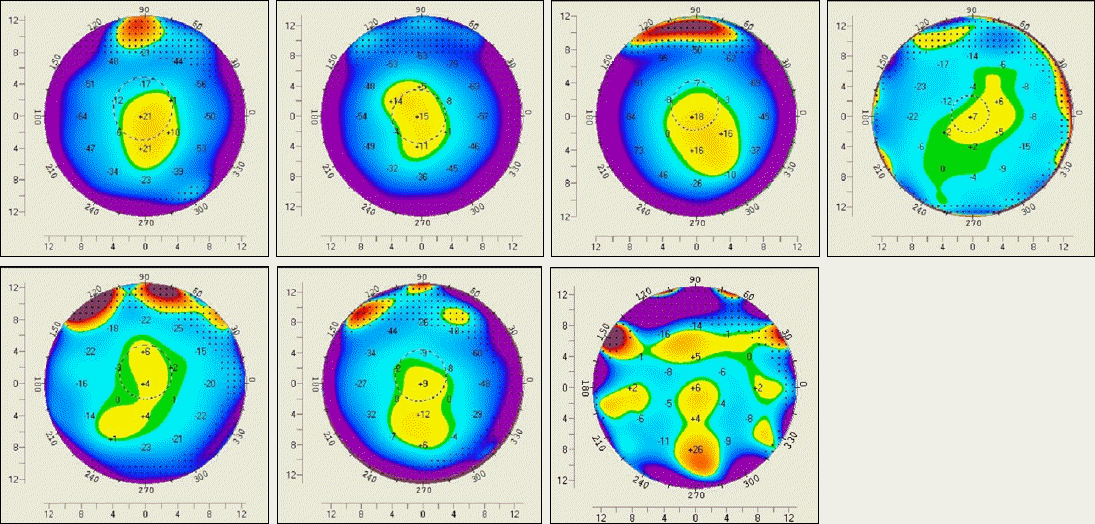
Figure 5.
Scatter graphs showed the location of the apex of the cornea and pupil center and represented by the 2-dimensional vector (X,Y); (A) Location of the apex of the cornea showed cluster of points gathered around the inferior part of zero point at preoperative (red circle), postoperative 6 months (navy triangle) and 12 months (yellow quadrangle) in group 1. (B) Location of the apex of the cornea showed diffuse distributed points around the inferior part of zero points at pre-operative, and location of points moved to zero point in group 2.
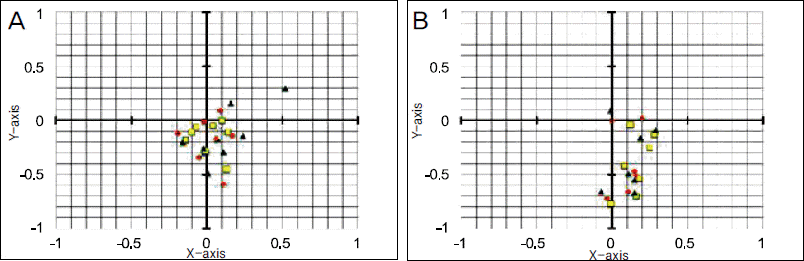
Figure 6.
Box and whisker plot represents the mean changes in variables from the baseline at 6 and 12 months. The bottom and the top of the box shows the 25th and 75th percentile and the band near the middle of the box shows median values. A shows mean change in best-corrected visual acuity (BCVA) between baseline and 6, 12 months for group 1 and groups 2. B shows mean change in maximum keratometry values (Kmax) between baseline and 6, 12 months. C shows mean change in mean keratometry values (Kmean) between baseline and 6, 12 months. D shows mean change in spherical equivalent values (SE) between baseline and 6, 12 months. E shows mean change in central corneal thickness (CCT) between baseline and 6, 12 months. F shows mean change in index of surface variance (ISV) between baseline and 6, 12 months. G shows mean change in index of vertical asymmetry (IVA) between baseline and 6, 12 months. *Significantly different between Group 1 and Group 2 (p < 0.05, Mann-Whitney U test). †Significantly different from baseline measurement (p < 0.05, Wilcoxon signed-ranks test).
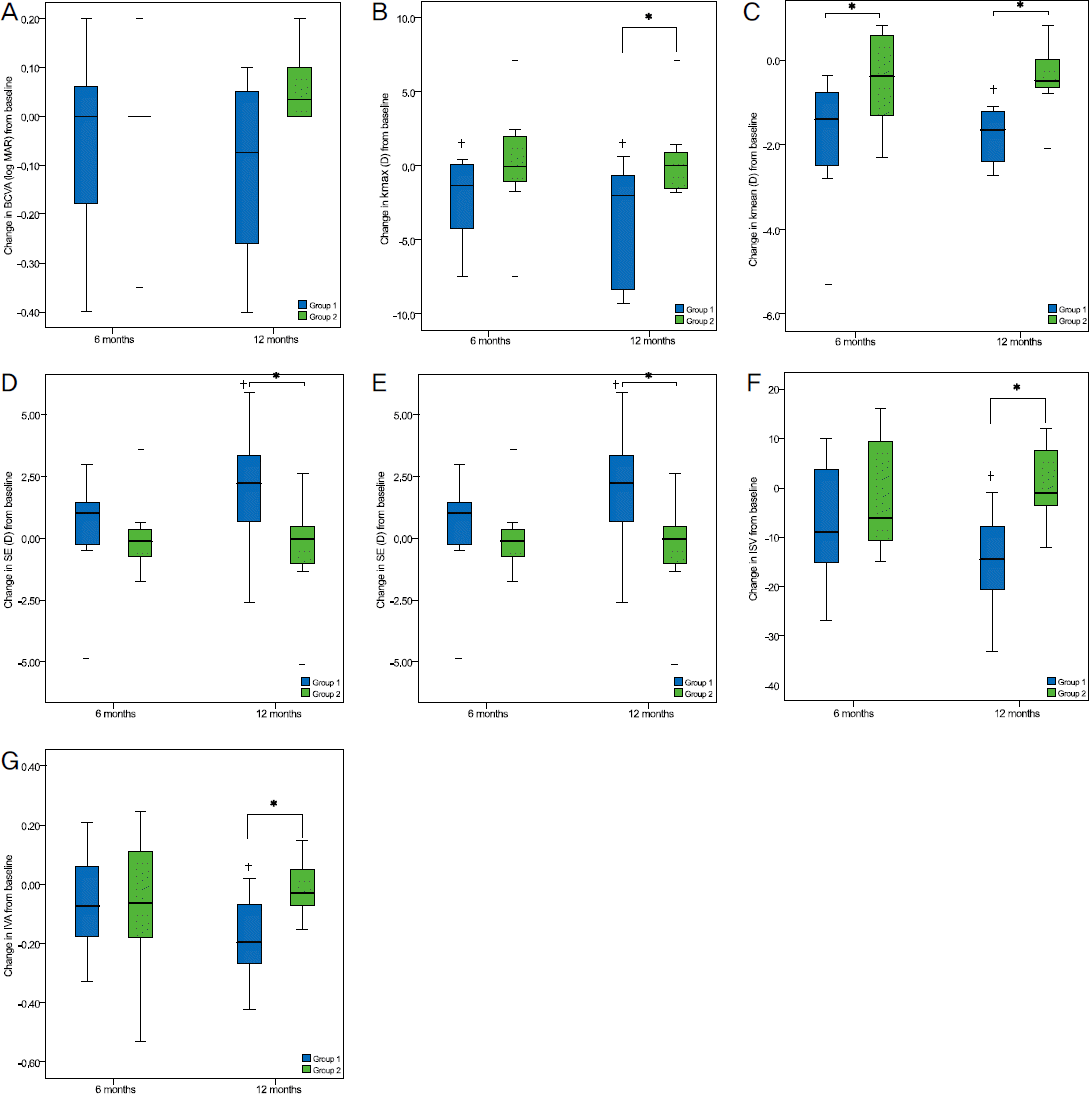
Figure 7.
Schematic diagrams of a proposed biochemical model response to corneal crosslinking (CXL). Group 1 (Distance between corneal apex (red triangle) and center (blue circle) is within 0.3 mm); (A) Shrinkage of the surrounding collagen fibrils (violet arrow) lead to equal force due to roughly equal length in all corresponding hemimeridians around the cone apex (black circle represents cross-linked zone); (C) This would result in no significant change or finely pulling up of the cone apex to corneal center (blue dot line) after CXL. There was flattening of corneal center corresponding to corneal apex due to arch shortening effect after CXL. Group 2 (Distance between cor-neal apex and center is far more 0.3 mm); (B) Shrinkage of the collagen fibrils (violet arrow) on one side of a meridian to the displaced cone apex lead to more shrinkage force due to more length than that of the opposite side; (D) This would result in marked pulling up of the cone apex to corneal center after CXL. There was steepening of the corneal center corresponding to peri-apexial area due to arch shortening effect after CXL.
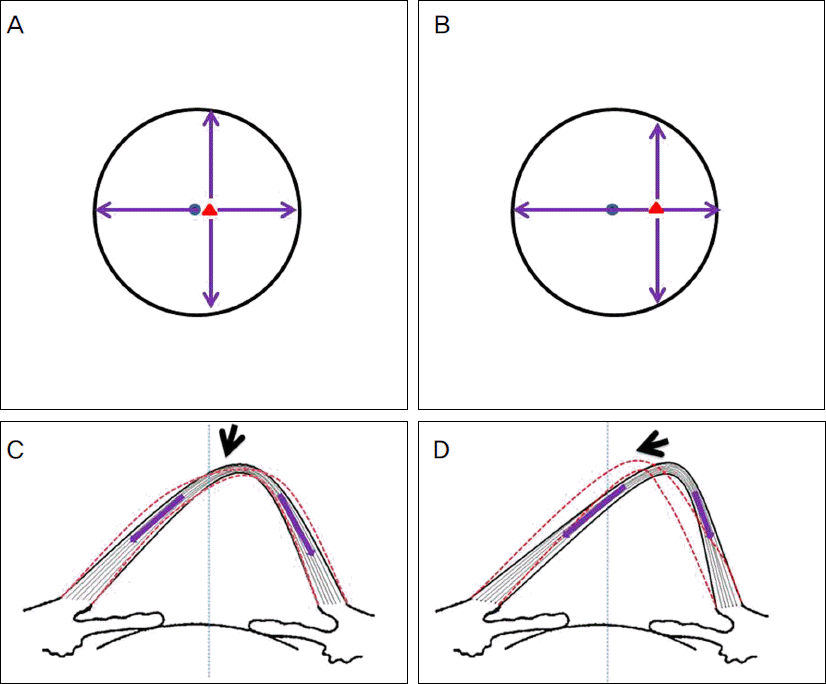
Table 1.
Baseline demographic and clinical characteristics of the keratoconic patients comprising the group 1 and group 2
Values are presented as mean ± SD.
DAE = difference of anterior elevation; BCVA = best-corrected visual acuity; K max = maximum keratometry; K mean = mean keratometry; SE = spherical equivalent; CCT = central corneal thickness; ISV = index of surface variance; IVA = index of vertical asymmetry.
*Significantly different between Group 1 and Group 2 (p < 0.05, Mann-Whitney U test).
Table 2.
Comparison of parameters measured preoperatively and at 6, 12 months in group 1 and group 2, respectively
Values are presented as mean ± SD.
BCVA = best-corrected visual acuity; K max= maximum keratometry; K mean = mean keratometry; SE = spherical equivalent; CCT = central corneal thickness; ISV = index of surface variance; IVA = index of vertical asymmetry.
*Significantly different from baseline measurement (p < 0.05, Wilcoxon signed-ranks test).
 XML Download