Abstract
Purpose
To report a case of bilateral acute macular neuroretinopathy (AMN) following flu-like illness.
Case summary
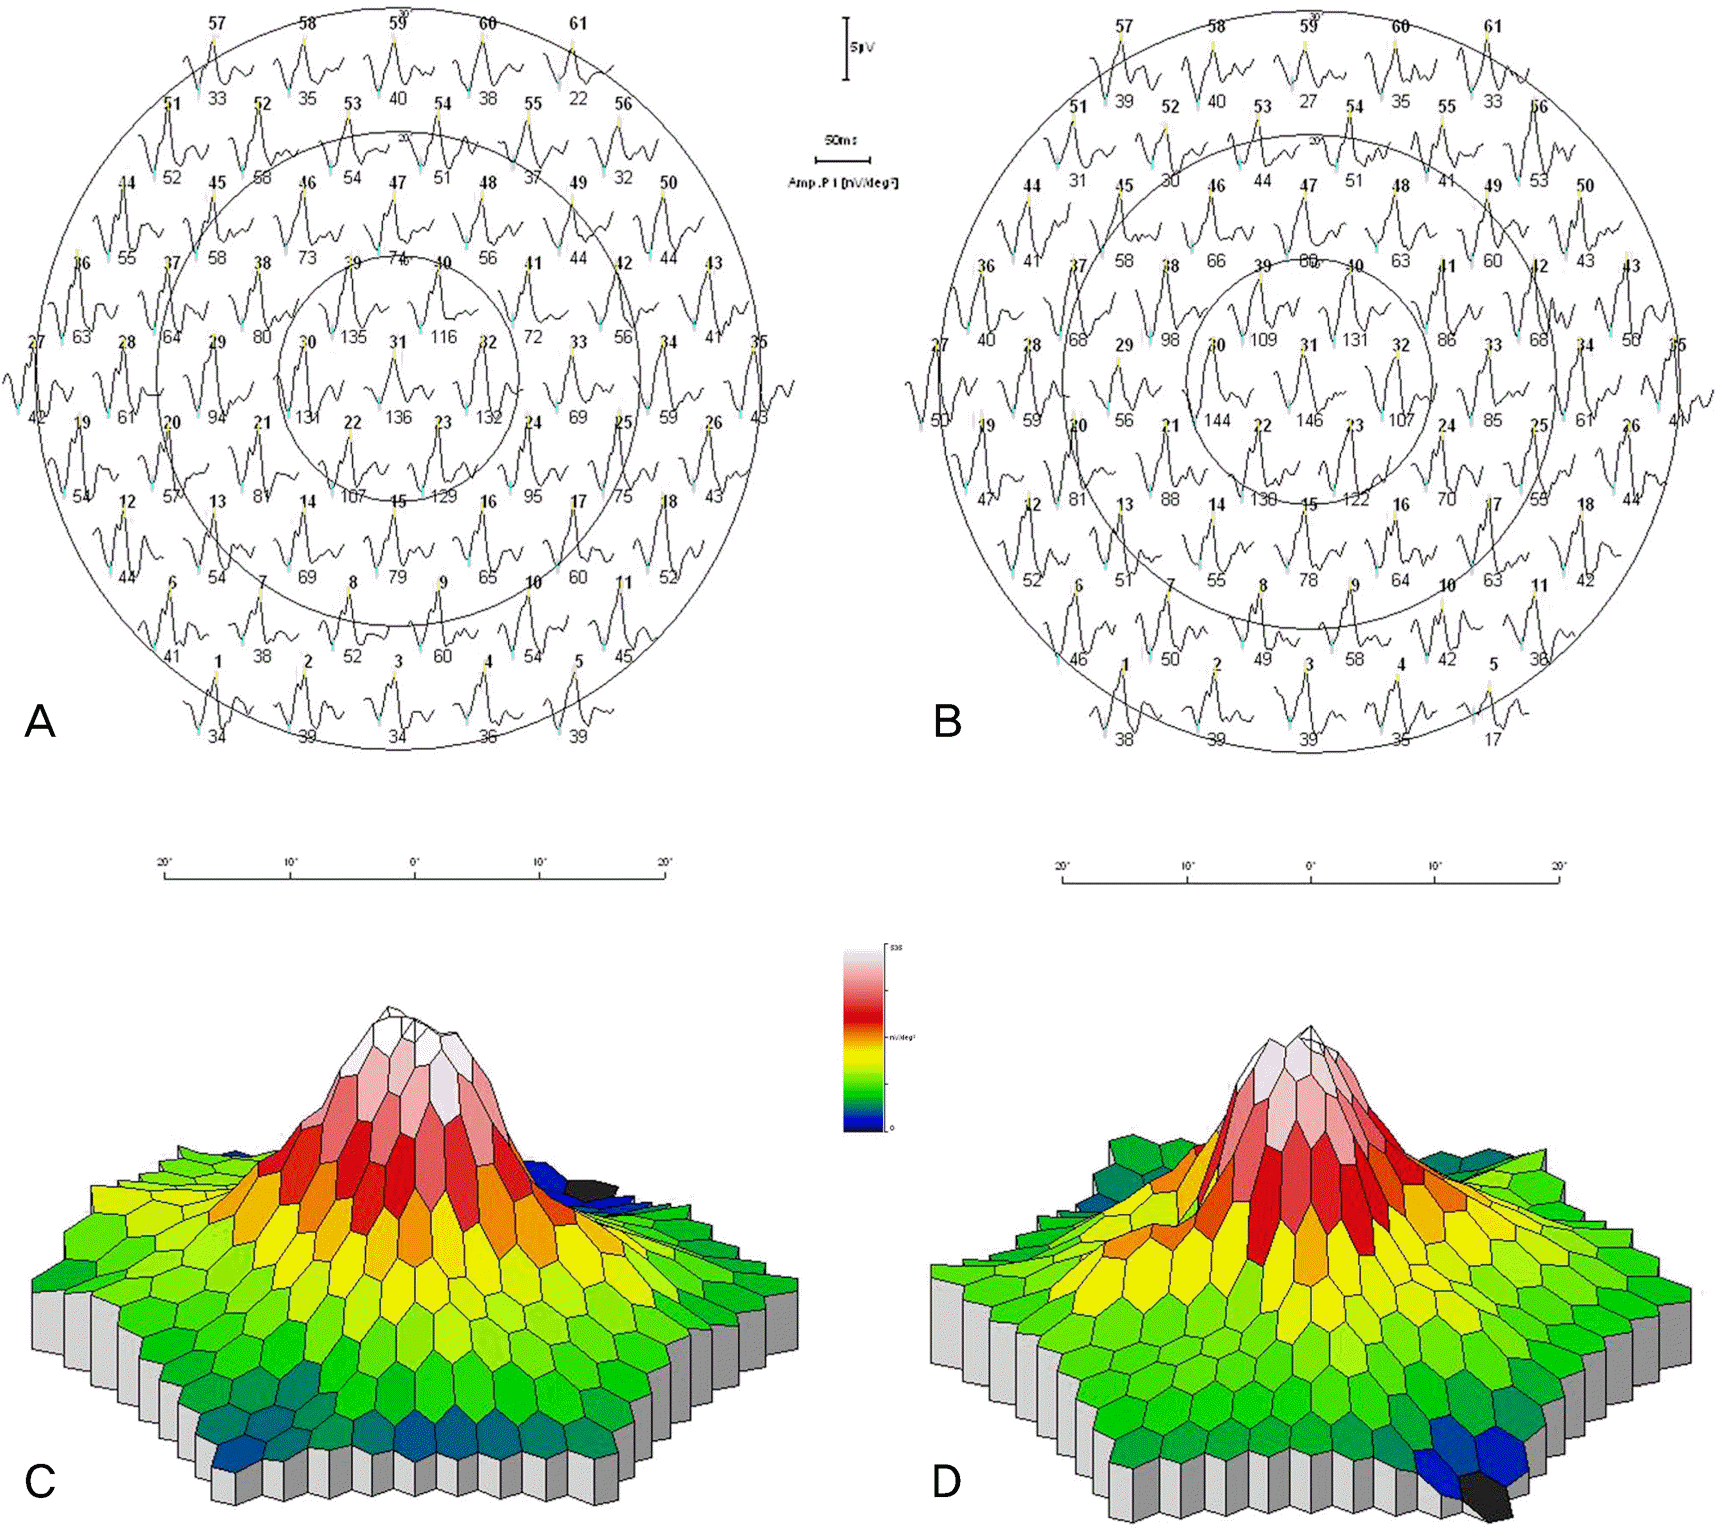
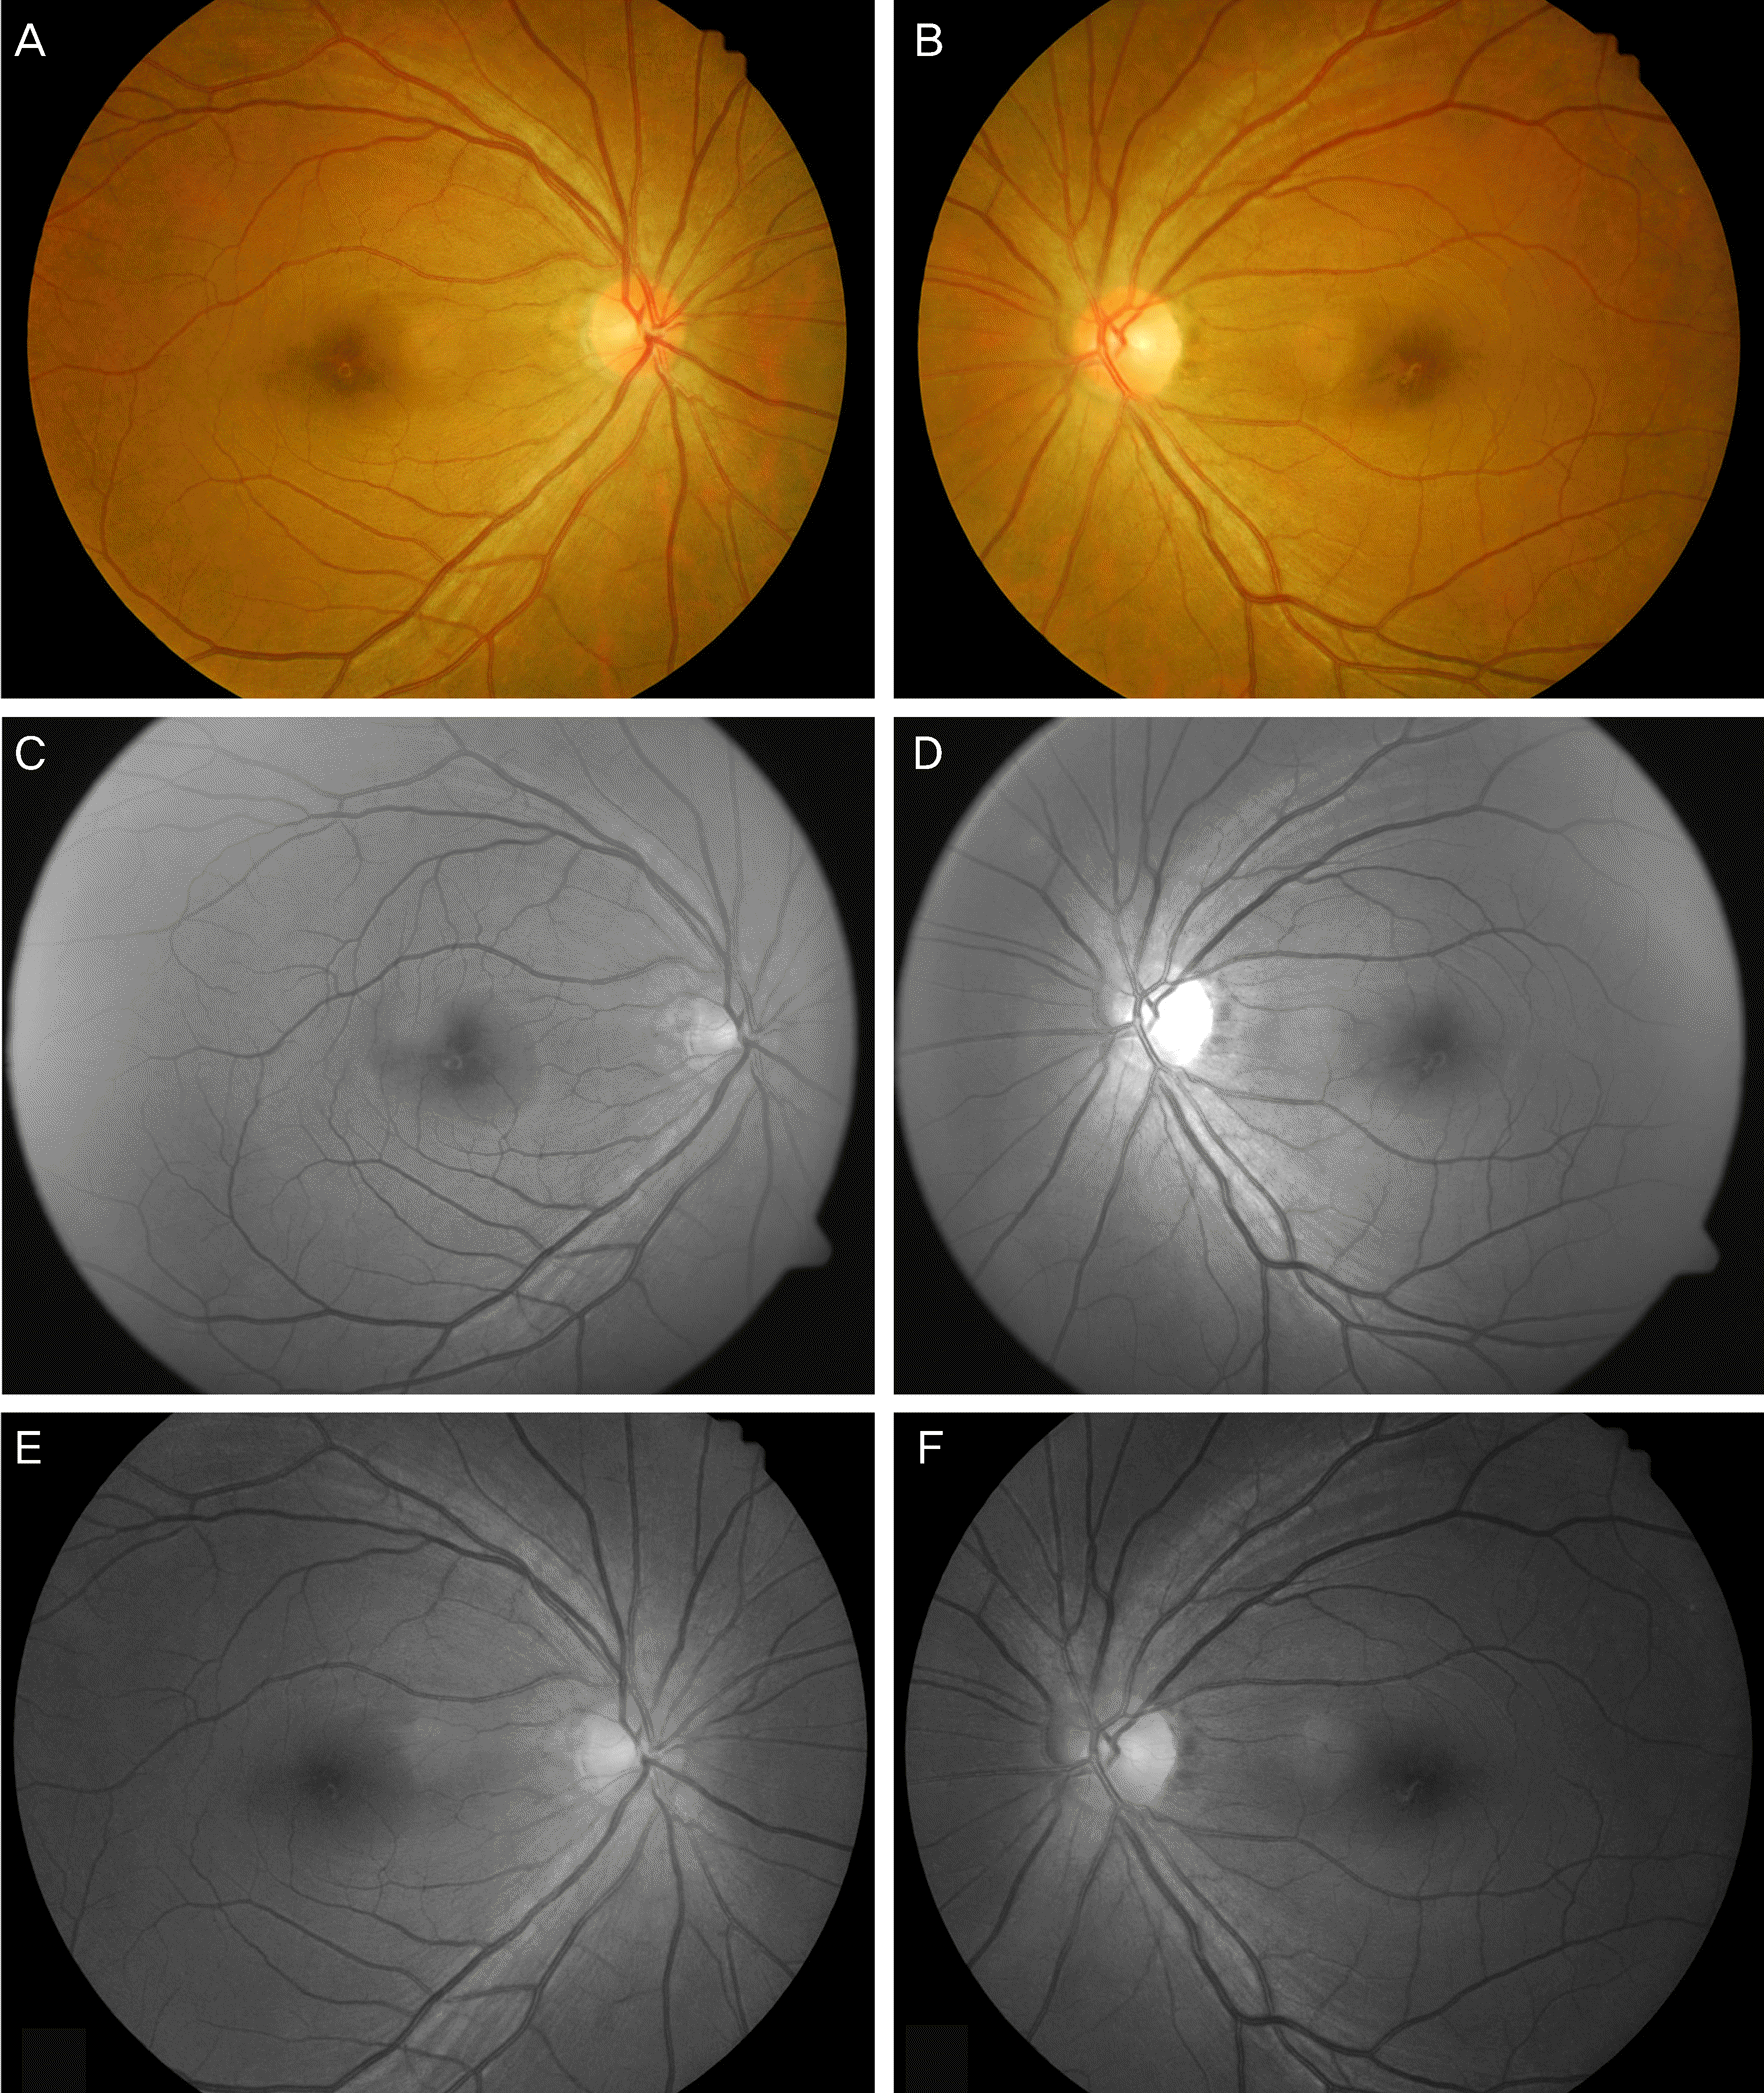
A 42-year-old woman complained of paracentral scotoma in both eyes 2 weeks after an episode of flu. Fundus examination showed several dark, brown-reddish, wedge- shaped lesions in both maculae, and red-free fundus photography confirmed the lesions. Fluorescein and indocyanine green angiography was normal. Amsler grid test demonstrated paracentral scotoma. The multifocal electroretinogram (ERG) response was subnormal, and ocular coherence tomography (OCT) confirmed an impaired photoreceptor layer in both eyes. Under the diagnosis of AMN, the patient was fol- lowed-up without treatment. No subjective changes were observed during follow-up, although the damage to the photoreceptor was partially recovered based on spectral-domain OCT (SD-OCT).
Go to : 
References
2. Turbeville SD, Cowan LD, Gass JD. Acute macular neuroretinopathy: a review of the literature. Surv Ophthamol. 2003; 48:1–11.
3. Sieving PA, Fishman GA, Salzano T, Rabb MF. Acute macular neuroretinopathy: early receptor potential change suggests photoreceptor pathology. Br J Ophthalmol. 1984; 68:229–34.

4. Gandorfer A, Ulbig MW. Scanning laser ophthalmoscope finding in acute macular neuroretinopathy. Am J Ophthalmol. 2002; 133:413–5.
5. Gómez-Torreiro M, Gómez-Ulla F, Bolivar Montesa P, Rodriguez-Cid MJ. Scanning laser ophthalmoscope finding in acute macular neuroretinopathy. Retina. 2002; 22:108–9.
6. Watzke RC, Shults WT. Annular macular neuroretinopathy and multifocal electroretinographic and optical coherence tomographic finding. Retina. 2004; 24:772–5.
7. Chan WM, Liu DT, Tong JP. . Longitudinal finding of acute macular neuroretinopathy with multifocal electroretinogram and optical coherence tomography. Clin Experiment Ophthalmol. 2005; 33:439–42.
8. Shukla D, Arora A, Ambatkar S. . Optical coherence tomography finding in acute macular neuroretinopathy. Eye (Lond). 2005; 19:107–8.
9. Monson BK, Greenberg PB, Greenberg E. . High-speed, ultra high resolution optical coherence tomography of acute macular neuroretinopathy. Br J Ophthalmol. 2007; 91:119–20.
10. Hughes EH, Siow YC, Hunyor AP. Acute macular neuroretinopathy: anatomic localisation of the lesion with high resolution OCT. Eye (Lond). 2009; 23:2132–4.
11. Neuhann IM, Inhoffen W, Koerner S. . Visualization and follow-up of acute macular neuroretinopathy with the Spectralis® HRA+OCT device. Graefes Arch Clin Exp Ophthalmol. 2010; 248:1041–4.

12. Corver HD, Ruys J, Kestelyn-Stevens AM. . Two cases of acute macular neuroretinopathy. Eye (Lond). 2007; 21:1226–9.

14. Gass JD, Agarwal A, Scott IU. Acute zonal occult outer retinopathy: A long-term follow-up study. Am J Ophthalmol. 2002; 134:329–39.

15. Mahajan VB, Stone EM. Patients with an acute zonal occult outer retinopathy-like illness rapidly improve with valacyclovir treatment. Am J Ophthalmol. 2010; 150:511–8.

16. Spaide RF, Koizumi H, Freund KB. Photoreceptor outer segment abnormalities as a cause of blind spot enlargement in acute zonal occult outer retinopathy-complex disease. Am J Ophthalmol. 2008; 146:111–20.
Go to : 
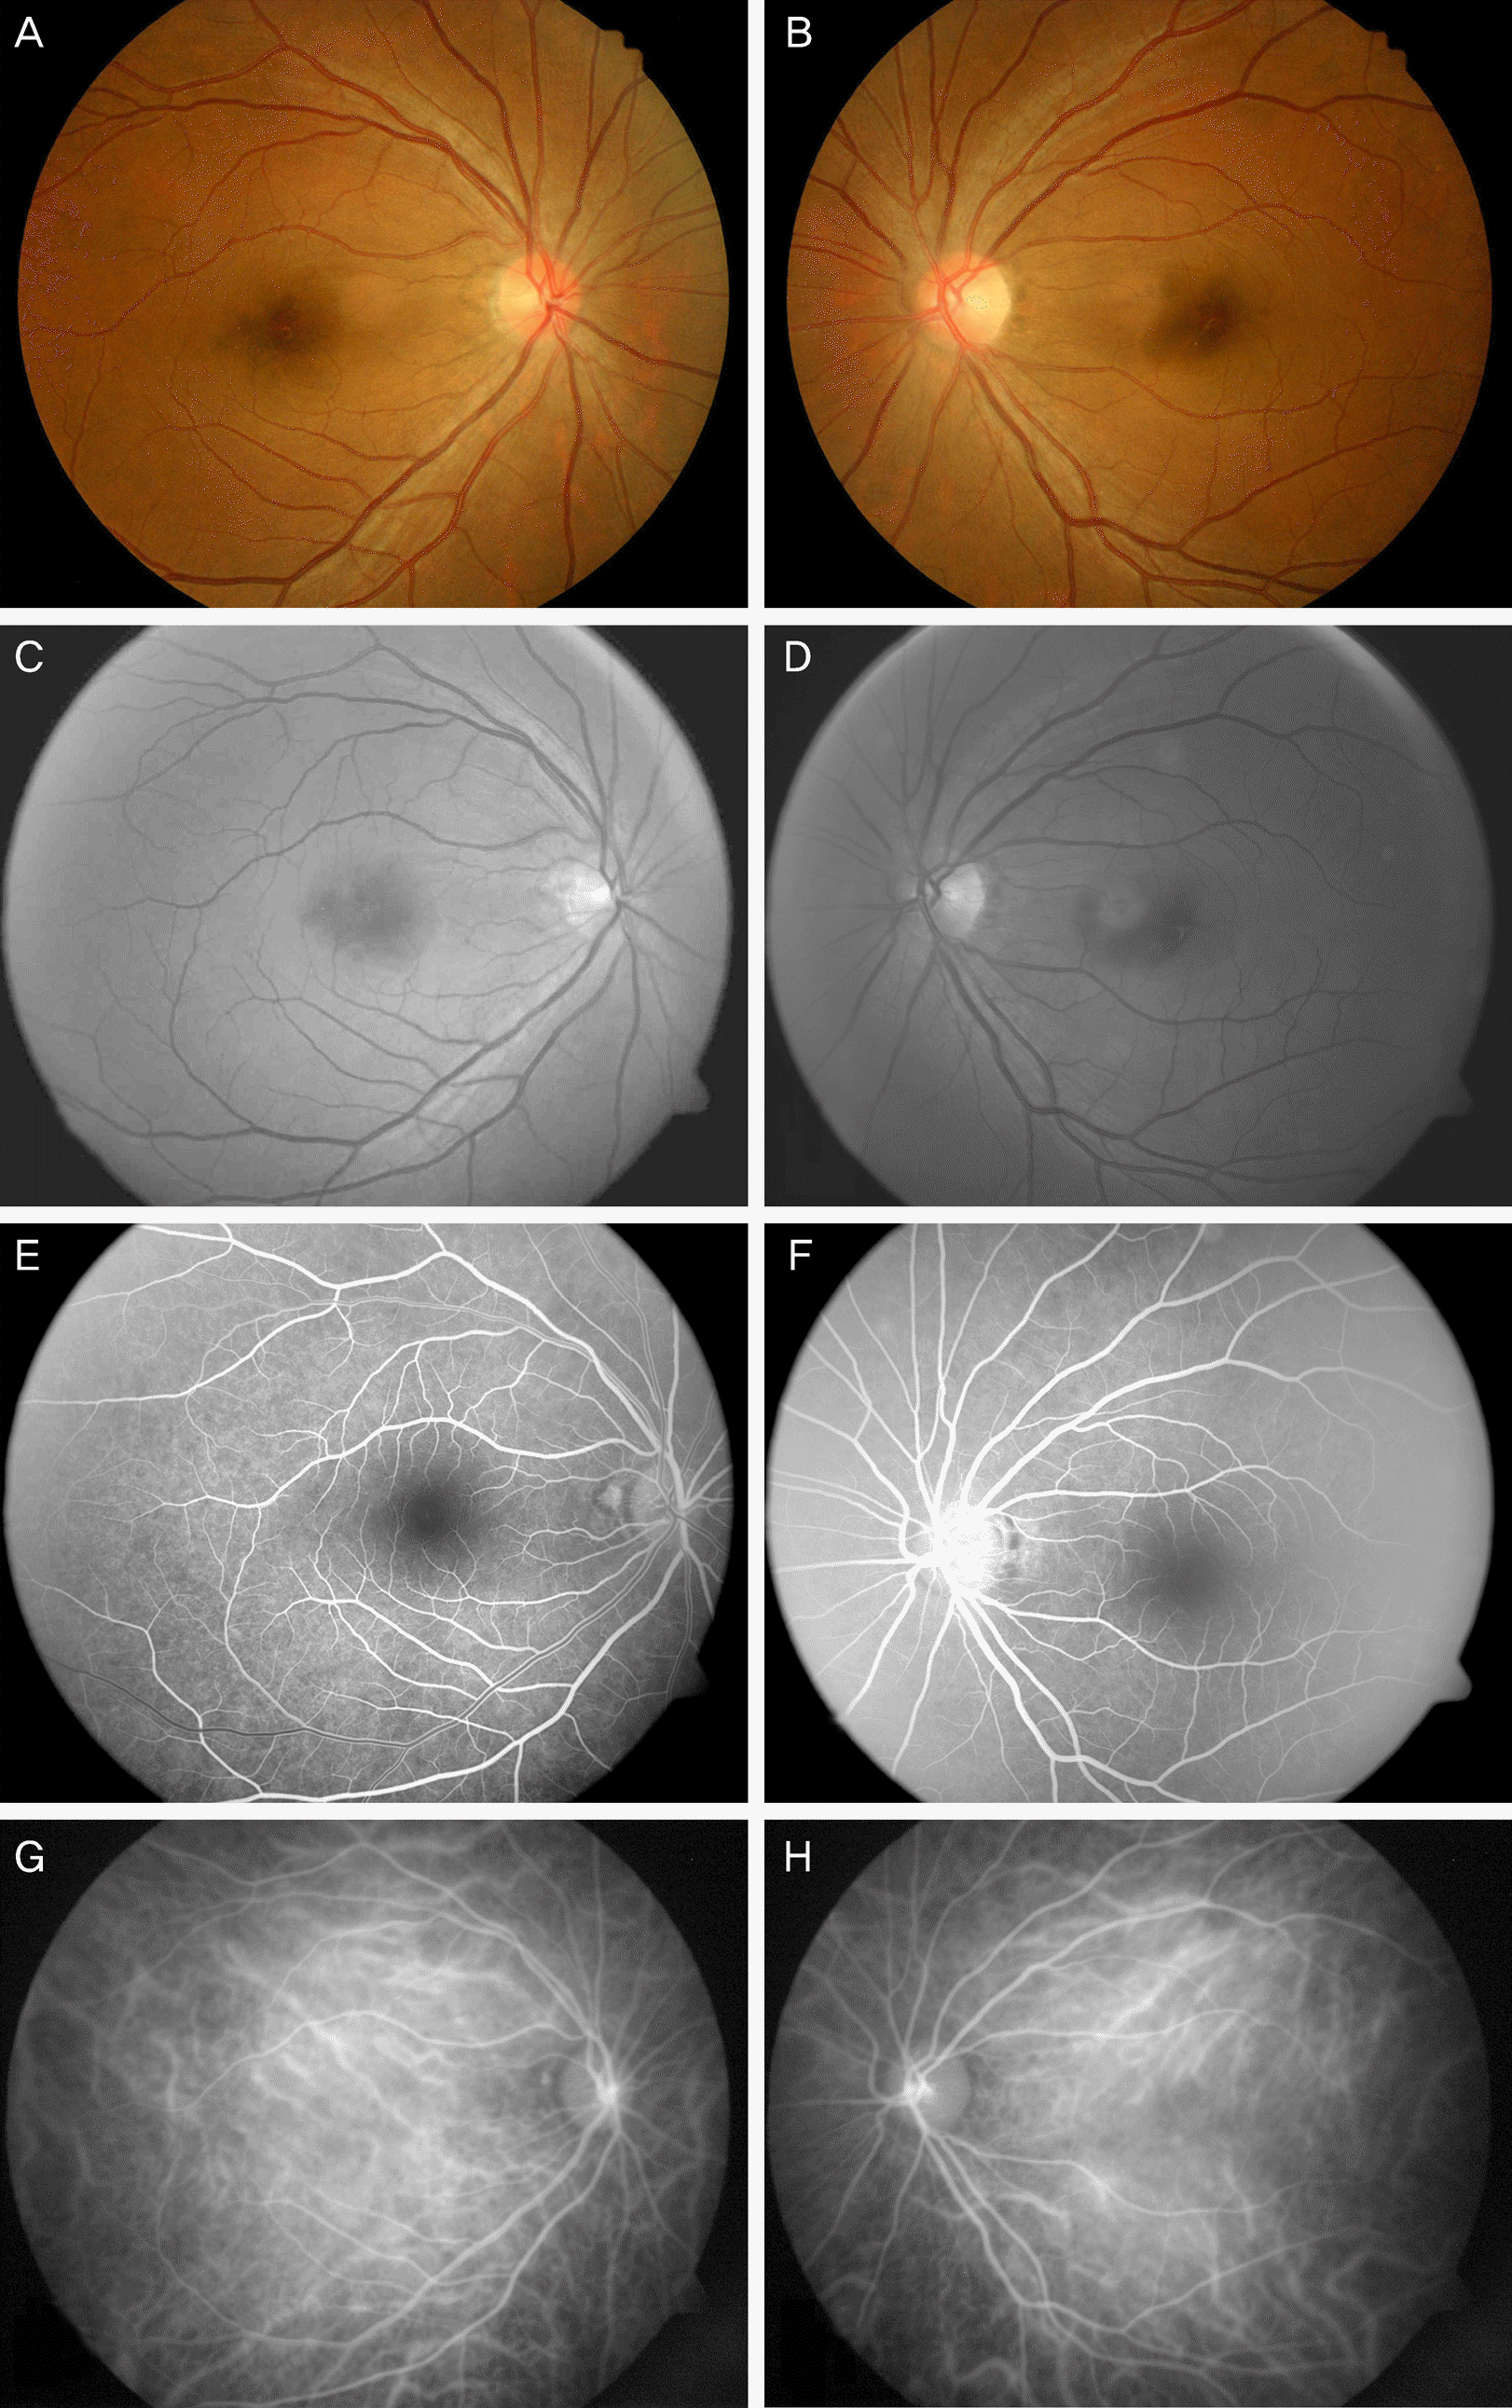 | Figure 1.(A, B) Fundus photographs show subtle, patchy reddish brown discoloration. (C, D) Red-free fundus photographs show focal petaloid dark lesion. (E, F) FAG shows normal findings. (G, H) ICGA shows normal findings. |
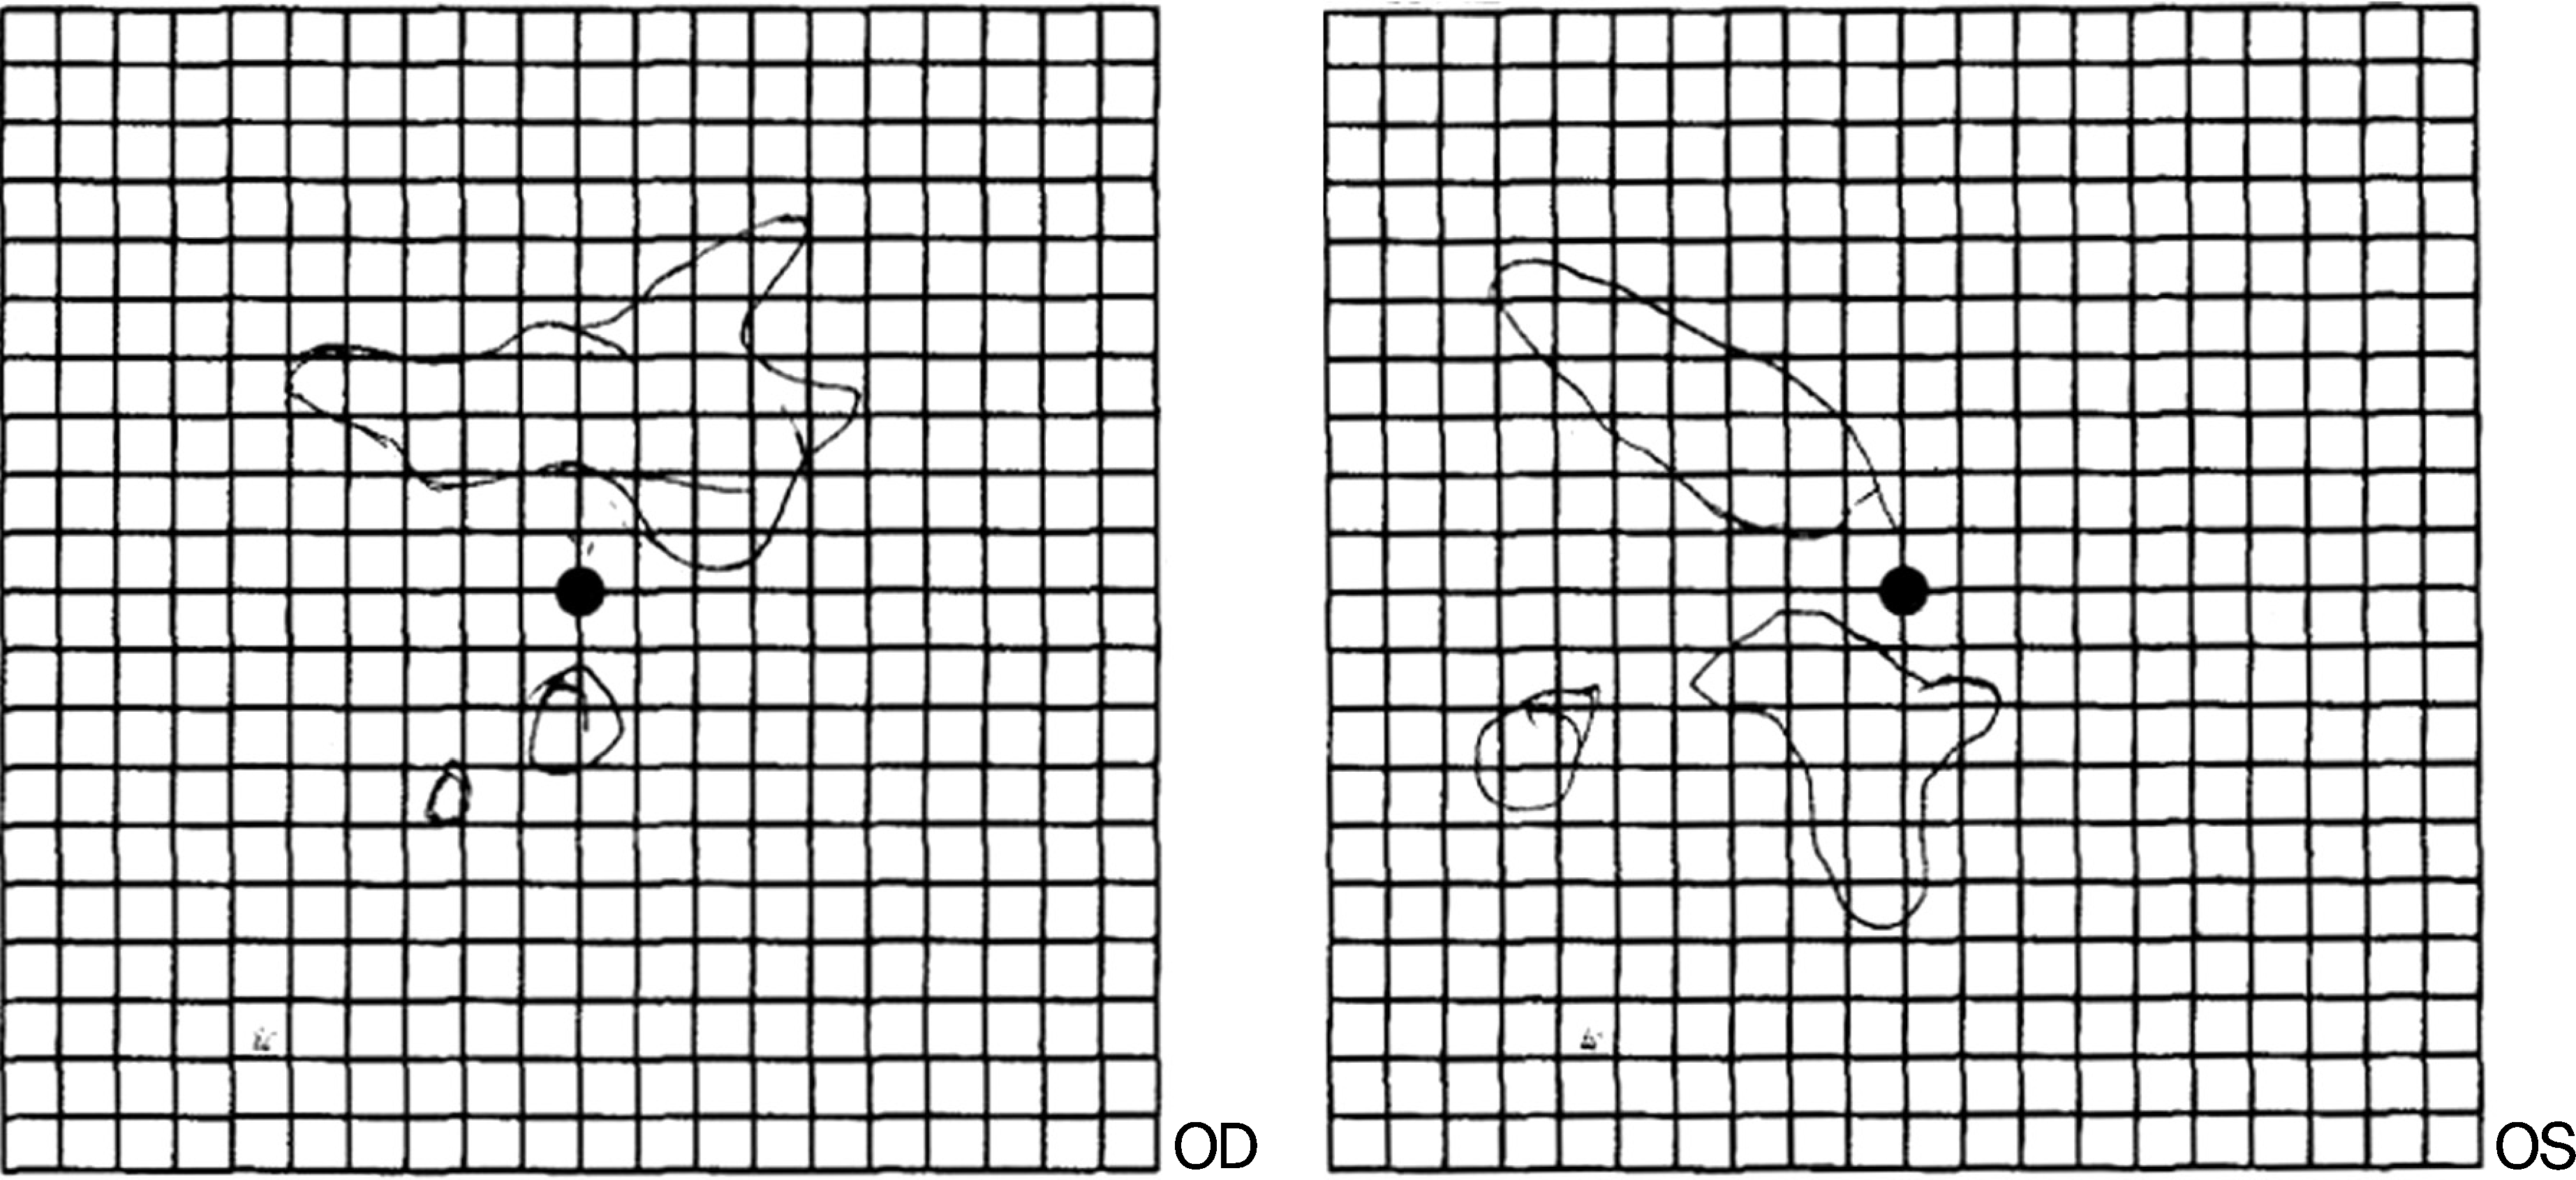 | Figure 2.The patient's Amsler grid drawing shows paracentral scotoma corresponding to the abnormalities on fundui photographs. |
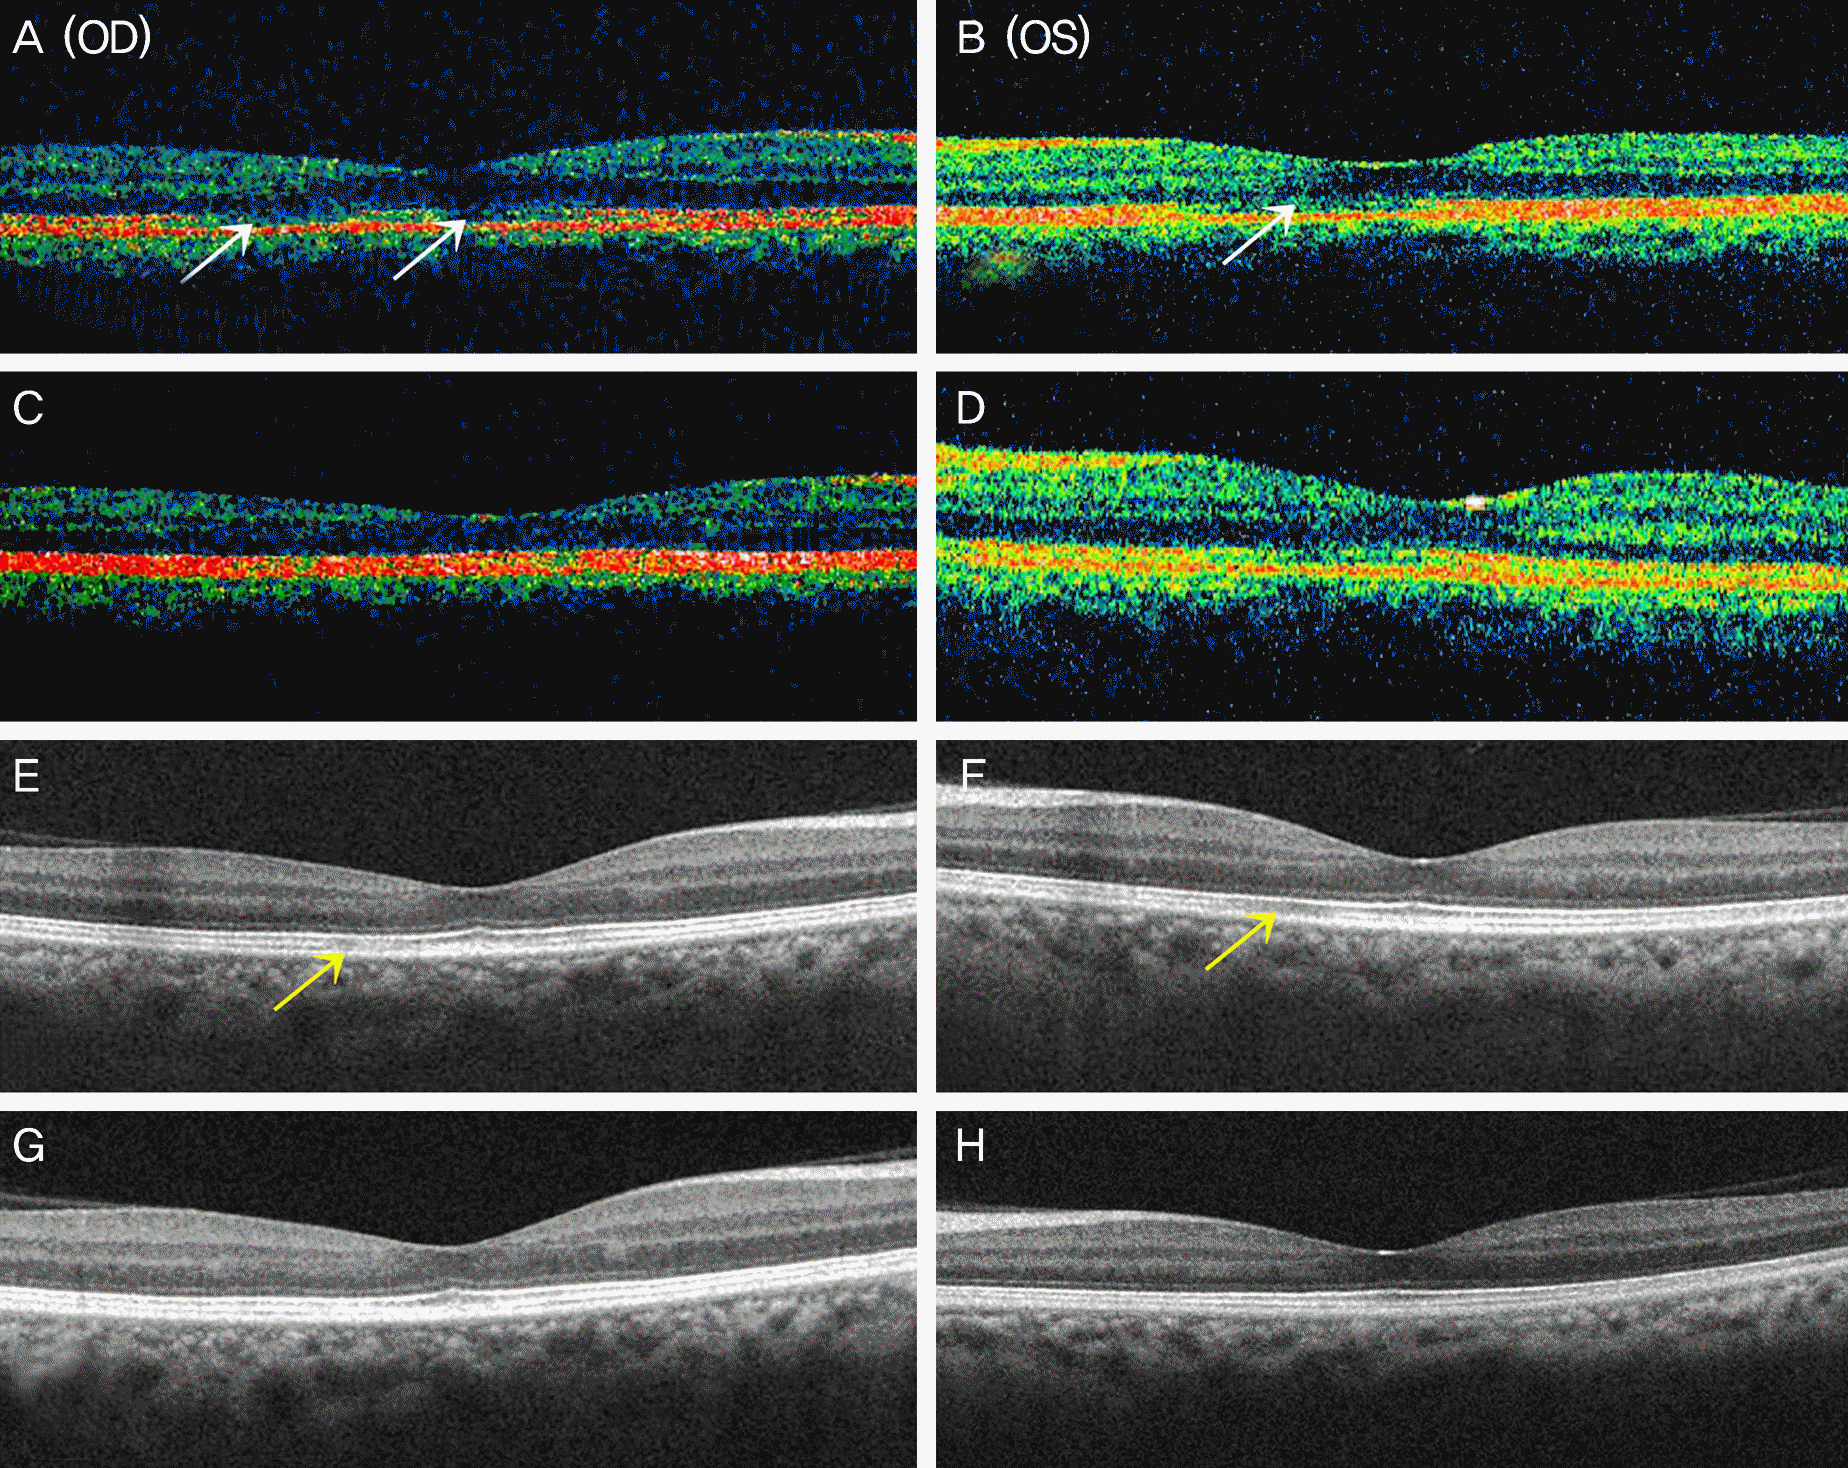 | Figure 3.(A, B) TD-OCT shows defects in the inner margin of the high signal outer band (white arrows). After 6 months, (C, D) TD-OCT shows partial resolution of defect in both eyes. (E, F) After 6 months, SD-OCT shows focal signal reduction in the junction of the photorecepter outer segment with the retinal pigment epithelium (yellow arrow). (G, H) After 2 years, SD-OCT shows slight improvement in both eyes. |


 PDF
PDF ePub
ePub Citation
 Print
Print


 XML Download