Abstract
Purpose
To investigate the reproducibility of choroidal thickness measurements in healthy Koreans using two spectral do-main optical coherence tomography (SD-OCT) instruments: Zeiss Cirrus HD-OCT (Carl Zeiss Meditec Inc., Dublin, CA, USA) and Heidelberg Spectralis (Heidelberg Engineering, Heidelberg, Germany).
Methods
Images were obtained in 60 eyes of 30 healthy undilated volunteers without ocular pathology in a clinical setting. The choroid was imaged in all subjects using Cirrus HD 1-line raster and Spectralis enhanced depth imaging (EDI). The choroid was measured subfoveally, 1500 µm temporal, and 1500 µm nasal to the fovea. All measurements were per-formed by two independent observers. One-way analysis of variance (ANOVA), Pearson correlation, and Bland–Altman analysis were used to compare measurements.
Results
The study group consisted of 15 males and 15 females. The mean age was 50.73 ± 15.09 years (range, 24-75 years). There was no significant difference in the mean choroidal thickness (p > 0.05) between systems for any location. The choroidal thickness measurements using two instruments (Cirrus vs. Spectralis) were also strongly correlated (p < 0.001).
References
1. Torres VL, Brugnoni N, Kaiser PK, Singh AD. Optical coherence tomography enhanced depth imaging of choroidal tumors. Am J Ophthalmol. 2011; 151:586–93.e2.

3. Gemenetzi M, De Salvo G, Lotery AJ. Central serous chorioretin-opathy: an update on pathogenesis and treatment. Eye (Lond). 2010; 24:1743–56.

4. Spaide RF, Koizumi H, Pozzoni MC. Enhanced depth imaging spectral-domain optical coherence tomography. Am J Ophthalmol. 2008; 146:496–500.

5. Branchini L, Regatieri CV, Flores-Moreno I. . Reproducibility of choroidal thickness measurements across three spectral domain optical coherence tomography systems. Ophthalmology. 2012; 119:119–23.

6. Manjunath V, Fujimoto JG, Duker JS. Cirrus HD-OCT high defi-nition imaging is another tool available for visualization of the cho-roid and provides agreement with the finding that the choroidal thickness is increased in central serous chorioretinopathy in com-parison to normal eyes. Retina. 2010; 30:1320–1.
7. Manjunath V, Taha M, Fujimoto JG, Duker JS. Choroidal thickness in normal eyes measured using Cirrus HD optical coherence tomography. Am J Ophthalmol. 2010; 150:325–9.

8. Yamashita T, Yamashita T, Shirasawa M. . Repeatability and reproducibility of subfoveal choroidal thickness in normal eyes of Japanese using different SD-OCT devices. Invest Ophthalmol Vis Sci. 2012; 53:1102–7.

9. Benavente-Pérez A, Hosking SL, Logan NS, Bansal D. Reproducibility- repeatability of choroidal thickness calculation using optical co-herence tomography. Optom Vis Sci. 2010; 87:867–72.
10. Carrasco S, Torres JP, Torner L. . Enhancing the axial reso-lution of quantum optical coherence tomography by chirped qua-si-phase matching. Opt Lett. 2004; 29:2429–31.

11. Fujiwara T, Imamura Y, Margolis R. . Enhanced depth imaging optical coherence tomography of the choroid in highly myopic eyes. Am J Ophthalmol. 2009; 148:445–50.

12. Ikuno Y, Maruko I, Yasuno Y. . Reproducibility of retinal and choroidal thickness measurements in enhanced depth imaging and high-penetration optical coherence tomography. Invest Ophthalmol Vis Sci. 2011; 52:5536–40.

13. Imamura Y, Fujiwara T, Margolis R, Spaide RF. Enhanced depth imaging optical coherence tomography of the choroid in central se-rous chorioretinopathy. Retina. 2009; 29:1469–73.

14. Imamura Y, Iida T, Maruko I. . Enhanced depth imaging optical coherence tomography of the sclera in dome-shaped macula. Am J Ophthalmol. 2011; 151:297–302.

15. Ikuno Y, Kawaguchi K, Nouchi T, Yasuno Y. Choroidal thickness in healthy Japanese subjects. Invest Ophthalmol Vis Sci. 2010; 51:2173–6.

16. Manjunath V, Goren J, Fujimoto JG, Duker JS. Analysis of choroi-dal thickness in age-related macular degeneration using spec-tral-domain optical coherence tomography. Am J Ophthalmol. 2011; 152:663–8.

17. Hirata M, Tsujikawa A, Matsumoto A. . Macular choroidal thickness and volume in normal subjects measured by swept- source optical coherence tomography. Invest Ophthalmol Vis Sci. 2011; 52:4971–8.
18. Margolis R, Spaide RF. A pilot study of enhanced depth imaging optical coherence tomography of the choroid in normal eyes. Am J Ophthalmol. 2009; 147:811–5.

19. Kim SW, Oh J, Kwon SS. . Comparison of choroidal thickness among patients with healthy eyes, early age-related maculopathy, neovascular age-related macular degeneration, central serous cho-rioretinopathy, and polypoidal choroidal vasculopathy. Retina. 2011; 31:1904–11.

20. Esmaeelpour M, Povazay B, Hermann B. . Three-dimensional 1060-nm OCT: choroidal thickness maps in normal subjects and improved posterior segment visualization in cataract patients. Invest Ophthalmol Vis Sci. 2010; 51:5260–6.

Figure 1.
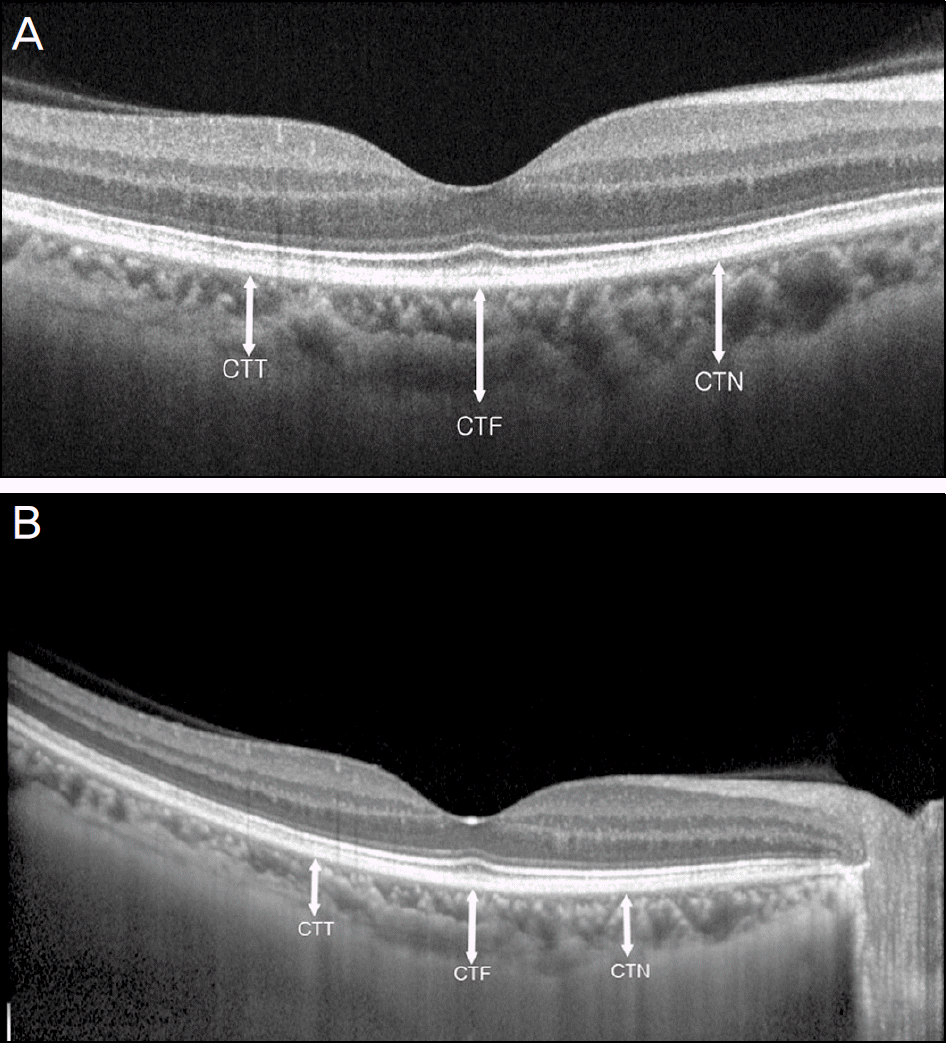
Optical coherence tomography scans showing cho-roidal thicknesses of the same subject on Cirrus and Spectralis. (A) An OCT image of the subject on Cirrus (Carl Zeiss Meditec Inc., Dublin, CA). Image averaging is used for cho-roidal visualization. choroidal thickness measurements was taken perpendicularly from the outer edge of the hyper-re-flective retinal pigment epithelium to the inner sclera at the fo-vea, 1500 μ m temporal to the fovea, and 1500 μ m nasal to the fovea. (B) An OCT image of subject on Spectralis. Image averaging with the aid of the eye tracking and EDI are used for choroidal visualization. Choroidal thickness measurements was taken at the fovea, 1500 μ m temporal to the fovea, and 1500 μ m nasal to the fovea (CTN: choroidal thickness meas-ured at 1.5 mm nasal to the fovea, CTF subfoveal choroidal thickness, CTT choroidal thickness measured at 1.5 mm tem-poral to the fovea).

Figure 2.
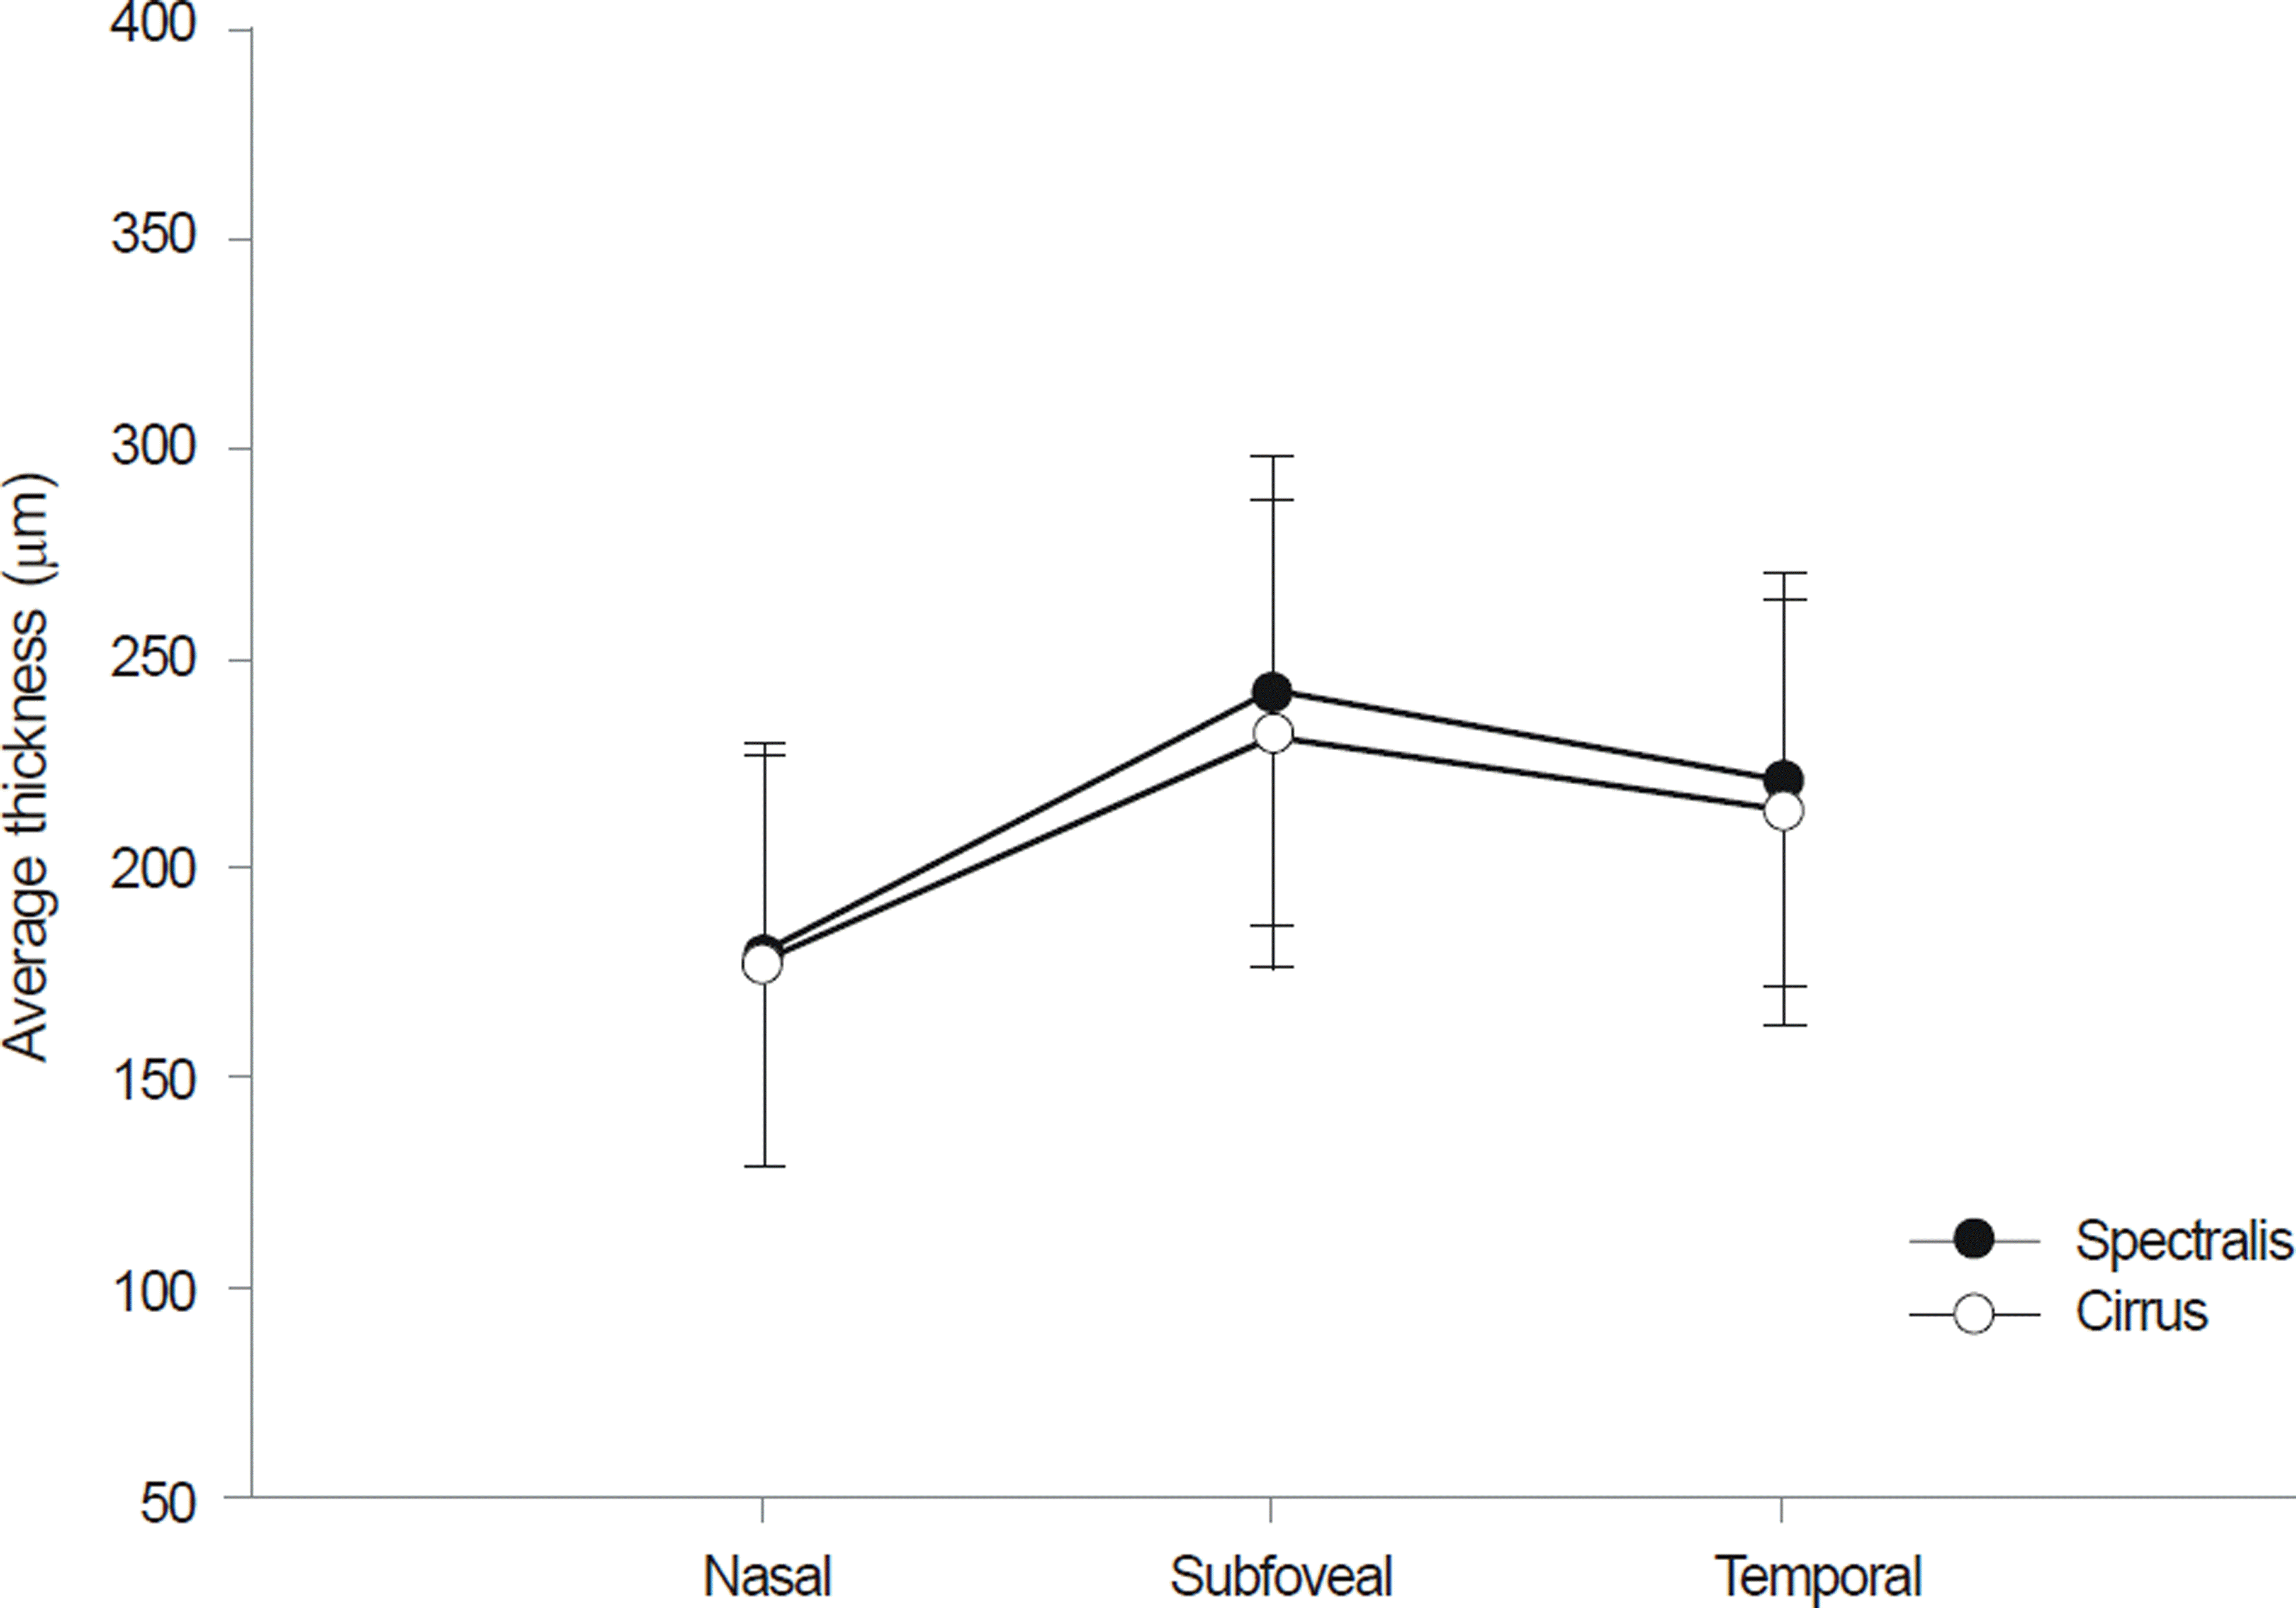
Graph showing mean choroidal thickness measure-ment in normal eyes at the fovea, 1.5 mm nasal to the fovea, and 1.5 mm temporal to the fovea.

Figure 3.
Bland-Altman plots for Cirrus vs. Spectralis. (A) Bland-Altman plot for subfoveal choroidal thickness. Mean dif-ference is 2.425 (95% CI -0.174 to 5.024). The 95% limits of agreement for choroidal thickness measurements are -17.694 to 22.544. (B) Bland-Altman plot for choroidal thickness of the na-sal fovea. Mean difference is 0.733 (95% CI -1.489 to 2.956). The 95% limits of agreement are -16.476 to 17.942. (C) Bland- Altman plot forchoroidal thickness of the temporal fovea. Mean difference is 1.292 (95% CI -1.659 to 4.242). The 95% limits of agreement for choroidal thickness measurements between Cirrus and Spectralis are -21.549 to 24.133.

Table 1.
Inter-grader comparison of choroidal thickness measurements for cirrus and spectralis
| Location |
Spectralis |
Cirrus |
||
|---|---|---|---|---|
| Correlation coefficient | p-value | Correlation coefficient | p-value | |
| CTN* | 0.945 | <0.001§ | 0.919 | <0.001§ |
| CTF† | 0.977 | <0.001§ | 0.966 | <0.001§ |
| CTT‡ | 0.953 | <0.001§ | 0.890 | <0.001§ |
Table 2.
Summary of previous studies on demographics and choroidal thickness measurements using various optical coherence to-mographies in normal subjects


 PDF
PDF ePub
ePub Citation
 Print
Print


 XML Download