Abstract
Purpose
The purpose of this study was to investigate the error tendency between preoperative expected refraction and postoperative manifest refraction based on axial length, anterior chamber depth, and keratometric data obtained by an au-tomated keratometer and Pentacam® in cataract surgery cases and to report how their differences affect determination of intraocular lens (IOL) power.
Methods
The authors retrospectively reviewed the medical records of 110 eyes of 84 patients who underwent cataract surgery. Axial length and anterior chamber depth were measured by A scan ultrasound biometry, while keratometric val-ues were obtained by an automated keratometer and Pentacam®. IOL power was calculated using the SRK/T formula. Patients were divided into 3 groups based on the axial length, anterior chamber depth, and the difference of keratometric values between the 2 devices. Refractive error was analyzed 2 months after surgery.
Results
There were no statistically significant differences between axial length and anterior chamber depth among the groups; however, the K reading differences were statistically significant. Although the mean absolute error (MAE) of each group showed no statistical significance among the groups, the MAE was more pronounced in the group in which the kera-tometeric value measured by Pentacam® differed more than 1.00 diopter from the automated keratometer measurements. Conclusions: There was no statistically significant difference between axial length and anterior chamber depth among the groups. A difference of 1.00 diopter or more between the keratometric values obtained by an automated keratometer and Pentacam® significantly affects the postoperative refractive error; therefore, these factors should be considered when de-termining IOL power.
References
1. Holladay JT, Prager TC, Ruiz RS. . Improving the predict-ability of intraocular lens power calculations. Arch Ophthalmol. 1986; 104:539–41.

2. Mamalis N. Complications of foldable intraocular lenses requiring explanation or secondary intervention-1998 survey. J Cataract Refract Surg. 2000; 26:766–72.
3. Olsen T. Sources of error in intraocular lens power calculation. J Cataract Refract Surg. 1992; 18:125–9.

4. Maeng HS, Ryu EH, Chung TY, Chung ES. Effects of anterior chamber depth and axial length on refractive error after intra-ocularlens implantation. J Korean Ophthalmol Soc. 2010; 51:195–202.
5. Koranyi G, Lydahl E, Norrby S, Taube M. Anterior chamber depth measurement: a-scan versus optical methods. J Cataract Refract Surg. 2002; 28:243–7.

6. Hosny M, Alio JL, Claramonte P. . Relationship between ante-rior chamber depth, refractive state, corneal diameter, and axial length. J Refract Surg. 2000; 16:336–40.

7. Olsen T. Prediction of the effective postoperative (intraocular lens) anterior chamber depth. J Cataract Refract Surg. 2006; 32:419–24.

8. Norrby S. Sources of error in intraocular lens power calculation. J Cataract Refract Surg. 2008; 34:368–76.

9. Speicher L. Intra-ocular lens calculation status after corneal re-fractive surgery. Curr Opin Ophthalmol. 2001; 12:17–29.

10. Gonen T, Cosar CB, Sener B, Keskinbora KH. Comparison of ker-atometric data obtained by automated keratometer, dicon ct200, al-legro topolyzer, and pentacam. J Refract Surg. 2012; 28:557–61.
11. Salouti R, Nowroozzadeh MH, Zamani M. . Comparison of an-terior chamber depth measurements using Galilei, HR Pentacam, and Orbscan II. Optometry. 2010; 81:35–9.

12. Shammas HJ, Hoffer KJ, Shammas MC. Scheimpflug photography keratometry readings for routine intraocular lens power calculation. J Cataract Refract Surg. 2009; 35:330–4.

13. Chang M, Kang SY, Kim HM. Which keratometer is most reliable for correcting astigmatism with toric intraocular lenses? Korean J Ophthalmol. 2012; 26:10–4.

14. Savini G, Barboni P, Carbonelli M, Hoffer KJ. Accuracy of Scheimpflug corneal power measurements for intraocular lens power calculation. J Cataract Refract Surg. 2009; 35:1193–7.

15. Módis L Jr, Szalai E, Kolozsvári B. . Keratometry evaluations with the Pentacam high resolution in comparison with the auto-mated keratometry and conventional corneal topography. Cornea. 2012; 31:36–41.

16. Maeng HS, Ryu EH, Chung TY, Chung ES. Effects of anterior chamber depth and axial length on refractive error after intraocular lens implantation. J Korean Ophthalmol Soc. 2010; 51:195–202.

17. Weissman JL, Beatty RL, Hirsch WL, Curtin HD. Enlarged ante-rior chamber: CT finding of a ruptured globe. AJNR Am J Neuroradiol. 1995; 16((4 Suppl)):936–8.
18. Masket S. Chang DF, editor. Alcon Restor multifocal-clinical pearls. Mastering refractive IOLs: The art and science. Thorofare, NJ: SLACK Incorporated;2008; chap. 38.
19. Gale RP, Saldana M, Johnston RL. . Benchmark standards for refractive outcomes after NHS cataract surgery. Eye (Lond). 2009; 23:149–52.

20. Jo DH, Oh JY, Kim MK, Wee WR. Corneal power estimation using Orbscan II videokeratography in eyes with previous corneal re-fractive surgeries. J Korean Ophthalmol Soc. 2009; 50:1730–4.

21. Tang Q, Hoffer KJ, Olson MD, Miller KM. Accuracy of Scheimpflug Holladay equivalent keratometry readings after corneal refractive surgery. J Cataract Refract Surg. 2009; 35:1198–203.

22. Kim SW, Kim EK, Cho BJ. . Use of the pentacam true net cor-neal power for intraocular lens calculation in eyes after refractive corneal surgery. J Refract Surg. 2009; 25:285–9.
23. Symes RJ, Ursell PG. Automated keratometry in routine cataract surgery: comparison of Scheimpflug and conventional values. J Cataract Refract Surg. 2011; 37:295–301.

24. Retzlaff JA, Sanders DR, Kraff MC. Development of the SRK/T intraocular lens implant power calculation formula. J Cataract Refract Surg. 1990; 16:333–40.

25. Cho YT, Lee EH. Evaluation for the accuracy of the SRK/T Formula in PCL Implanted Patients(I). J Korean Opthalmol Soc. 1991; 32:752–60.
26. Aristodemou P, Knox Cartwright NE, Sparrow JM, Johnston RL. Formula choice: Hoffer Q, Holladay 1, or SRK/T and refractive outcomes in 8108 eyes after cataract surgery with biometry by par-tial coherence interferometry. J Cataract Refract Surg. 2011; 37:63–71.

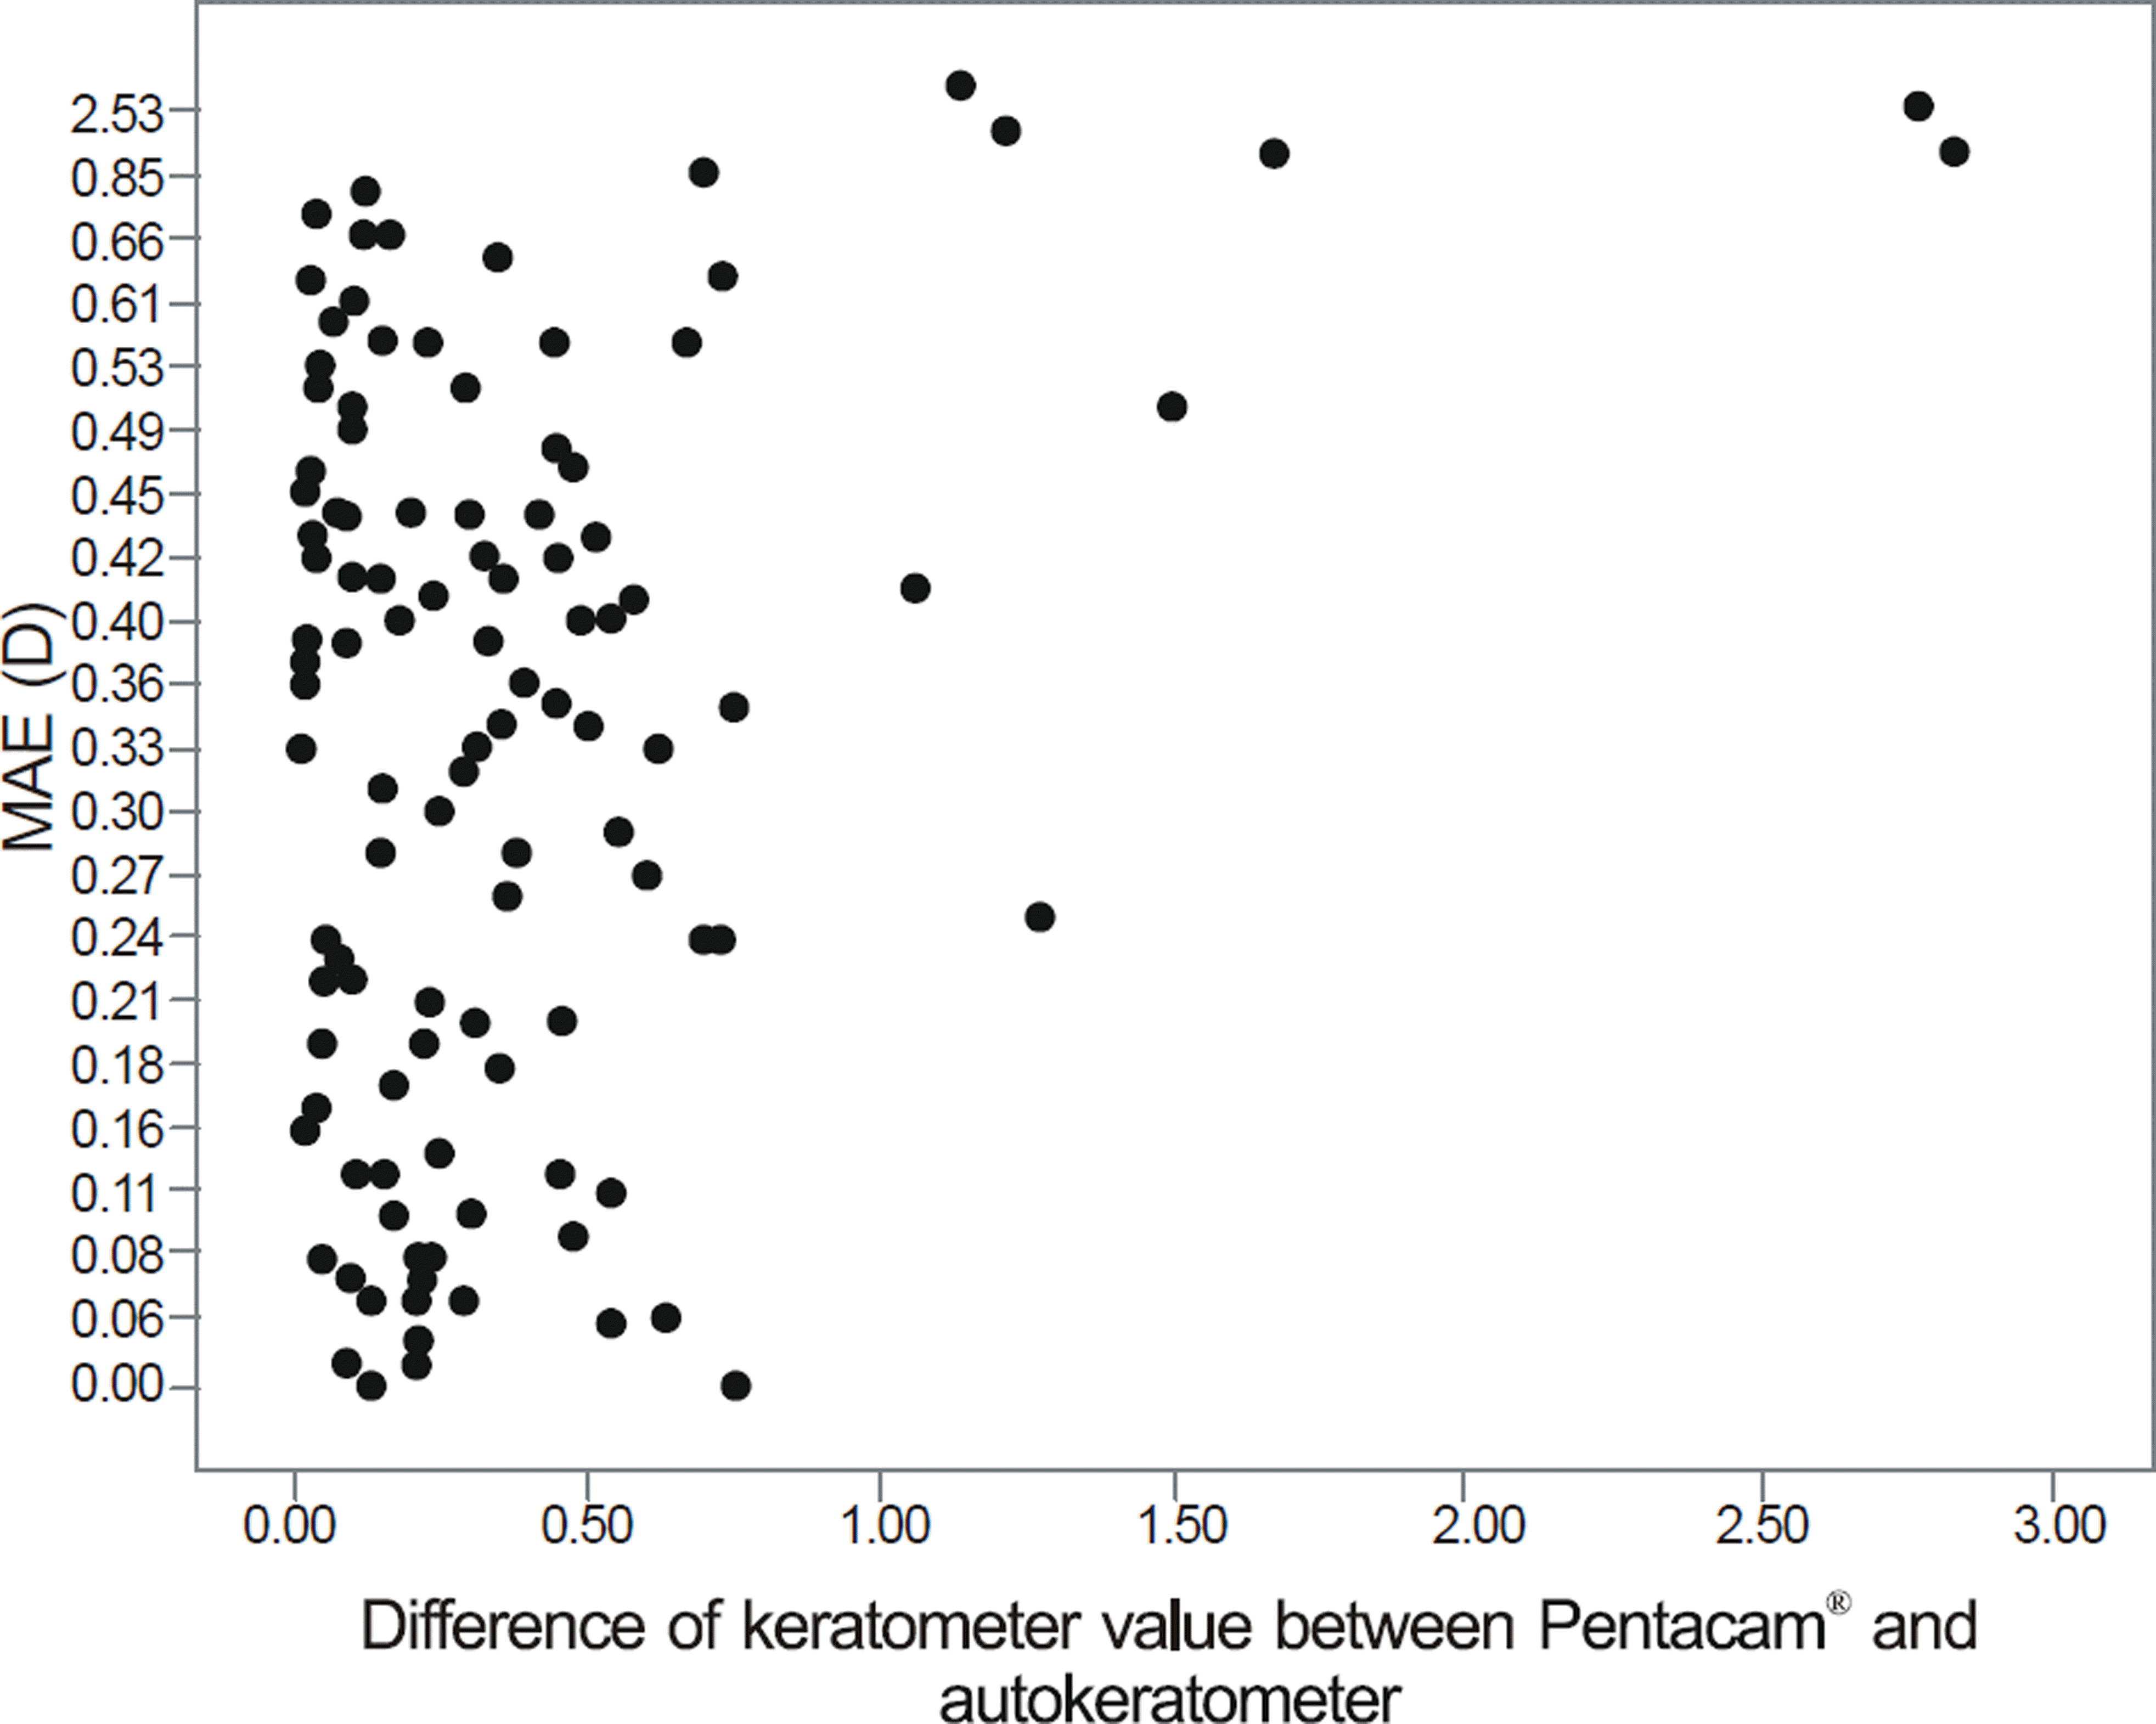
Figure 1.
Relationship between mean absolute error (MAE) and difference of keratometeric value between Pentacam® and autokeratometer. Note that the majority of large amount of MAE occurs among the group of which keratometer measured by Pentacam differed more than 1.00 diopter from autokeratometer.

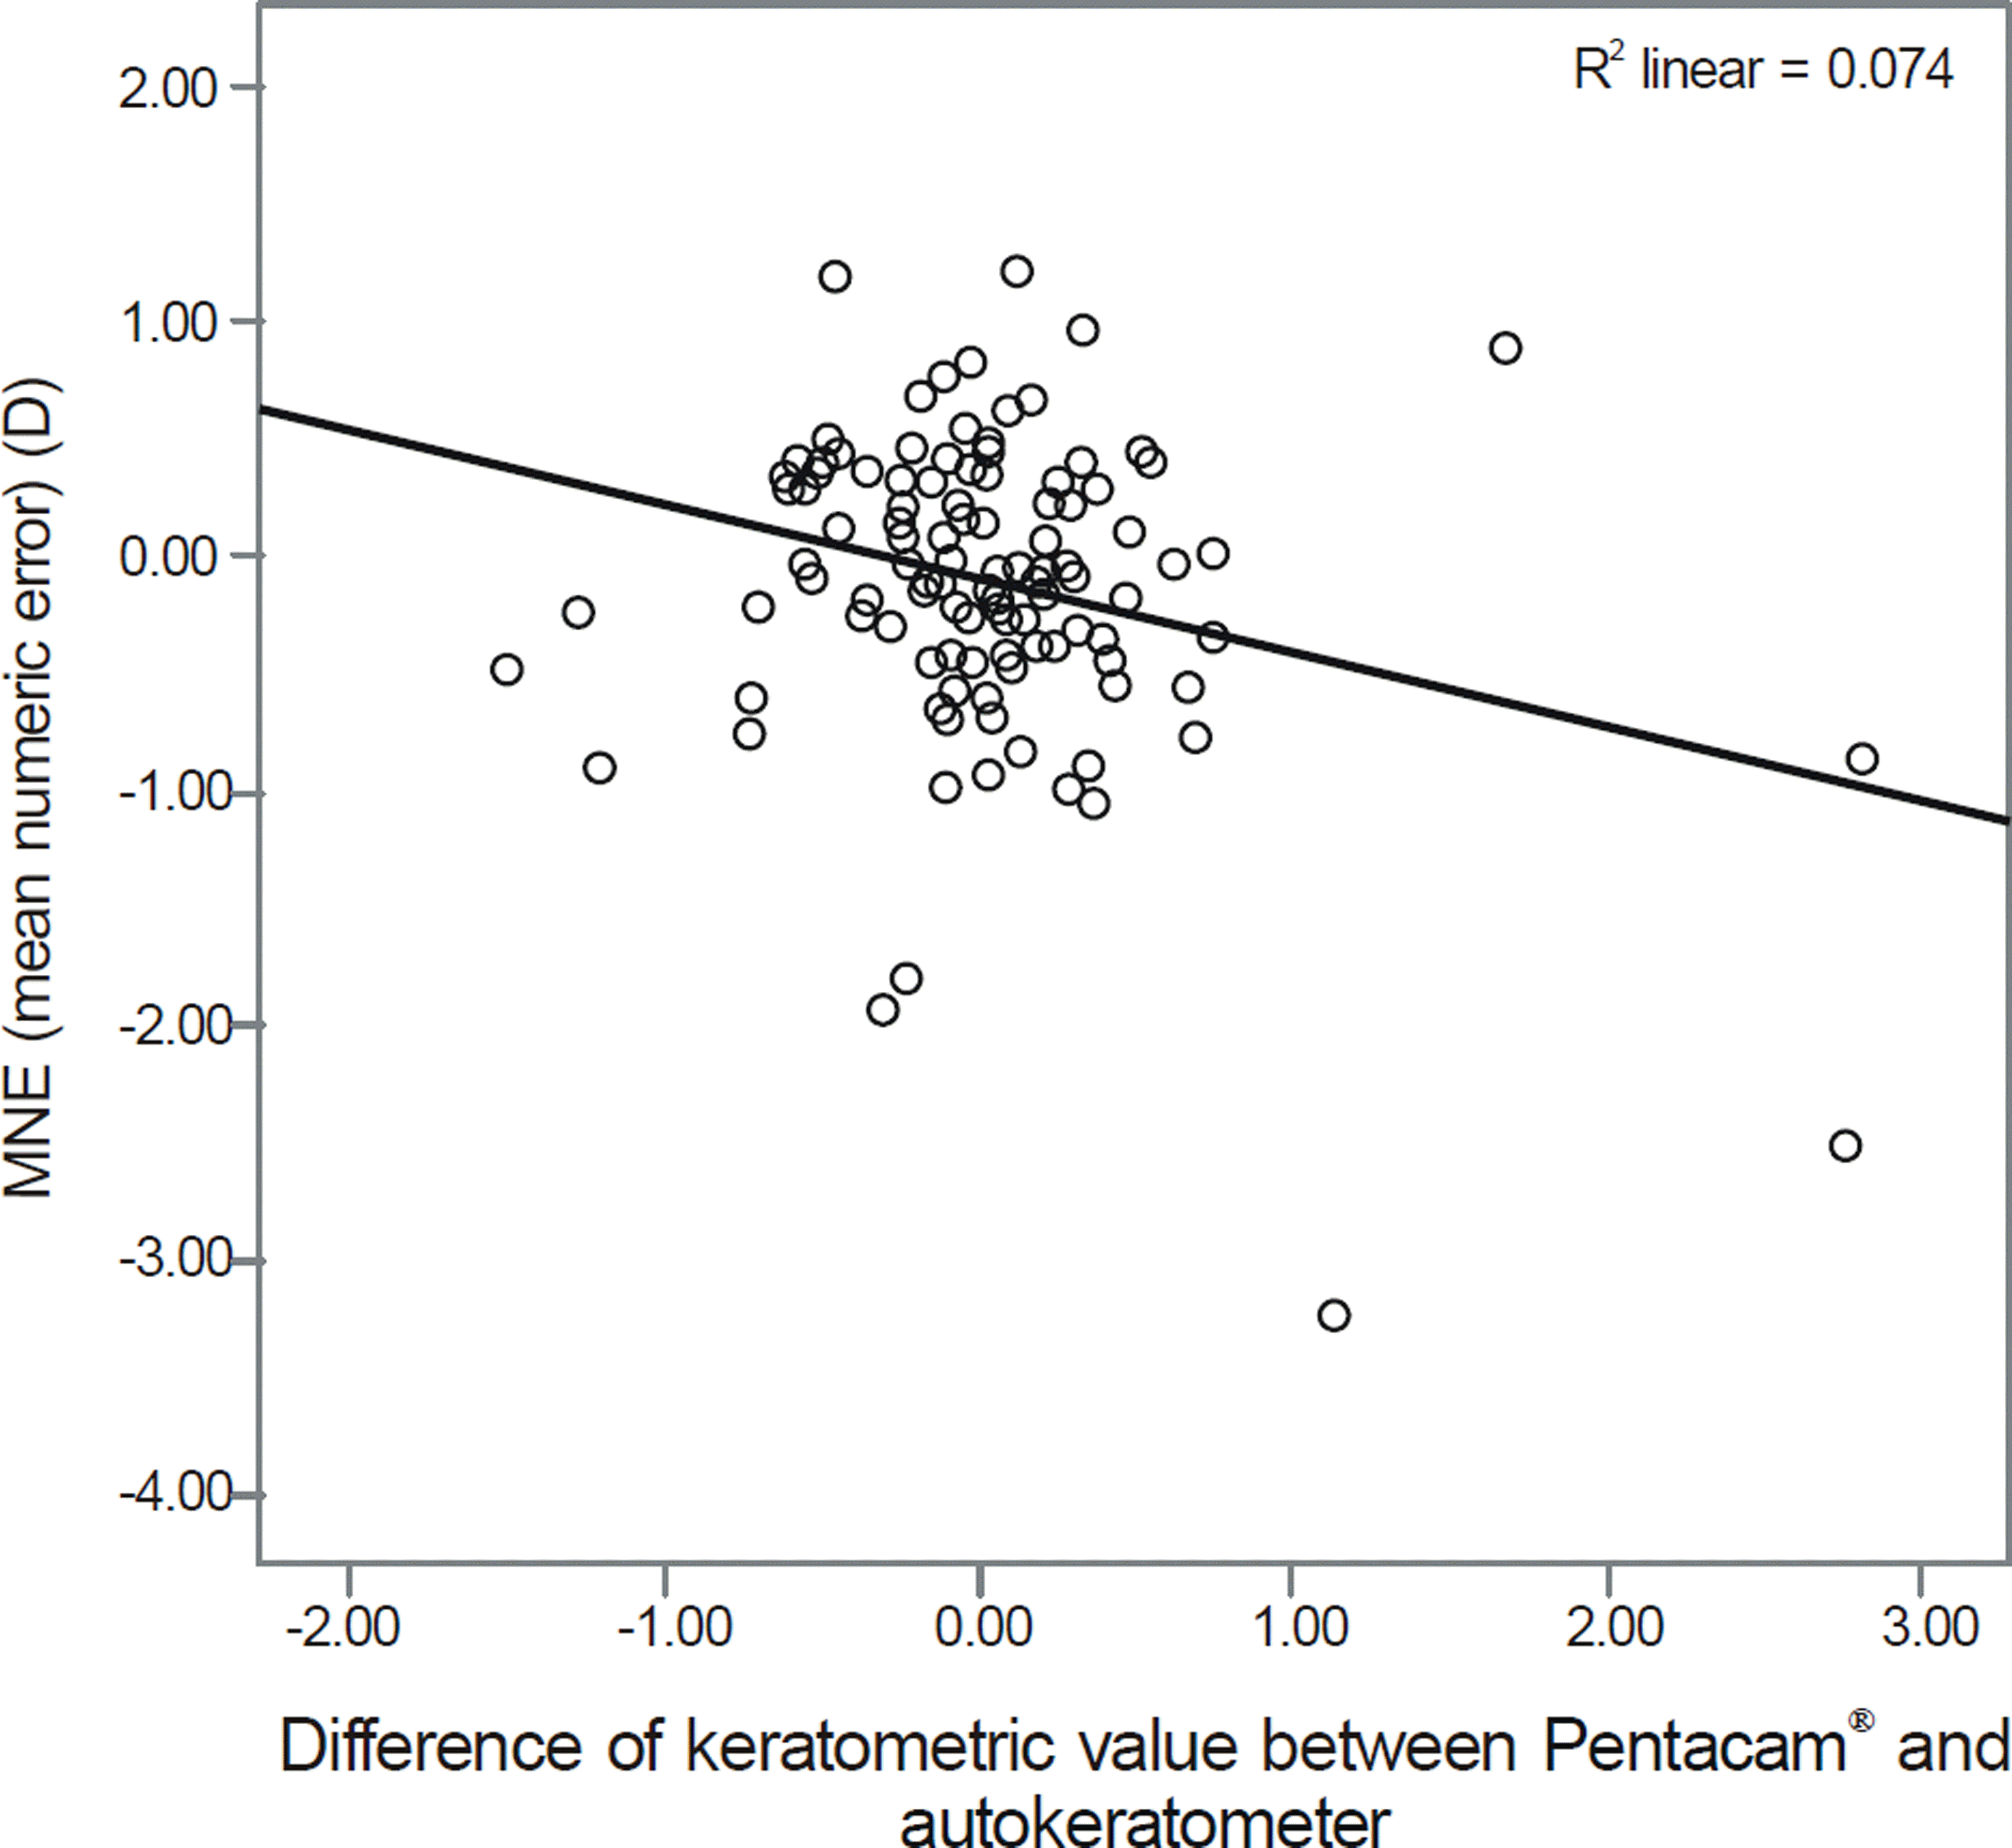
Figure 2.
Relationship between mean numeric error (MNE) and difference of keratometeric values between Pentacam® and autokeratometer (Pearson Correlation = -0.272, p < 0.01). Difference of keratometric value between Pentacam® and au-tokeratometer = Pentacam® mean corneal front power kerato-metric value - Autokeratometer mean keratometric value.

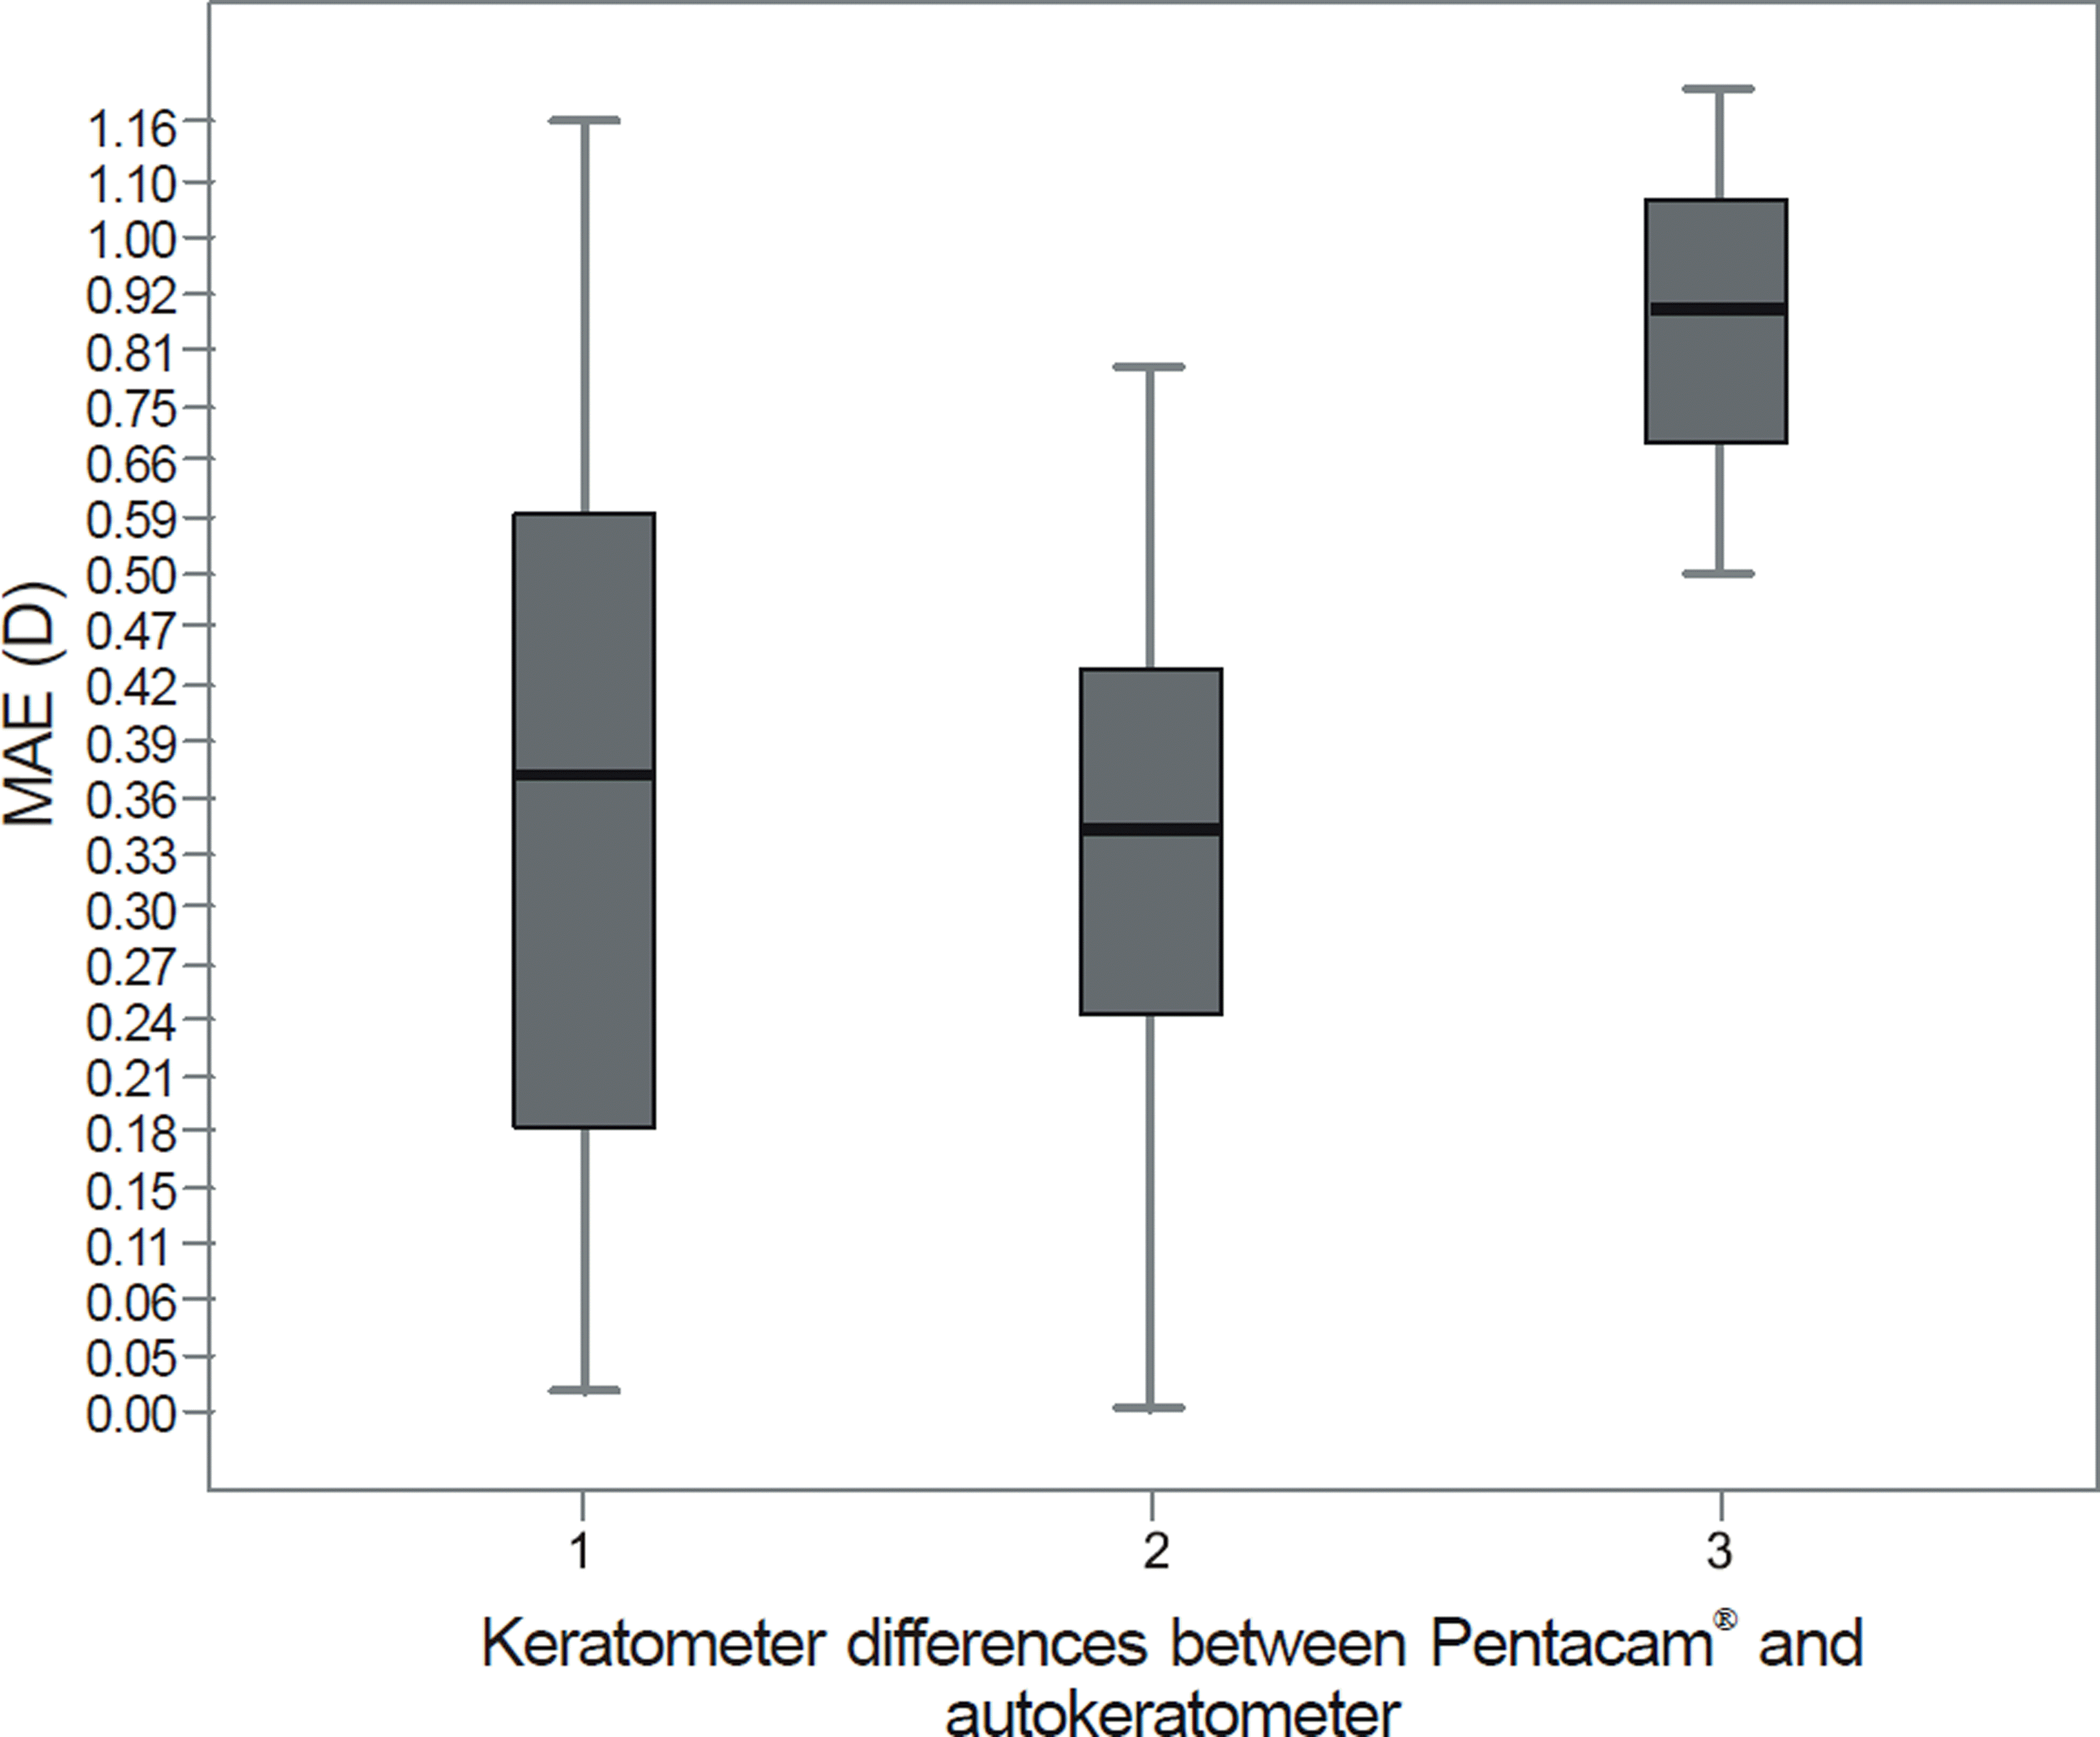
Figure 3.
Comparison of mean absolute error (MAE) of IOL calculation measured by autokeratometer and Pentacam®. IOL power prediction is more accurate measured in groups 1 and 2, than in group 3 of which keratometer values measured by Pentacam® differed more than 1.00 diopter from autokera-tometer (Group 1. vs. Group 2. p = 1.00, Group 2. vs. Group 3. p = 0.00, Group 1. vs. Group 3. p = 0.00, ANOVA test).

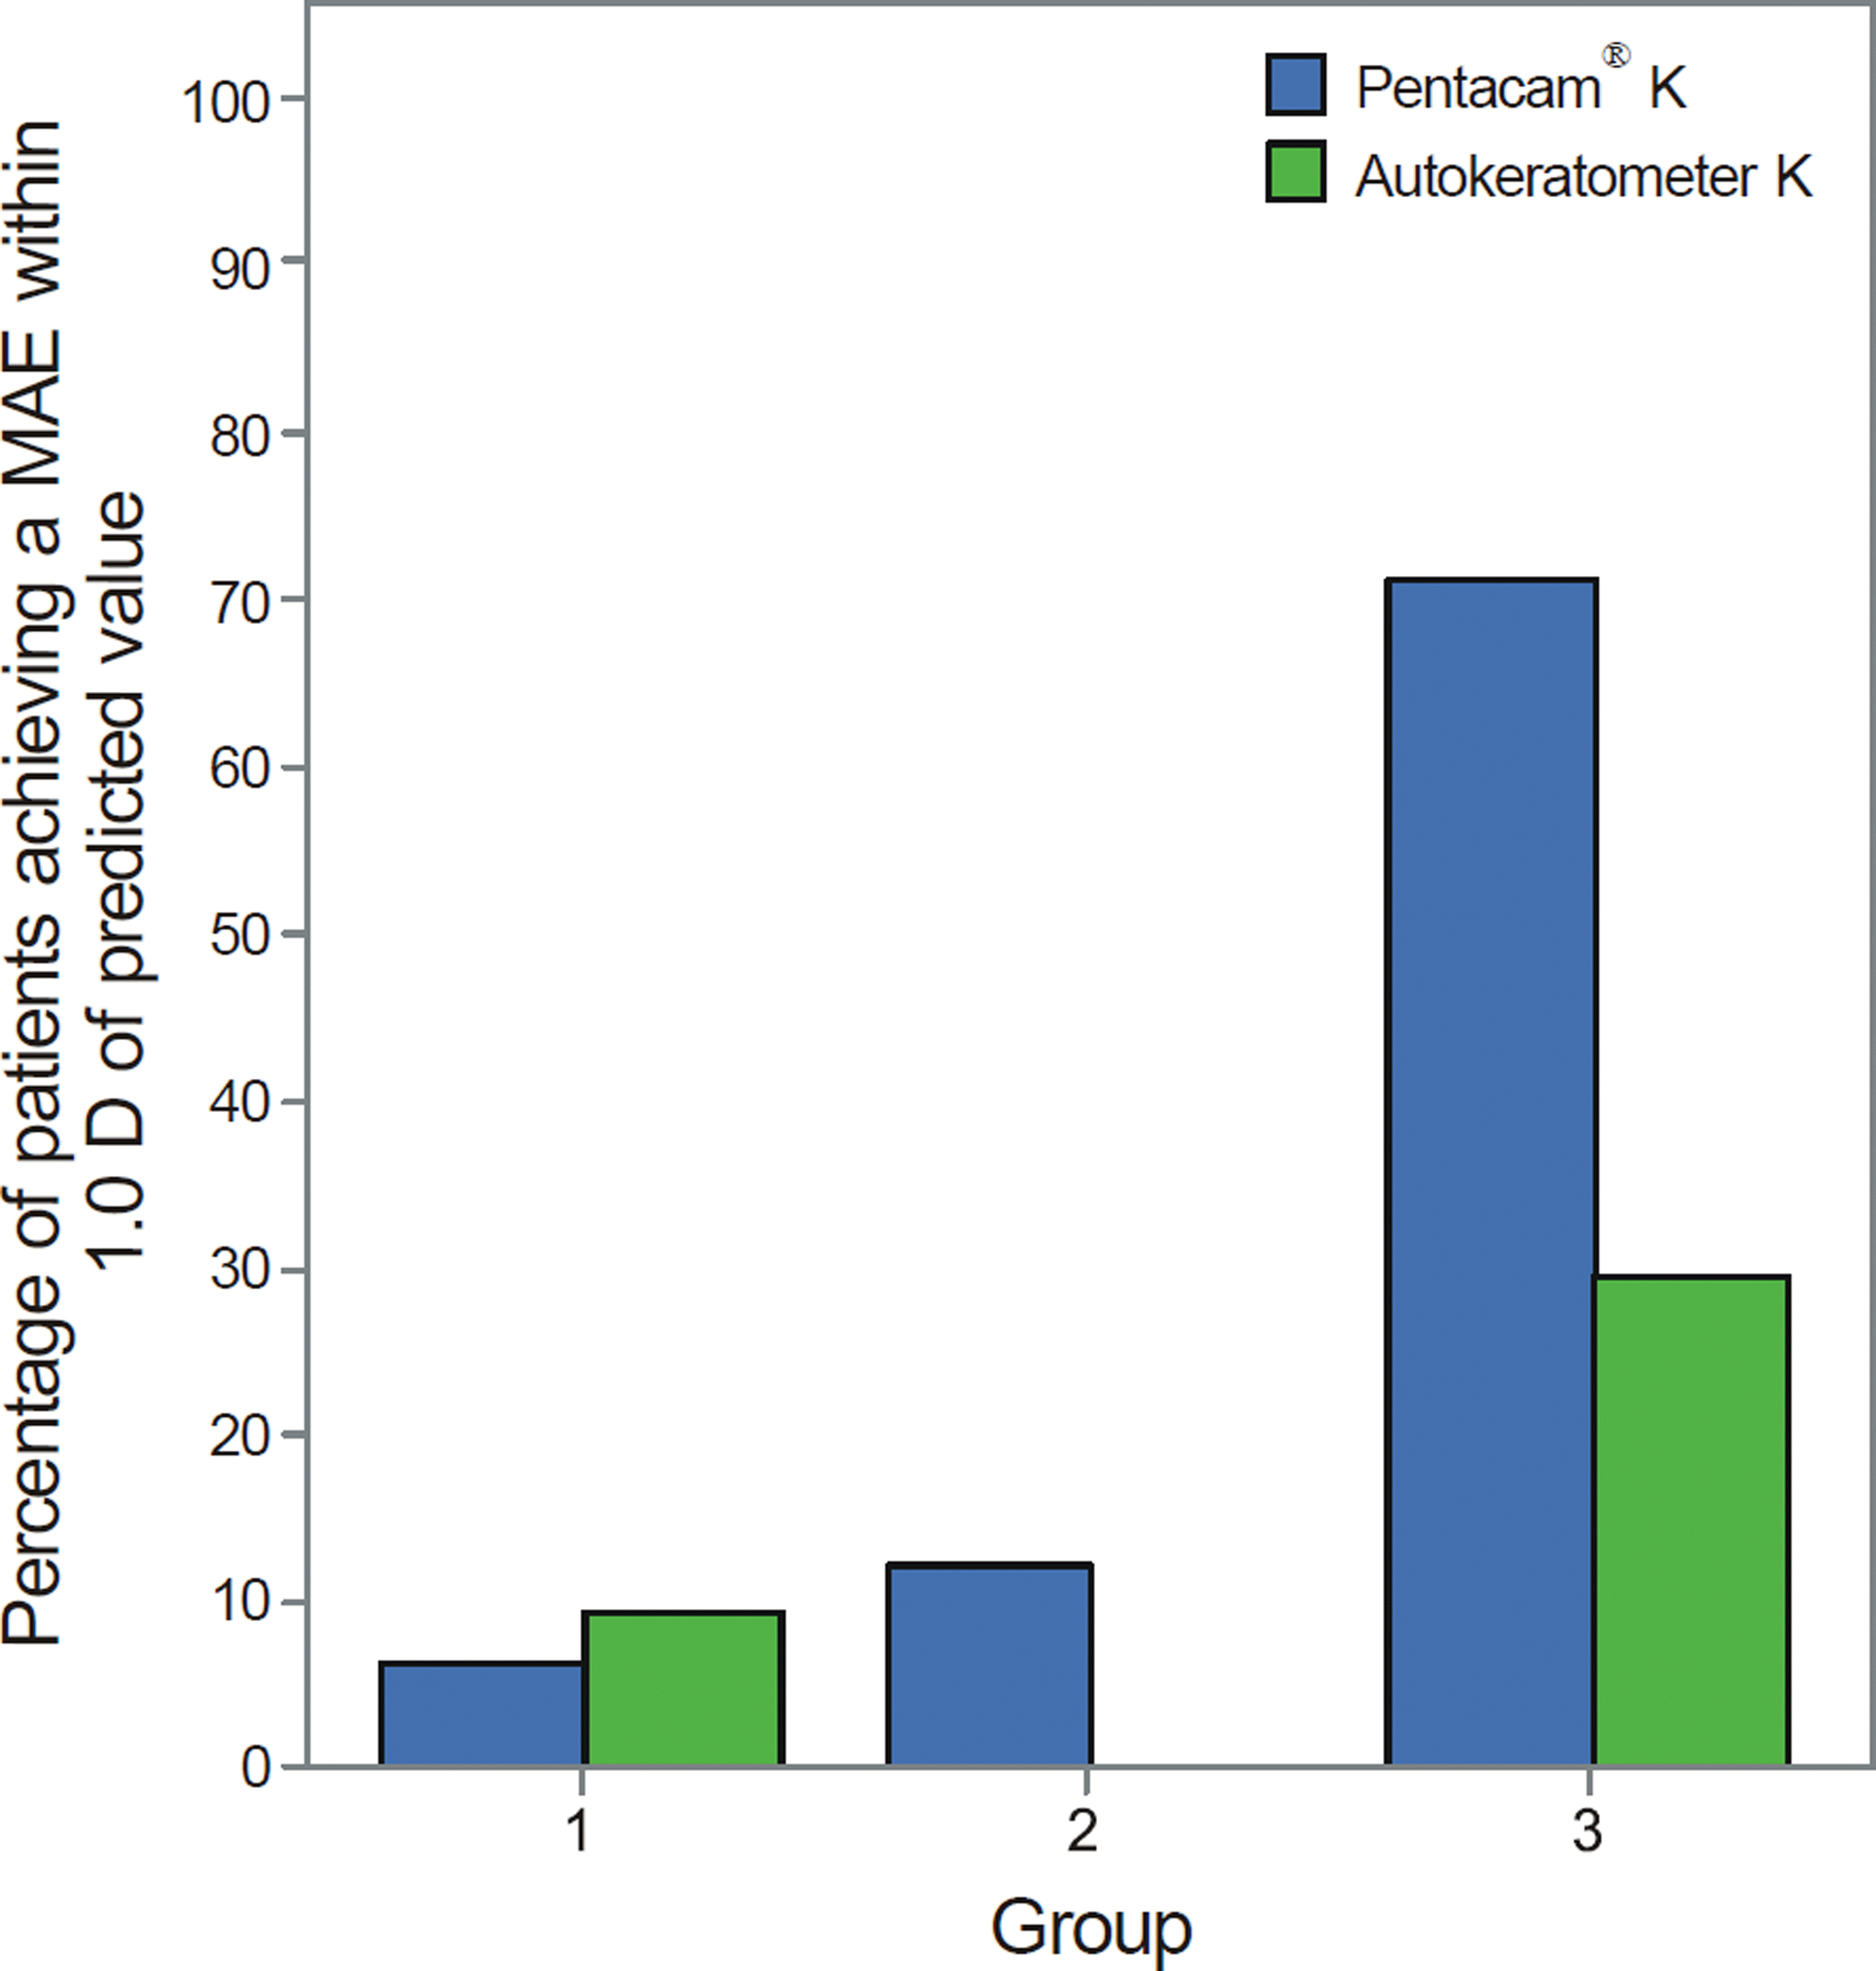
Figure 4.
Comparison of the percentage of patients achieving a mean absolute error (MAE) within 1.0 D of predicted value measured by autokeratometer and Pentacam®. Note that the majority of patients above the 1.0 D MAE values occurred among the group with Pentacam® photography equivalent K reading applied MAE of group 3. This was significantly high-er than any other groups as assessed by Kruskal-wallis test (p < 0.01). Group 1 = Absolute value of difference of keratometer between Pentacam® and autokeratometer, <0.50; Group 2 = Absolute value of difference of keratometer between Pentacam® and autokeratometer, 0.50 ≤ and <1.00; Group 3 = Absolute value of difference of keratometer between Pentacam® and au-tokeratometer, ≥ 1.00.

Table 1.
The baseline demographic characteristics and bio-metric values
Table 2.
Characteristics of each group according to the axial length
| Group A* | Group B† | Group C‡ | p-value | |
|---|---|---|---|---|
| (n = 31) | (n = 67) | (n = 12) | ||
| Axial length (mm) | 22.26 ± 0.24 | 23.17 ± 0.32 | 24.93 ± 0.97 | <0.01 |
| Anterior chamber depth (mm) | 3.03 ± 0.33 | 3.17 ± 0.42 | 3.71 ± 0.45 | <0.01 |
| Lens thickness (mm) | 4.23 ± 0.68 | 4.21 ± 0.74 | 4.06 ± 0.77 | 0.78 |
| Autokeratometer K applied MAE (D) | 0.55 ± 0.70 | 0.47 ± 0.39 | 0.36 ± 0.25 | 0.51 |
| Pentacam® K applied MAE (D) | 0.46 ± 0.47 | 0.51 ± 0.51 | 0.32 ± 0.26 | 0.45 |
Table 3.
Characteristics of each group according to the anterior chamber depth
| Group A* | Group B† | Group C‡ | p-value | |
|---|---|---|---|---|
| (n = 37) | (n = 50) | (n = 23) | ||
| Axial length (mm) | 22.72 ± 0.53 | 23.06 ± 0.63 | 22.82 ± 1.25 | <0.01 |
| Anterior chamber depth (mm) | 2.70 ± 0.18 | 3.27 ± 0.15 | 3.79 ± 0.22 | <0.01 |
| Lens thickness (mm) | 4.75 ± 0.55 | 4.10 ± 0.60 | 3.53 ± 0.53 | <0.01 |
| Autokeratometer K applied MAE (D) | 0.42 ± 0.30 | 0.48 ± 0.54 | 0.59 ± 0.61 | 0.45 |
| Pentacam® K applied MAE (D) | 0.42 ± 0.40 | 0.49 ± 0.51 | 0.55 ± 0.52 | 0.58 |
Table 4.
The Relationship between preoperative target diopters and postoperative refractive diopters at 2 months applied kera-tomeric values which measured by each device-Automated keratometer and Pentacam®
| Values | |
|---|---|
| Autokeratometer K applied MNE (D) | -0.12 ± 0.67 |
| Pentacam® K applied MNE (D) | -0.09 ± 0.66 |
| Autokeratometer K applied MAE (D) | 0.48 ± 0.49 |
| Pentacam® K applied MAE (D) | 0.48 ± 0.47 |
Table 5.
The biometry characteristics among 3 groups when divided by the difference of keratometer values between Pentacam® and autokeratometer
| Group 1* | Group 2† | Group 3‡ | p-value | |
|---|---|---|---|---|
| (n = 86) | (n = 17) | (n = 7) | ||
| Axial length (mm) | 23.06 ± 0.84 | 23.41 ± 1.01 | 22.89 ± 0.57 | 0.24 |
| Anterior chamber depth (mm) | 3.17 ± 0.44 | 3.24 ± 0.47 | 3.19 ± 0.44 | 0.85 |
| Lens thickness (mm) | 4.21 ± 0.67 | 4.09 ± 0.83 | 4.30 ± 1.08 | 0.77 |
| Autokeratometer mean K (D) | 44.80 ± 1.45 | 44.00 ± 1.91 | 44.74 ± 1.71 | 0.14 |
| Pentacam® mean K (D) | 44.81 ± 1.44 | 43.91 ± 1.56 | 45.37 ± 1.77 | 0.05 |
| Autokeratometer K applied MAE (D) | 0.44 ± 0.37 | 0.35 ± 0.23 | 1.32 ± 1.13 | <0.01 |
| Pentacam® K applied MAE (D) | 0.42 ± 0.39 | 0.44 ± 0.39 | 1.33 ± 0.81 | <0.01 |
Table 6.
Relationship between mean numeric error (MNE), mean absolute error (MAE), and difference of keratometeric values be-tween Pentacam® and autokeratometer
|
Difference of keratometric value between Pentacam® and autokeratometer* |
|||
|---|---|---|---|
| Pentacam® K† > Autokeratometer K‡ | Pentacam® K < Autokeratometer K | p-value | |
| (n = 55) | (n = 55) | ||
| MNE (D) | 0.45 ± 0.66 | 0.22 ± 0.73 | <0.01 |
| MAE (D) | 0.46 ± 0.47 | 0.50 ± 0.57 | 0.376 |
| MNE (D) | -0.24 ± 0.64 | -0.04 ± 0.60 | <0.01 |
| MAE (D) | 0.48 ± 0.49 | 0.44 ± 0.40 | 0.495 |


 PDF
PDF ePub
ePub Citation
 Print
Print


 XML Download