

 PDF
PDF ePub
ePub Citation
 Print
Print


Abstract
Purpose
To investigate the influence of the change in medial rectus resection amount caused by traction with muscle hooks on surgical results in exotropia.
Methods
In this prospective study 38 exotropia patients underwent unilateral lateral rectus recession-medial rectus resection (R & R). After isolation of the medial rectus muscle, the length of the muscle was measured with a muscle hook, and the portion to be resected was marked using gentian violet stain with calipers. After the medial rectus was retracted with two muscle hooks in either direction, its length was measured again with the calipers. Group 1 includes the patients with the planned resection amount changed to a more 0.5-1.0 mm when the rectus muscle was retracted, while group 2 did not change with the second muscle hook. The surgical results were compared between the 2 groups at postoperative 6 months.
Results
Mean resection amount was changed from 5.07 ± 0.76 mm to 5.36 ± 0.73 mm after pulling the second muscle hook. Sixteen patients (42.1%) were included in group 1 and 22 patients (57.9%) in group 2. There was no significant statistical difference in mean preoperative and postoperative deviated angle between the two groups. Success rates defined as the ocular alignment within ± 10 PD in the primary position at postoperative 6 months were 75.0% in group 1 and 86.3% in group 2, which is not stastistically different (p > 0.05).
Conclusions
Medial rectus resection amounts can be changed with the muscle traction with two muscle hooks, which induced the planned amount of resection less than first measured resection amount. However, there was little influence on surgical outcomes from the change occurred to a maximum 1 mm in resection measurement due to traction with two muscle hooks.
Figures and Tables
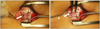 | Figure 1(A) Medial rectus muscle was retracted with Jameson muscle hook. The planned resection amount was marked with Gentian violet (white arrow). (B) This picture shows the discrepancy between the planned resection amount (caliper) and the elongated resection amount (white arrow) after retraction second Jameson muscle hook (white arrow head).
|
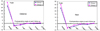 | Figure 2Change of mean postoperative deviated angles in two groups. Group 1: The increment of resection amount after pulling of 2nd m. hook ≥ 0.5 mm. Group 2: The increment of resection amount after pulling of 2nd m. hook < 0.5 mm. *p > 0.05 between group 1 and group 2, Mann-Whitney U-test; -: esotropia; +: exotropia.
|
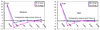 | Figure 3Comparison of two hospitals based on mean postoperative deviated angles. *p < 0.05, Mann-Whitney U-test; -: esotropia; +: exotropia.
|
Table 2
Statistical analysis of clinical factors between groups

Values are presented as number of patients or mean ± SD unless otherwise indicated.
Group 1: The increment of resection amount after pulling of 2nd muscle hook ≥ 0.5 mm.
Group 2: The increment of resection amount after pulling of 2nd muscle hook < 0.5 mm.
PD = prism diopter.
*Fisher's exact test; †Independent t-test; ‡Mann-Whitney U-test.
![]()
Table 3
Statistical analysis of clinical factors between hospitals

Values are presented as number of patients or mean ± SD unless otherwise indicated.
Group 1: The increment of resection amount after pulling of 2nd muscle hook ≥ 0.5 mm.
Group 2: The increment of resection amount after pulling of 2nd muscle hook < 0.5 mm.
PD = prism diopter.
*Pearson Chi-square test; †Independent sample t-test; ‡Mann-Whitney U-test.
![]()


References
1. Von Noorden Gunter K. Binocular Vision and Ocular Motility: Theory and Management of Strabismus. 2002. 6th ed. St. Louis: Mosby;588–590.
2. Krieger F, Cvintal T, Bicas H. Applied force and elongation in the medial rectus in esotropic patients with and without movement restriction. Strabismus. 2004. 12:247–255.
3. Simonsz HJ, Kolling GH, Kaufman H, van Dijk B. Intraoperative length and tension curves of human eye muscles: Including stiffness in passive horizontal eye movement in awake volunteers. Arch Ophthalmol. 1986. 104:1495–1500.
4. Simonsz HJ, Kolling GH, van Dijk B, Kaufmann H. Length-tension curves of human eye muscles during succinylcholine-induced contraction. Invest Ophthalmol Vis Sci. 1988. 29:1320–1330.
5. Simonsz HJ. Force-length recording of eye muscles during local-anesthesia surgery in 32 strabismus patients. Strabismus. 1994. 2:197–218.
6. Collins CC, Jampolsky A, Alden AB, et al. Length-tension recording system for strabismus surgery. IEEE Trans Biomed Eng. 1991. 38:230–237.
7. Jeon GS, Choi MY, Choi DG. The change of rectus muscle length caused by traction with muscle hooks in Strabismus surgery-the first report. J Korean Ophthalmol Soc. 2010. 51:401–405.
8. Von Noorden GK. Binocular Vision and Ocular Motility: Theory and Management of Strabismus. 2002. 6th ed. St. Louis: Mosby;101–107.
9. Pratt-Johnson JA, Tillson G. Management of Strabismus and Amblyopia: a Practical Guide. 1994. New York: Thieme;227.
10. Kushner BJ, Fisher MR, Lucchese NJ, Morton GV. Factors influencing response to strabismus surgery. Arch Ophthalmol. 1993. 111:75–79.
11. Scott AB, Mash AJ, Jampolsky A. Quantitative guidelines for exotropia surgery. Invest Ophthalmol. 1975. 14:428–436.
12. Gordon YJ, Bachar E. Multiple regression analysis predictor models in exotropia surgery. Am J Ophthalmol. 1980. 90:687–691.
13. Abbasoglu OE, Sener EC, Sanac AS. Factors influencing the successful outcome and response in strabismus surgery. Eye (Lond). 1996. 10:315–320.
14. Gezer A, Sezen F, Nasri N, Gözüm N. Factors influencing the outcome of strabismus surgery in patients with exotropia. J AAPOS. 2004. 8:56–60.
15. Helveston EM. Reoperations in strabismus. Ophthalmology. 1979. 86:1379–1388.
16. Scott WE, Martin-Casal A, Braverman DE. Curved ruler for measurement along the surface of the globe. Arch Ophthalmol. 1978. 96:1084.
17. Kushner BJ, Preslan MW, Vrabec M. Artifacts of measuring during strabismus surgery. J Pediatr Ophthalmol Strabismus. 1987. 24:159–164.
18. Kushner BJ, Morton GV. A randomized comparison of surgical procedures for infantile esotropia. Am J Ophthalmol. 1984. 98:50–61.
19. Kushner BJ. Multiple Mechanisms of extraocular muscle "overaction". Arch Ophthalmol. 2006. 124:680–688.
20. Christiansen SP, Harral RL 3rd, Brown H. Extraocular muscle fiber morphometry following combined recession-resection procedures in rabbits. J Pediatr Ophthalmol Strabismus. 1996. 33:247–250.
 XML Download