

 PDF
PDF ePub
ePub Citation
 Print
Print


Abstract
Purpose
Methods
Results
Conclusions
Figures and Tables
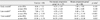
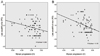 | Figure 1Correlation between late exodrift (EOMfinal - EOM6weeks) and myopic progression. (A) Late exodrift at far = 5.775 - 1.237 × Myopic progression (p=0.034, linear regression). (B) Late exodrift at near = 5.243 - 2.949 × Myopic progression (p = 0.001, linear regression). PD = prism diopters; D = diopters.
|
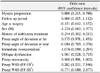
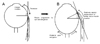 | Figure 2Schematic explanation of correlation between myopic progression and postoperative exodrift. As the progression of myopia is axial in nature, these results raise the possibility that ocular elongation may reduce the effect of recession.
|
Table 1
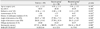
Values are presented as mean ± SD or number.
PD = prism diopters; D = diopters.
*Success group is defined as <10 PD exotropia at last follow-up; †Recurred group is defined as ≥10 PD exotropia at last follow-up; ‡Refractive error represents as spherical equivalent; §Fusion at far and near: suppression at far or near: suppression at far and near: diplopia; ΠChi-square test; #Independent t-test.
![]()
Table 2
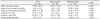
Values are presented as mean ± SD.
Exodrift is defined as difference in exodeviation from at final follow-up to at postoperative day 1.
PD = prism diopters; D = diopters.
*Success group is defined as <10 PD exotropia at final follow-up; †Recurred group is defined as ≥10 PD exotropia at final follow-up; ‡Independent t-test.
![]()
Table 3
Values are presented as mean ± SD.
PD = prism diopters.
*Non-myopic progression group is defined as a case of myopic progression less than -0.50 diopters; †Myopic progression group is defined as a case of myopic progression of -0.50 diopters or more; ‡Independent t-test; §Early exodrift is defined as difference in exodeviation from at postoperative 6 weeks to at postoperative day 1; ΠLate exodrift is defined as difference in exodeviation from at final follow-up to at postoperative 6 weeks; #Total exodrift is defined as difference in exodeviation from at final follow-up to at postoperative day 1.
![]()
 XML Download