

 PDF
PDF ePub
ePub Citation
 Print
Print


Abstract
Purpose
To study theeffect of micro incision (1.8 mm) and small incision (2.2 mm and 2.8 mm) coaxial phacoemulsification on surgically induced astigmatism (SIA) and high-order aberrations (HOA) of anterior and posterior corneal surface.
Methods
The present randomized clinical study included 32 eyes having a 1.8-mm, 38 eyes having a 2.2-mm, and 30 eyes having a 2.8-mm corneal incision. SIAs were measured at 1 and 3 months postoperatively. HOAs included coma, trefoil, and spherical aberration. The coma– root mean square (RMS) and trefoil-RMS were evaluated at 1 month after the cataract operation.
Results
Surgically induced astigmatisms were 0.41 ± 0.30 diopter (D) in the 1.8-mm incision group, 0.47 ± 0.21 D in 2.2-mm group and 0.71 ± 0.50 D in the 2.8-mm group. The SIA of the 1.8-mm group was smaller than the other groups (p = 0.002). There was no statistically significant difference in coma, spherical aberration of the corneal anterior surface and trefoil, or spherical aberration of the posterior surface among the 3 groups at 1 month after surgery.
Go to : 
References
1. Shepherd JR. Induced astigmatism in small incision cataract surgery. J Cataract Refract Surg. 1989; 15:85–8.

2. Steinert RF, Brint SF, White SM, Fine IH. Astigmatism after small incision cataract surgery. A prospective, randomized, multicenter comparison of 4- and 6.5-mm incisions. Ophthalmology. 1991; 98:417–23. discussion 423-4.
3. Soscia W, Howard JG, Olson RJ. Microphacoemulsification with WhiteStar. A wound-temperature study. J Cataract Refract Surg. 2002; 28:1044–6.
4. Donnenfeld ED, Olson RJ, Solomon R, et al. Efficacy and wound-temperature gradient of whitestar phacoemulsification through a 1.2 mm incision. J Cataract Refract Surg. 2003; 29:1097–100.
5. Dosso AA, Cottet L, Burgener ND, Di Nardo S. Outcomes of coaxial microincision cataract surgery versus conventional coaxial cataract surgery. J Cataract Refract Surg. 2008; 34:284–8.
6. Kurz S, Krummenauer F, Gabriel P, et al. Biaxial microincision versus coaxial small-incision clear cornea cataract surgery. Ophthalmology. 2006; 113:1818–26.
7. Elkady B, Alió JL, Ortiz D, Montalbán R. Corneal aberrations after microincision cataract surgery. J Cataract Refract Surg. 2008; 34:40–5.
8. Denoyer A, Denoyer L, Marotte D, et al. Intraindividual comparative study of corneal and ocular wavefront aberrations after biaxial microincision versus coaxial small-incision cataract surgery. Br J Ophthalmol. 2008; 92:1679–84.
9. Lee AG, Greenlee E, Oetting TA, et al. Assessing cataract surgical competency. Ophthalmology. 2007; 114:1415–6.
10. Osher RH. Microcoaxial phacoemulsification Part 2: clinical study. J Cataract Refract Surg. 2007; 33:408–12.
11. Osher RH, Injev VP. Microcoaxial phacoemulsification Part 1: lab-oratory studies. J Cataract Refract Surg. 2007; 33:401–7.
12. Tong N, He JC, Lu F, et al. Changes in corneal wavefront aberrations in microincision and small-incision cataract surgery. J Cataract Refract Surg. 2008; 34:2085–90.
13. Wang J, Tang X, Zhang S, Li LH. Changes in high order aberrations of anterior and posterior surfaces of cornea before and after phacoemulsification. Zhonghua Yan Ke Za Zhi. 2008; 44:1066–71.
14. Lee KM, Kwon HG, Joo CK. Microcoaxial cataract surgery outcomes: comparison of 1.8 mm system and 2.2 mm system. J Cataract Refract Surg. 2009; 35:874–80.
15. Lee SY, Chung JL, Hong JP, et al. Comparative study of two aspheric, aberration-free intraocular lenses in cataract surgery. J Korean Ophthalmol Soc. 2009; 50:1520–6.
16. Hwang SJ, Choi SK, Oh SH, et al. Surgically induced astigmatism and corneal higher order aberrations in microcoaxial and conventional cataract surgery. J Korean Ophthalmol Soc. 2008; 49:1597–602.
17. Holladay JT, Moran JR, Kezirian GM. Analysis of aggregate surgically induced refractive change, prediction error, and intraocular astigmatism. J Cataract Refract Surg. 2001; 27:61–79.
18. Alió J, Rodríguez-Prats JL, Galal A, Ramzy M. Outcomes of microincision cataract surgery versus coaxial phacoemulsification. Ophthalmology. 2005; 112:1997–2003.
19. Linebarger EJ, Hardten DR, Shah GK, Lindstrom RL. Phacoemulsification and modern cataract surgery. Surv Ophthalmol. 1999; 44:123–47.
20. Dick HB, Schwenn O, Krummenauer F, et al. Inflammation after sclerocorneal versus clear corneal tunnel phacoemulsification. Ophthalmology. 2000; 107:241–7.
21. Lundström M. Endophthalmitis and incision construction. Curr Opin Ophthalmol. 2006; 17:68–71.
22. Weikert MP. Update on bimanual microincisional cataract surgery. Curr Opin Ophthalmol. 2006; 17:62–7.
23. Dam-Johansen M, Olsen T. Induced astigmatism after 4 and 6 mm scleral tunnel incision. A randomized study. Acta Ophthalmol Scand. 1997; 75:669–74.
24. Mendívil A. Frequency of induced astigmatism following phacoemulsification with suturing versus without suturing. Ophthalmic Surg Lasers. 1997; 28:377–81.
25. Lyhne N, Krogsager J, Corydon L, Kjeldgaard M. One year fol-low-up of astigmatism after 4.0 mm temporal clear corneal and superior scleral incisions. J Cataract Refract Surg. 2000; 26:83–7.
26. Artal P, Guirao A, Berrio E, Williams DR. Compensation of corneal aberrations by the internal optics in the human eye. J Vis. 2001; 1:1–8.
27. Artal P, Guirao A. Contributions of the cornea and the lens to the aberrations of the human eye. Opt Lett. 1998; 23:1713–5.
28. Mester U, Dillinger P, Anterist N. Impact of a modified optic design on visual function: clinical comparative study. J Cataract Refract Surg. 2003; 29:652–60.
29. Guirao A, Redondo M, Geraghty E, et al. Corneal optical aberrations and retinal image quality in patients in whom monofocal intraocular lenses were implanted. Arch Ophthalmol. 2002; 120:1143–51.
30. Castejón-Mochón JF, López-Gil N, Benito A, Artal P. Ocular wavefront aberration statistics in a normal young population. Vision Res. 2002; 42:1611–7.
31. Yao K, Tang X, Ye P. Corneal astigmatism, high order aberrations, and optical quality after cataract surgery: microincision versus small incision. J Refract Surg. 2006; 22:S1079–82.
32. Guirao A, Tejedor J, Artal P. Corneal aberrations before and after small-incision cataract surgery. Invest Ophthalmol Vis Sci. 2004; 45:4312–9.
33. Marcos S, Rosales P, Llorente L, Jiménez-Alfaro I. Change in corneal aberrations after cataract surgery with 2 types of aspherical intraocular lenses. J Cataract Refract Surg. 2007; 33:217–26.
34. Yao K, Tang XJ, Huang XD, Ye PP. Clinical evaluation on the bimanual microincision cataract surgery. Zhonghua Yan Ke Za Zhi. 2008; 44:525–8.
Go to :
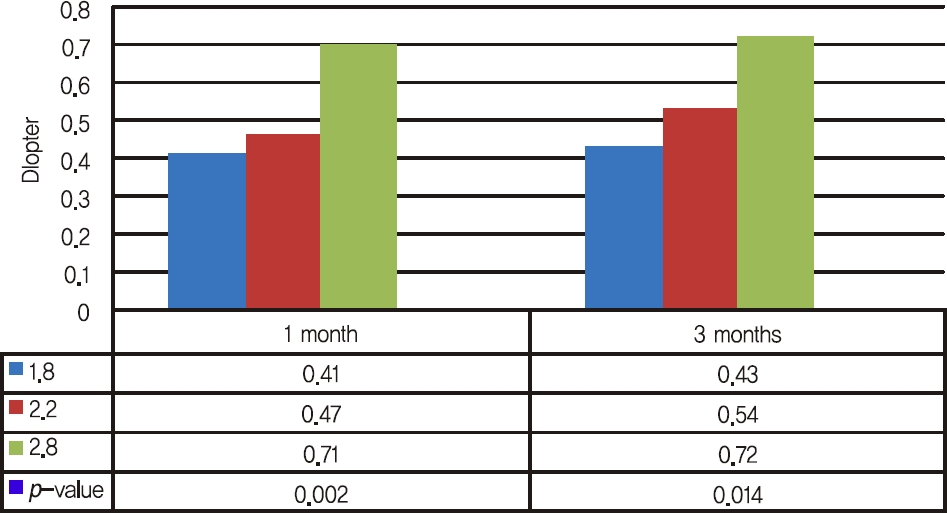 | Figure 1.Inter-group comparison of surgically induced astigmatism (SIA) at 1 and 3 months after cataract surgery. SIA is statistically different among 1.8-mm, 2.2-mm and 2.8-mm incision group at 1 and 3 months respectively. |
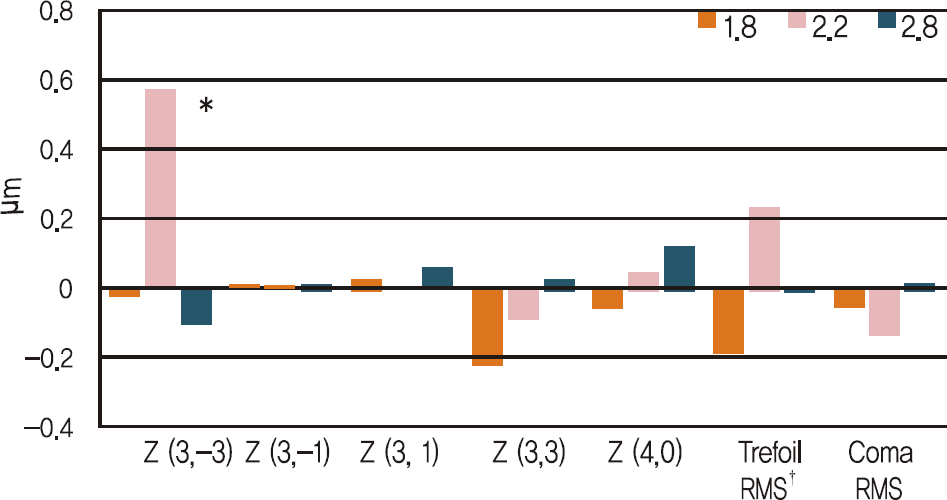 | Figure 2.Mean changes (μ m) in high order aberrations and root mean square of anterior corneal surface betweenbaseline and 1 month after operation. Only Z (3, -3) is different in statistical comparison among 3 groups. *p<0.05; † root mean square. |
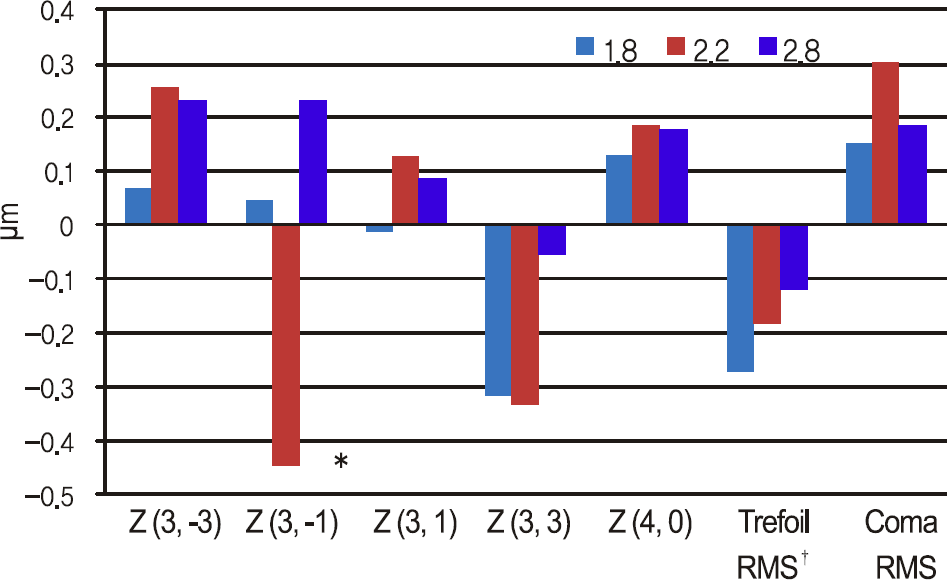 | Figure 3.Mean changes (μ m) in high order aberrations and root mean square of posterior corneal surface betweenbaseline and 1 month after operation. Only Z (3, -1) is different in statistical comparison among 3 groups. *p<0.05; † root mean square. |
Table 1.
Demographics of patients and surgical results after cataract surgery
| Dermographics of patients | ||||
|---|---|---|---|---|
| Baseline variables | 1.8 mm | 2.2 mm | 2.8 mm | p-value |
| No. eyes | 32 | 38 | 30 | |
| Age (mean±SD, yr) | 64.5 ± 10.5 | 61.8 ± 15.3 | 69.4 ± 10.0 | 0.045* |
| UCVA† (mean±SD, logMAR) | 0.71 ± 0.36 | 0.70 ± 0.33 | 0.53 ± 0.21 | 0.053 |
| BCVA‡ (mean±SD, logMAR) | 0.40 ± 0.33 | 0.45 ± 0.37 | 0.41 ± 0.21 | 0.836 |
| SE§ (mean±SD, diopter) | -1.71 ± 5.98 | 0.31 ± 1.85 | 0.02 ± 2.09 | 0.119 |
| Endothelial cell density (mean±SD, cell/mm2) | 2850 ± 419 | 2618 ± 433 | 2724 ± 345 | 0.063 |
|
Surgical results after cataract surgery |
|
|
|
|
| UCVA (mean±SD, logMAR) | 0.34 ± 0.32 | 0.26 ± 0.30 | 0.15 ± 0.20 | 0.029* |
| BCVA (mean±SD, logMAR) | 0.05 ± 0.09 | 0.05 ± 0.90 | 0.06 ± 0.10 | 0.881 |
| SE (mean±SD, diopter) | -1.05 ± 1.05 | -0.45 ± 0.78 | -0.32 ± 0.51 | 0.000* |
| Endothelial cell density (mean±SD, cell/mm2) | 2516 ± 466 | 2303 ± 381 | 2339 ± 329 | 0.221 |
Table 2.
Summary of data of keratometric astigmatisms and corneal meridian
| Astigmatism | 1.8 mm | 2.2 mm | 2.8 mm | p-value | |
|---|---|---|---|---|---|
| Preop | Astigmatism* (mean±SD, diopter) | 0.72 ± 0.38 | 0.70 ± 0.38 | 0.76 ± 0.53 | 0.846 |
| Steep axis | 87 ± 52 | 106 ± 51 | 90 ± 43 | 0.236 | |
| 1 month | Astigmatism* (mean±SD, diopter) | 0.78 ± 0.53 | 0.59 ± 0.44 | 0.90 ± 0.55 | 0.520 |
| Steep axis | 99 ± 49 | 108 ± 37 | 91 ± 40 | 0.249 | |
| 3 months | Astigmatism* (mean±SD, diopter) | 0.76 ± 0.50 | 0.71 ± 0.48 | 0.97 ± 0.61 | 0.122† |
| Steep axis | 90 ± 45 | 109 ± 37 | 111 ± 26 | 0.045† |
Table 3.
Comparison of high-order aberrations and root mean square of anterior corneal surface between preoperation and 1 month of cataract surgery within group respectively
| Groups |
1.8 mmm (mean±SD) |
2.2 mm (mean±SD) |
2.8 mm (mean±SD) |
||||||
|---|---|---|---|---|---|---|---|---|---|
| Zernike terms | preop | postop | p-value | preop | postop | p-value | preop | postop | p-value |
| Z (3, -3) trefoil | 0.032±0.314 | 0.037±0.219 | 0.852 | -0.079±0.425 | 0.540±0.860 | 0.026‡ | 0.574±0.318 | -0.043±0.259 | 0.165 |
| Z (3, -1) coma | -0.207±0.296 | -0.163±0.222 | 0.795 | -0.178±0.247 | -0.213±0.171 | 0.653 | -0.107±0.245 | 0.070±0.294 | 0.828 |
| Z (3, 1) coma | 0.039 ± 0.349 | -0.029±0.261 | 0.999 | -0.176±0.394 | 0.131±0.338 | 0.819 | -0.009±0.333 | 0.070±0.294 | 0.217 |
| Z (3, 3) trefoil | 0.167 ± 0.365 | -0.009±0.078 | 0.091 | 0.078±0.416 | 0.015±0.311 | 0.598 | 0.044±0.220 | 0.067±0.315 | 0.814 |
| Z (4, 0) SA* | 0.704±0.204 | 0.667±0.247 | 0.113 | 0.654±0.212 | 0.652±0.167 | 0.978 | 0.689±0.294 | 0.818±0.264 | 0.098 |
| Trefoil RMS† | 0.344±0.373 | 0.412±0.280 | 0.200 | 0.369±0.474 | 0.511±0.779 | 0.336 | 0.296±0.251 | 0.288±0.293 | 0.910 |
| Coma RMS† | 0.412±0.280 | 0.316±0.210 | 0.479 | 0.457±0.253 | 0.318±0.238 | 0.113 | 0.362±0.217 | 0.349±0.265 | 0.782 |
Table 4.
Comparison of high-order aberrations and root mean square of posterior corneal surface between baseline and 1 month after phacoemulsification
| Groups |
1.8 mm (mean±SD) |
2.2 mm (mean±SD) |
2.8 mm (mean±SD) |
||||||
|---|---|---|---|---|---|---|---|---|---|
| Zernike terms | preop | postop | p-value | preop | postop | p-value | preop | postop | p-value |
| Z (3, -3) trefoil | 0.013±0.448 | 0.133±0.550 | 0.677 | 0.408±0.832 | 0.592±0.741 | 0.457 | 0.160±0.768 | 0.257±0.687 | 0.523 |
| Z (3, -1) coma | -0.166±0.636 | -0.128±1.074 | 0.796 | -0.109±0.535 | -0.558±0.762 | 0.016‡ | -0.056±0.099 | 0.226±1.108 | 0.033‡ |
| Z (3, 1) coma | -0.449±0.623 | -0.460±0.621 | 0.884 | -0.287±0.547 | -0.155±0.802 | 0.513 | -0.457±0.621 | -0.353±0.570 | 0.397 |
| Z (3, 3) trefoil | 0.510±0.895 | 0.261±0.360 | 0.321 | 0.597±0.908 | 0.307±0.405 | 0.234 | 0.254±0.071 | 0.270±0.520 | 0.920 |
| Z (4, 0) SA* | 0.950±0.389 | 1.051±0.345 | 0.076 | 0.796±0.485 | 0.983±0.423 | 0.137 | 0.794±0.497 | 0.971±0.409 | 0.026‡ |
| Trefoil RMS† | 0.790±0.772 | 0.514±0.418 | 0.308 | 0.919±1.039 | 0.736±0.357 | 0.598 | 0.824±0.964 | 0.705±0.608 | 0.491 |
| Coma RMS† | 0.861±0.491 | 1.01±0.578 | 0.364 | 0.737±0.321 | 0.912±0.596 | 0.710 | 0.160±0.768 | 0.257±0.687 | 0.523 |
 XML Download