Abstract
Purpose
To present a case of acute zonal occult outer retinopathy (AZOOR) with acute idiopathic blind spot enlargement (AIBSE) investigated using indocyanine green angiography (ICGA), multifocal electroretinography (multifocal ERG) and spectral domain-OCT (SD-OCT).
Case summary
A healthy 31-year-old female with photopsia and a five-day visual field defect in her left eye showed no abnormal findings in ocular examinations such as slit lamp and fundus examination, fluorescein angiography (FAG), or full field ERG as well as in the systemic neurologic examination. In the late phase of ICGA, there were multiple hypofluorescent spots around the optic disc and scattered through the posterior pole. The patient showed an amplitude decrease of multifocal ERG and the destruction of the boundary between the inner and outer segments of the photoreceptors in the SD-OCT examined in the retinal area corresponding to the visual field defect. The patient was diagnosed with AZOOR and was followed-up without treatment. After three months, no abnormal SD-OCT or visual field test findings were observed and no symptoms remained; however, a slightly depressed response on multifocal ERG was present.
Go to : 
References
1. Fletcher WA, Imes RK, Goodman D, Hoyt WF. Acute idiopathic blind spot enlargement. A big blind spot syndrome without optic disc edema. Arch Ophthalmol. 1988; 106:44–9.
2. Hamed LM, Glaser JS, Gass JD, Schatz NJ. Protracted enlargement of the blind spot in multiple evanescent white dot syndrome. Arch Ophthalmol. 1989; 107:194–8.

3. Jampol LM, Wiredu A. MEWDS, MFC, PIC, AMN, AIBSE, and AZOOR: one disease or many? Retina. 1995; 15:373–8.
4. Gass JD. Overlap among acute idiopathic blind spot enlargement syndrome and other conditions. Arch Ophthalmol. 2001; 119:1729–31.

5. Hamed LA, Schatz NJ, Glaser JS, Gass JD. Acute idiopathic blind spot enlargement without optic disc edema. Arch Ophthalmol. 1988; 106:1030–1.

7. Gass JD. Acute zonal occult outer retinopathy. Donders Lecture: The Netherlands Ophthalmological Society, Maastricht, Holland, June 19, 1992. J Clin Neuroophthalmol. 1993; 13:79–97.
8. Gass JD, Agarwal A, Scott IU. Acute zonal occult outer retinopathy: a long-term followup study. Am J Ophthalmol. 2002; 134:329–39.

9. Choi HJ, Hwang JM. A Case report of acute zonal occult outer retinopathy. J Korean Ophthalmol Soc. 2003; 44:1384–91.
10. Yasuda K, Shimura M, Noro M, et al. Clinical course of acute retinal zonal occult outer retinopathy in visual field and multifocal electroretinogram. Br J Ophthalmol. 1999; 83:1089–90.
11. Kondo N, Kondo M, Miyake Y. Acute idiopathic blind spot enlargement syndrome: prolonged retinal dysfunction revealed by multifocal electroretinogram technique. Am J Ophthalmol. 2001; 132:126–8.

Go to : 
 | Figure 1.(A) Fundus photography show normal finding except for temporal myopic crescent in both eyes. (B) FAG show normal finding except for the late staining of the optic disc in both eyes. (C) In the late phase, ICGA show multiple, small hypofluorescent spots scattered along the superior and inferior major vessels, around the optic disc, and (D) outside posterior pole in the left eye, and no hy-pofluorescence in the right eye. (E) After 3 months, multiple hypofluorescent spots disappeared almost completely except for the small area of the temporal peripapillary area. |
 | Figure 2.The right visual fields of the Goldmann perimetry were normal in (A, B, C). (A) The left visual field show the enlarged blind spot (EBS) with superior visual field loss. (B) After 3 weeks, the depth of field defect decreased, and (C) after 3 months, EBS disappeared. |
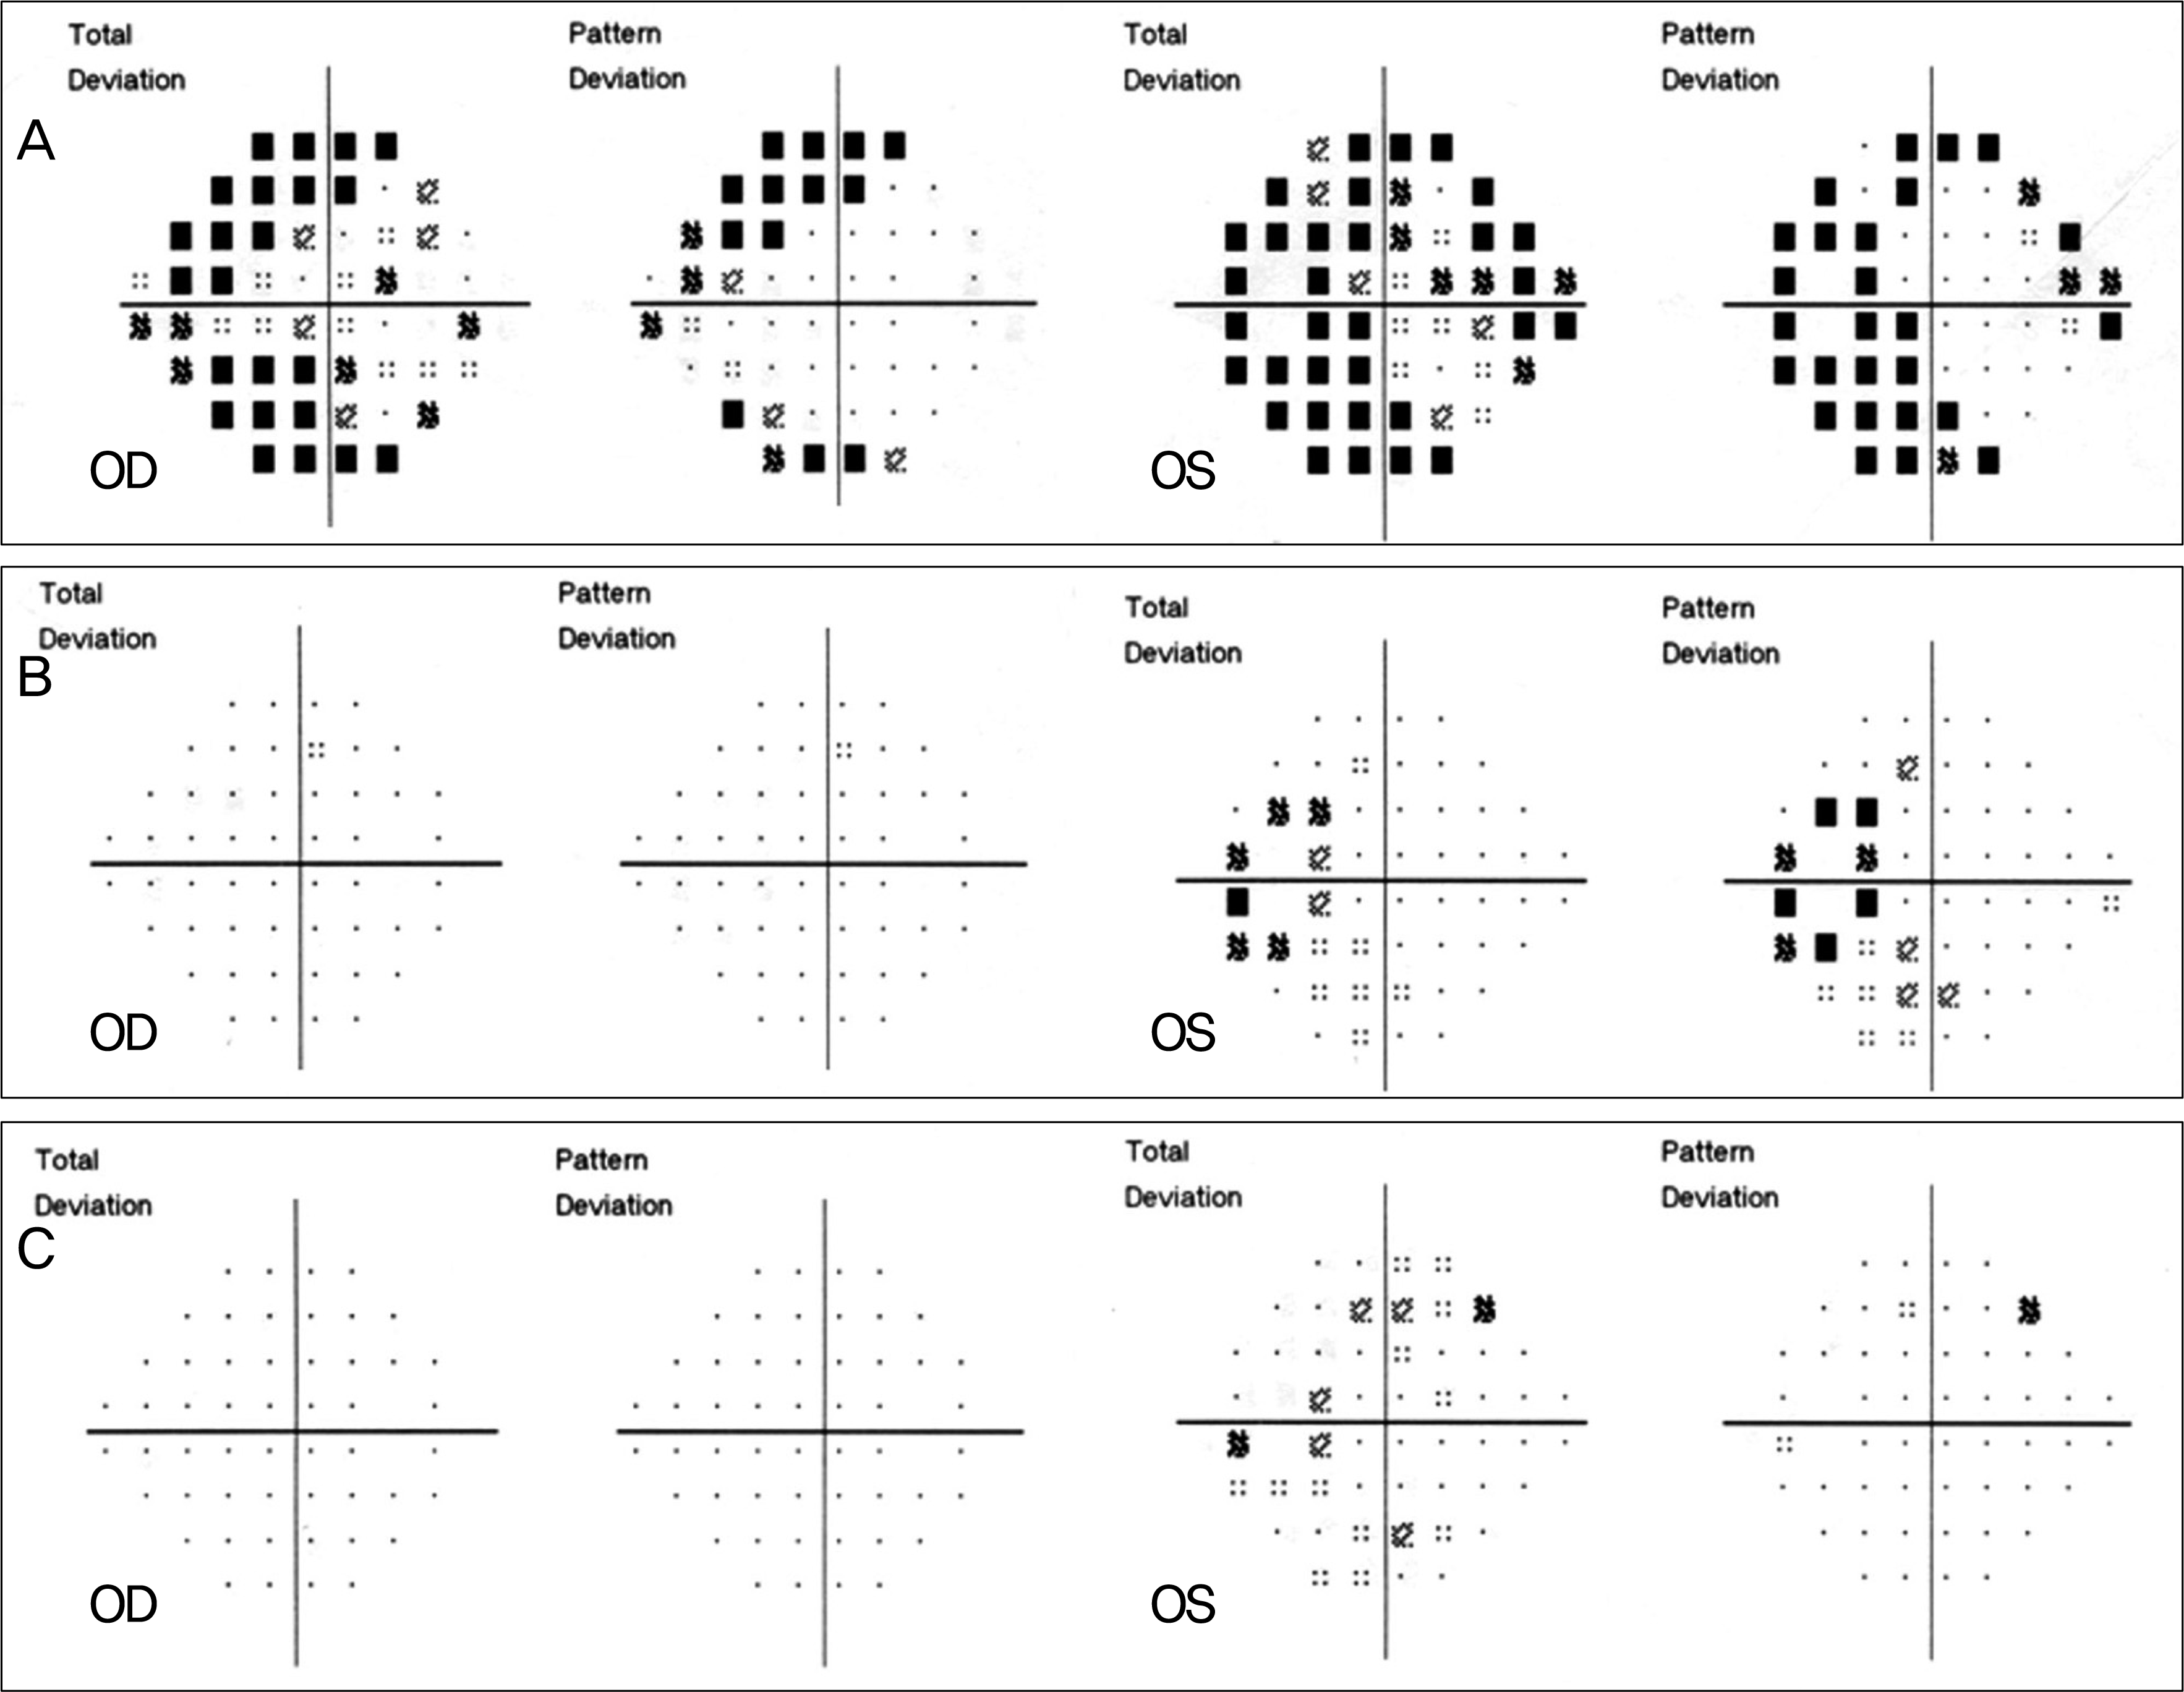
 | Figure 3.(A) The right visual field of the Humphrey automated perimetry show superior and inferior field defect and the left field showed the enlarged blind spot (EBS), superior and inferior field defect. (B) After 3 weeks, the right field defect disappeared and the left field defect decreased. (C) After 3 months, the left field defect disappeared almost completely except for the one blind spot in the marginal field. |
 | Figure 4.(A, B) Both 2D map and trace arrays of multifocal electroretinogram show the depression responses of retinal areas corresponding to the field defect of Humphrey automated perimetry in both eyes. (White circle: the retinal area corresponding to enlarged blind spot (EBS)) (C, D) The depression response of the retinal area corresponding to EBS (white circle) prominently recovered, but the depression response in the marginal area of 2D map partly remains. |
 | Figure 5.(A) SD-OCT show normal finding in the right eye (white arrow in Figure A: intact IS/OS boundary). (B) SD-OCT show distortions of IS/OS boundary in the left eye. The red arrow of Figure B-1 indicates abnormal IS/OS boundary in the nasal retina to the foveal center and the white arrow of Figure B-1 indicates intact IS/OS boundary of temporal retina to the foveal center. (C) After 3 months, distortions of IS/OS boundary recovered (yellow arrow in Figure C: recovered IS/OS boundary). |


 PDF
PDF ePub
ePub Citation
 Print
Print


 XML Download