Abstract
Purpose
To investigate the risk factors related to the location of visual field defects in normal tension glaucoma.
Methods
Eighty-one eyes diagnosed as normal tension glaucoma in patients with early glaucomatous visual field defects were divided into central visual field defects and peripheral visual field defects. The difference between the 2 groups based on the intra-individual comparison were assessed with several ocular risk factors such as sex, age, hypertension, diabetes mellitus, smoking, laterality, intraocular pressure, central corneal thickness, cup-disc ratio, peripapillary atrophy, mean deviation, pattern standard deviation, best corrected visual acuity, and refractive errors.
Results
The incidence of hypertension in the central visual field defects group (60.6%) was higher than in the peripheral visual field defects group (22.9%, p = 0.001). The central corneal thickness in the central group (533.1 ± 18.2 μ m) was thin-ner than in the peripheral group (545.0 ± 30.0 μ m, p = 0.003). Hypertension was the only risk factors for central visual field defects (p = 0.001). In both the central group and peripheral group, upper visual field defects were more common than lower defects.
Go to : 
References
1. Shields MB. Normal-tension glaucoma: is it different from primary openangle glaucoma? Curr Opin Ophthalmol. 2008; 19:85–8.

2. Crichton A, Drance SM, Douglas GR, Schulzer M. Unequal intraocular pressure and its relation to asymmetric visual field defects in low-tension glaucoma. Ophthalmology. 1989; 96:1312–4.

3. Araie M, Sekine M, Suzuki Y, Koseki N. Factors contributing to the progression of visual field damage in eyes with normal-tension glaucoma. Ophthalmology. 1994; 101:1440–4.

4. Meyer JH, Brandi-Dohrn J, Funk J. Twenty four hour blood pressure monitoring in normal tension glaucoma. Br J Ophthalmol. 1996; 80:864–7.

5. Daugeliene L, Yamamoto T, Kitazawa Y. Risk factors for visual field damage progression in normal-tension glaucoma eyes. Graefes Arch Clin Exp Ophthalmol. 1999; 237:105–8.

6. Drance S, Anderson DR, Schulzer M. Risk factors for progression of visual field abnormalities in normal-tension glaucoma. Am J Ophthalmol. 2001; 131:699–708.

7. Nakagami T, Yamazaki Y, Hayamizu F. Prognostic factors for progression of visual field damage in patients with normal-tension glaucoma. Jpn J Ophthalmol. 2006; 50:38–43.

8. Kiriyama N, Ando A, Fukui C, et al. A comparison of optic disc topographic parameters in patients with primary open angle glaucoma, normal tension glaucoma and ocular hypertension. Graefes Arch Clin Exp Ophthalmol. 2003; 241:541–5.

9. Caprioli J, Spaeth GL. Comparison of the optic nerve head in high- and low-tension glaucoma. Arch Ophthalmol. 1985; 103:1145–9.

10. Javitt JC, Spaeth GL, Katz LJ, et al. Acquired pits of the optic nerve. Increased prevalence in patients with low-tension glaucoma. Ophthalmology. 1990; 97:1038–43.
11. Eid TE, Spaeth GL, Moster MR, Augsburger JJ. Quantitative differences between the optic nerve head and peripapillary retina in low-tension and high-tension primary openangle glaucoma. Am J Ophthalmol. 1997; 124:805–13.

12. Yamazaki Y, Koide C, Miyazawa T, et al. Comparison of retinal nerve-fiber layer in high- and normal-tension glaucoma. Graefes Arch Clin Exp Ophthalmol. 1991; 229:517–20.

13. Caprioli J, Spaeth GL. Comparison of visual field defects in the low-tension glaucomas with those in the high-tension glaucomas. Am J Ophthalmol. 1984; 97:730–7.

14. Koseki N, Araie M, Suzuki Y, Yamagami J. Visual field damage proximal to fixation in normal- and high-tension glaucoma eyes. Jpn J Ophthalmol. 1995; 39:274–83.
15. Araie M, Yamagami J, Suziki Y. Visual field defects in normal-tension and high-tension glaucoma. Ophthalmology. 1993; 100:1808–14.

16. Ahrlich KG, De Moraes CG, Teng CC, et al. Visual field progression fifferences between normal-tension and exfoliative hgh-tension glaucoma. Invest Ophthalmol Vis Sci. 2010; 51:1458–63.
17. Becker B. Diabetes mellitus and primary openangle glaucoma. The XXVII Edward Jackson Memorial Lecture. Am J Ophthalmol. 1971; 71:1–16.
18. Mcleod SD, West SK, Quigley HA, Fozard JL. A longitudinal study of the relationship between intraocular and blood pressures. Invest Ophthalmol Vis Sci. 1990; 31:2361–6.
19. Mitchell P, Lee AJ, Rochtchina E, Wang JJ. Openangle glaucoma and systemic hypertension: the blue mountains eye study. J Glaucoma. 2004; 13:319–26.
20. Pradalier A, Hamard P, Sellem E, Bringer L. Migraine and glaucoma: an epidemiologic survey of French ophthalmologists. Cephalalgia. 1998; 18:74–6.

22. Deokule S, Weinreb RN. Relationships among systemic blood pressure, intraocular pressure, and openangle glaucoma. Can J Ophthalmol. 2008; 43:302–7.

23. Leske MC, Wu SY, Hennis A, et al. BESs Study Group. Risk factors for incident openangle glaucoma: the Barbados Eye Studies. Ophthalmology. 2008; 115:85–93.
24. Sponsel WE, Zetlan SR, Stodtmeister R, Kaufman PL. Retinal ca-pillary hemodynamics and VEP/pressure tolerance: evidence of retinal microcirculatory compromise in treated glaucomatous eyes. Ophthalmologica. 1997; 211:172–7.

25. Gherghel D, Orgul S, Gugleta K, et al. Relationship between ocular perfusion pressure and retrobulbar blood flow in patients with glaucoma with progressive damage. Am J Ophthalmol. 2000; 130:597–605.

26. Lin W, Aoyama Y, Kawase K, Yamamoto T. Relationship between central corneal thickness and visual field defect in openangle glaucoma. Jpn J Ophthalmol. 2009; 53:477–81.

27. Shah H, Kniestedt C, Bostrom A, et al. Role of central corneal thickness on baseline parameters and progression of visual fields in open angle glaucoma. Eur J Ophthalmol. 2007; 17:545–9.

28. Ritch R, Shields MB, Krupin T. The Glaucomas. 2nd ed. St. Louis: The CV Mosby Co.;1996. p. 769.
29. Kim YN, Kang JH, Kim JS, Lee JH. Correlation between retinal nerve fiber layer thickness and visual field in normal tension glaucoma. J Korean Ophthalmol Soc. 2005; 46:1532–9.
30. Woo SW, Choi HW, Kim JS, Lee JH. Correlation between retinal nerve fiber layer thickness and visual field in normal tension glaucoma patients. J Korean Ophthalmol Soc. 2006; 47:1613–22.
Go to : 
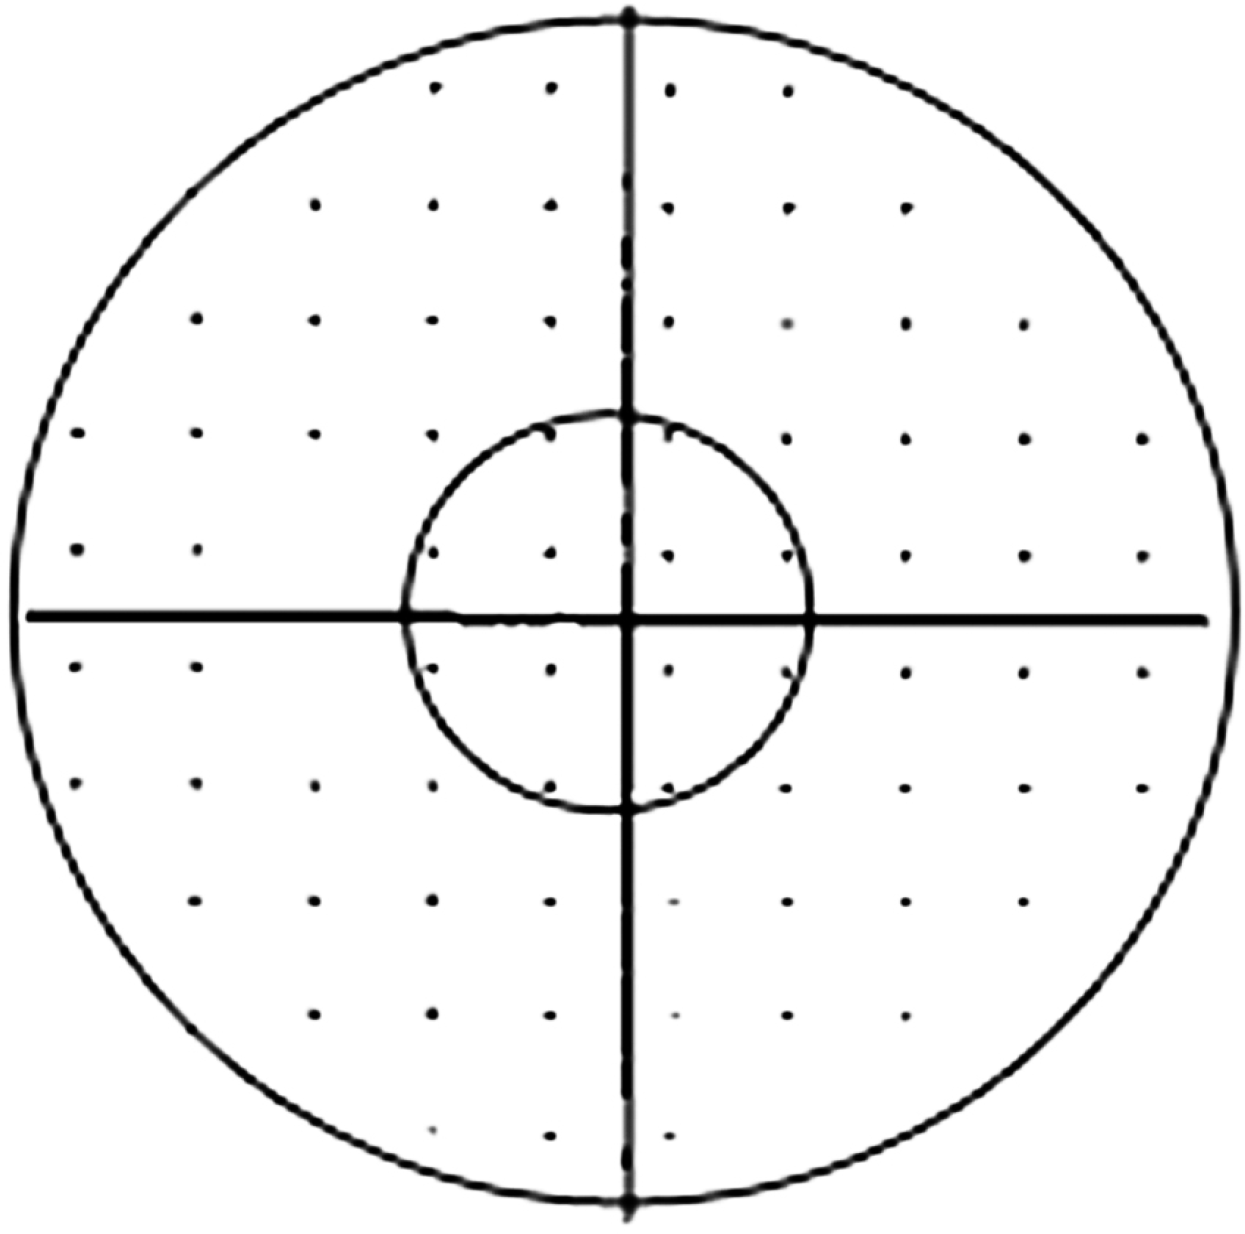
 | Figure 1.Visual field probability plot (pattern deviation) divided into 4 subfields: a central 10 degree (radius) and outer arcu-ate subfields in both superior and inferior hemifields (left eye). |
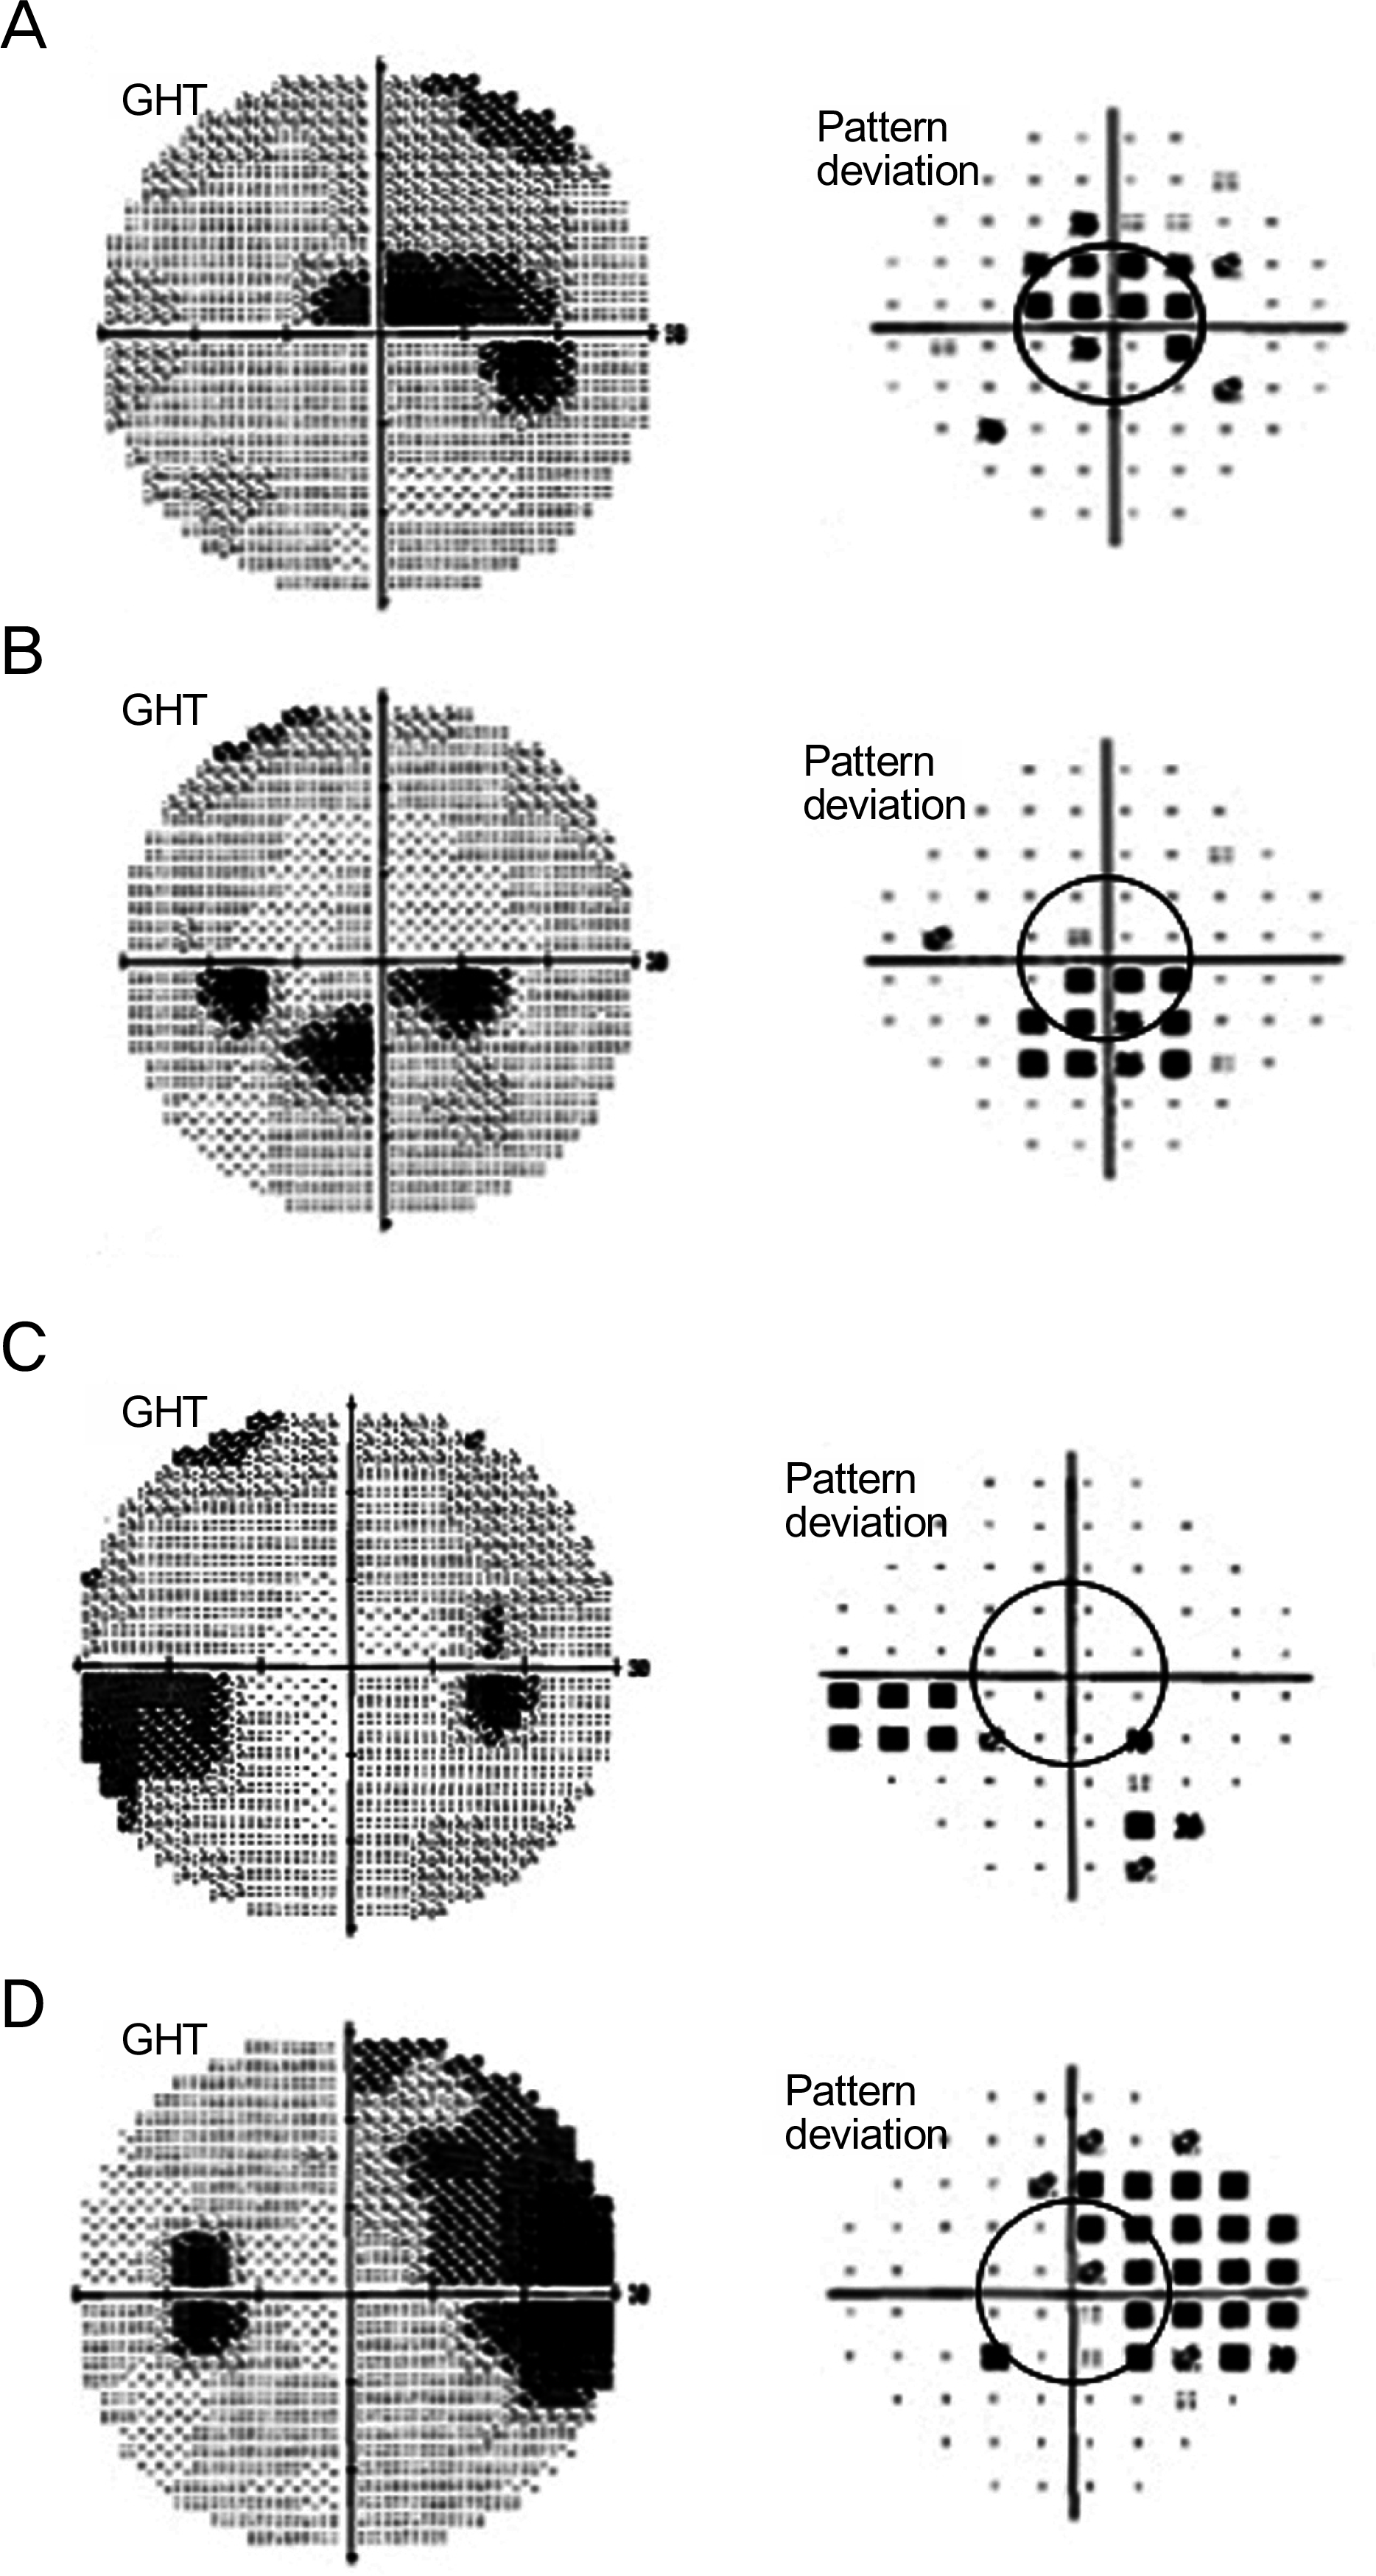
 | Figure 2.Examples of visual field defect evaluation on visual field gray scale and pattern deviation scale (A, B) Central field defects, (C, D) Peripheral field defects. GHT = glaucoma hemifield test. |
Table 1.
Demographics and characteristics of patients with normal tension glaucoma
| Central scotoma | Peripheral scotoma | p-value | |
|---|---|---|---|
| Number of patients | 33 | 48 | |
| Sex (M/F) | 12/21 | 26/22 | 0.174∗ |
| Age (yr) | 60.2 ± 10.6 | 59.0 ± 10.2 | 0.621† |
| Hypertension | 20 | 11 | 0.001∗ |
| Diabetes mellitus | 7 | 11 | 1.000∗ |
| Smoking | 9 | 13 | 1.000∗ |
| Laterality (Rt/Lt) | 22/11 | 23/25 | 0.115∗ |
| Intraocular pressure (mm Hg) | 14.5 ± 2.4 | 14.7 ± 2.8 | 0.739† |
| Central corneal thickness (μ m) | 533.1 ± 18.2 | 545.0 ± 30.0 | 0.030† |
| Mean deviation of visual field (dB) | ‐3.62 ± 1.96 | ‐4.14 ± 2.92 | 0.343† |
| Pattern standard deviation of visual field (dB) | 4.27 ± 2.49 | 5.10 ± 2.67 | 0.164† |
| Cup disc ratio | 0.72 ± 0.12 | 0.71 ± 0.11 | 0.732† |
| β zone area of peripapillary atrophy (mm2) | 0.62 ± 0.86 | 0.56 ± 0.81 | 0.730† |
| Visual acuity (log MAR) | 0.07 ± 0.15 | 0.06 ± 0.12 | 0.747† |
| Refractive errors (spherical equivalent, diopter) | ‐0.42 ± 1.65 | ‐0.35 ± 1.70 | 0.837† |
Table 2.
The risk factors for central field defects in normal tension glaucoma
Table 3.
Number (percentage) of abnormal points in subfields
| Total number of points in subfields | Number (%) of abnormal points | |
|---|---|---|
| Superior, central | 198 (6 × 33) | 76 (38.4) |
| Inferior, central | 198 (6 × 33) | 50 (25.3) |
| p-value∗ | 0.007 | |
| Superior, peripheral | 1488 (31 × 48) | 251 (16.9) |
| Inferior, peripheral | 1488 (31 × 48) | 188 (12.6) |
| p-value∗ | 0.001 |
Table 4.
Number (percentage) of abnormal clusters in subfields
| Total number of clusters in subfields | Number (%) of abnormal clusters | |
|---|---|---|
| Superior, central | 66 (2 × 33) | 13 (19.7) |
| Inferior, central | 66 (2 × 33) | 11 (16.7) |
| p-value∗ | 0.132 | |
| Superior, peripheral | 480 (10 × 48) | 61 (12.7) |
| Inferior, peripheral | 480 (10 × 48) | 50 (10.4) |
| p-value∗ | 0.313 |


 PDF
PDF ePub
ePub Citation
 Print
Print


 XML Download