Abstract
Purpose
To investigate the correlation of macular retinal thickness and refractive error using spectral-domain optical coherence tomography (SD-OCT).
Methods
A total of 120 eyes with no posterior abnormalities were enrolled in the present study. Subjects were divided into 3 groups based on their spherical equivalent. Visual acuity, refraction, slit lamp examination, tonometry and fundus examination were performed. Retinal thickness between the RPE and IS/OS junction was measured at the fovea, 1 mm (inner ring) and 2 mm (outer ring) superiorly, inferiorly, nasally and temporally using SD-OCT. Overall average thickness, average foveal thickness, and the inner and outer ring macular thickness were measured.
Results
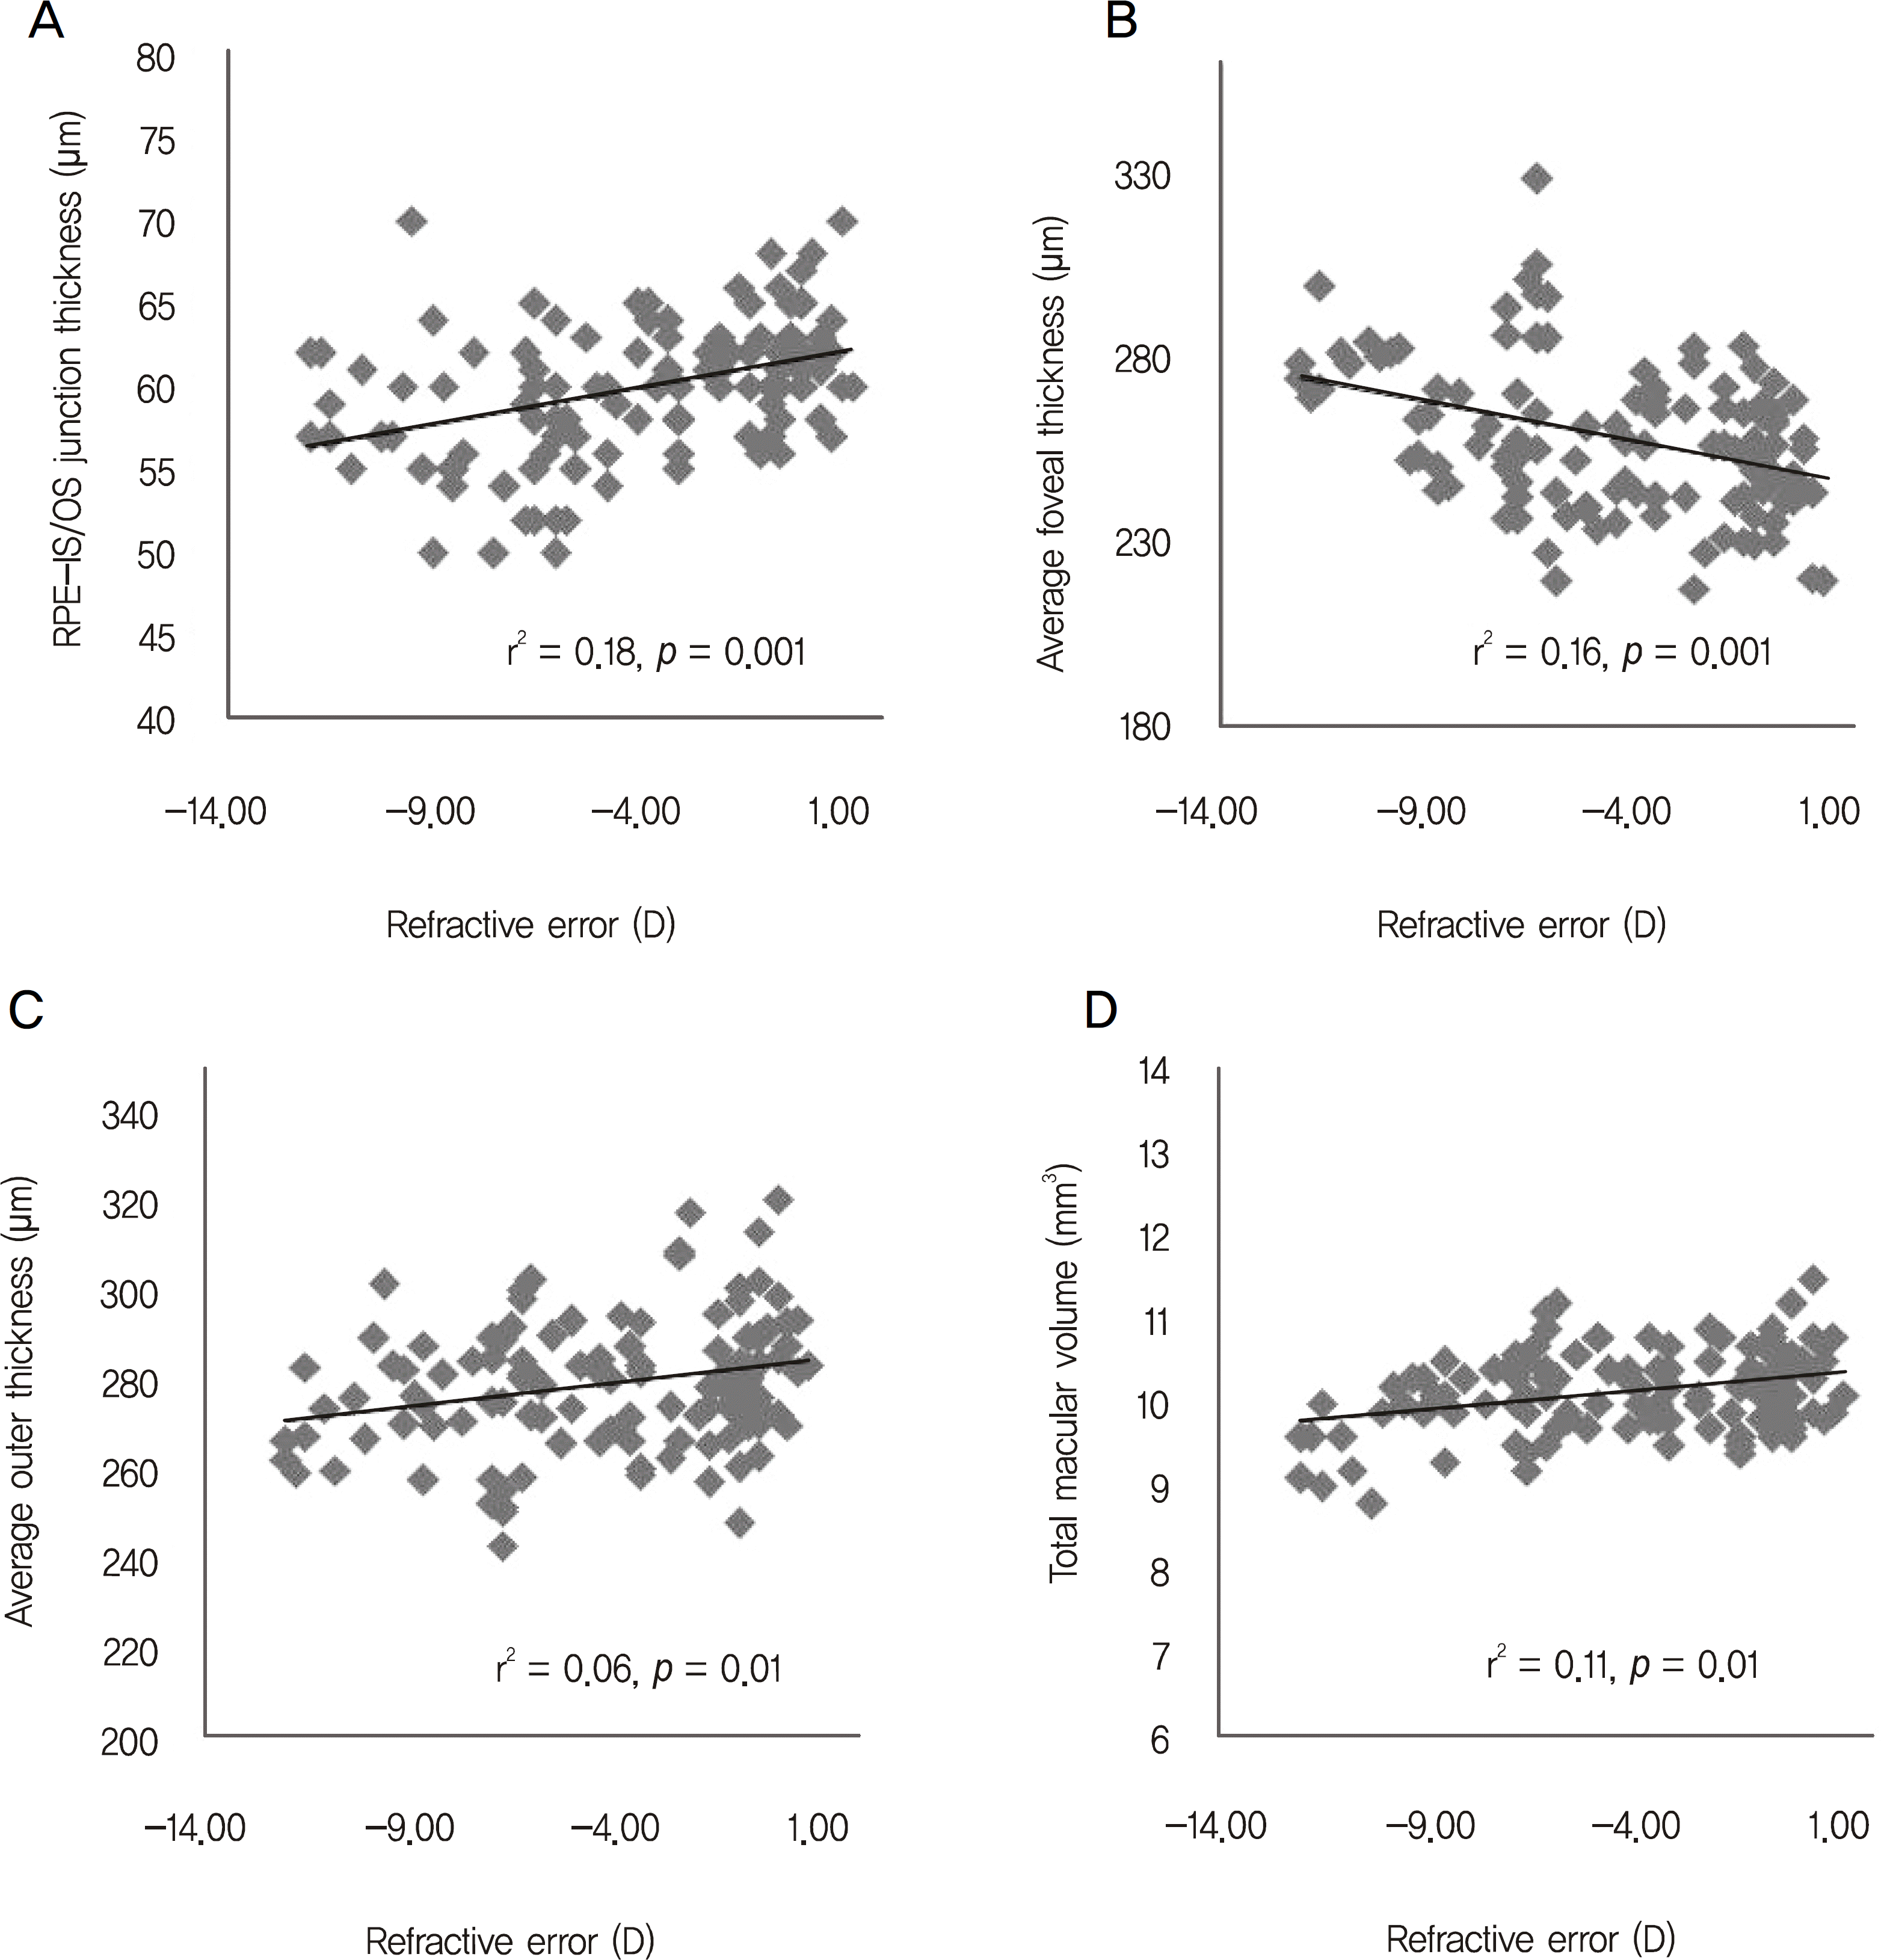
The average foveal thickness was significantly greater in the high myopic eyes than in the low to moderate myopic and emmetropic eyes (p = 0.001). However, the RPE-IS/OS junction thickness of the foveola and the outer macular thickness were significantly lower (p = 0.001, p = 0.002) in the high myopic eyes. There was a weak, but significant negative correlation between refractive error and average foveal thickness (r = −0.38, p = 0.001). A positive correlation was found between refractive error and the RPE-IS/OS junction thickness (r = 0.40, p = 0.001).
Conclusions
Macular retinal thickness is related to refractive error in normal subjects. Effects of eyeball elongation are more apparent in high myopic eyes than in low to moderate myopic eyes. A significant decline in the RPE-IS/OS junction thickness suggests the photoreceptor outer segments in the foveola are damaged in high myopic eyes.
References
1. Katz J, Tielsch JM, Sommer A. Prevalence and risk factors for refractive errors in an adult inner city population. Invest Ophthalmol Vis Sci. 1997; 38:334–40.
2. Wang Q, Klein BE, Klein R, Moss SE. Refractive status in the Beaver Dam Eye Study. Invest Ophthalmol Vis Sci. 1994; 35:4344–7.
3. Wong TY, Foster PJ, Hee J, et al. Prevalence and risk factors for refractive errors in adult Chinese in Singapore. Invest Ophthalmol Vis Sci. 2000; 41:2486–94.
4. Kang SH, Kim PS, Choi DG. Prevalence of myopia in 19-year-old Korean males: The relationship between the prevalence and education or urbanization. J Korean Ophthalmol Soc. 2004; 45:2082–7.
5. Apple DJ, Fabb MF. Clinicopathologic Correlation of Ocular Disease: a Text and Stereoscopic Atlas. St. Louis: CV Mosby;1978. p. 39–44.
6. Yanoff M, Fine BS. Ocular Pathology: A Text and Atlas. Philadelphia: Harper & Row;1982. p. 513–4.
7. Lim MC, Hoh ST, Foster PJ, et al. Use of optical coherence tomography to assess variations in macular retinal thickness in myopia. Invest Ophthalmol Vis Sci. 2005; 46:974–8.

8. Göbel W, Hartmann F, Haigis W. Determination of retinal thickness in relation to the age and axial length using optical coherence tomography. Ophthalmologe. 2001; 98:157–62.
9. Wakitani Y, Sasoh M, Sugimoto M, et al. Macular thickness measurements in healthy subjects with different axial lengths using optical coherence tomography. Retina. 2003; 23:177–82.

10. Zou H, Zhang X, Xu X, Yu S. Quantitative in vivo retinal thickness measurement in Chinese healthy subjects with retinal thickness analyzer. Invest Ophthalmol Vis Sci. 2006; 47:341–7.

11. Chan CM, Yu JH, Chen LJ, et al. Posterior pole retinal thickness measurements by the retinal thickness analyzer in healthy Chinese subjects. Retina. 2006; 26:176–81.

12. Lim MC, Hoh ST, Foster PJ, et al. Use of optical coherence tomography to assess variations in macular retinal thickness in myopia. Invest Ophthalmol Vis Sci. 2005; 46:974–8.

13. Lam DS, Leung KS, Mohamed S, et al. Regional variations in the relationship between macular thickness measurements and myopia. Invest Ophthalmol Vis Sci. 2007; 48:376–82.

14. Wu PC, Chen YJ, Chen CH, et al. Assessment of macular retinal thickness and volume in normal eyes and highly myopic eyes with third-generation optical coherence tomography. Eye. 2008; 22:551–5.

15. Sayanagi K, Ikuno Y, Soga K, Tano Y. Photoreceptor inner and outer segment defects in myopic foveoschisis. Am J Ophthalmol. 2008; 145:902–8.

16. Kleinstein RN, Jones LA, Hullett S, et al. Refractive error and ethnicity in children. Arch Ophthalmol. 2003; 121:1141–7.

17. Lin LL, Shih YF, Hsiao CK, et al. Epidemiologic study of the prevalence and severity of myopia among schoolchildren in Taiwan in 2000. J Formos Med Assoc. 2001; 100:684–91.
18. Ho J, Castro DP, Castro LC, et al. Clinical assessment of mirror artifacts in spectral-domain optical coherence tomography. Invest Ophthalmol Vis Sci. 2010; 51:3714–20.

19. Early Treatment Diabetic Retinopathy Study design and baseline patient characteristics. ETDRS Report No. 7. Ophthalmology. 1991; 98:741–56.
20. Zejmo M, Formiń ska-Kapuś cik M, Pieczara E, et al. Etiopathogenesis and management of high-degree myopia. Part I. Med Sci Monit. 2009; 15:199–202.
21. Kempen JH, Mitchell P, Lee KE, et al. The prevalence of refractive errors among adults in the United States, Western Europe, and Australia. Arch Ophthalmol. 2004; 122:495–505.
22. Saw SM, Gazzard G, Shih-Yen EC, Chua WH. Myopia and associated pathological complications. Ophthalmic Physiol Opt. 2005; 25:381–91.

23. Ikuno Y, Tano Y. Retinal and choroidal biometry in highly myopic eyes with spectral-domain optical coherence tomography. Invest Ophthalmol Vis Sci. 2009; 50:3876–80.

24. Ikuno Y, Jo Y, Hamasaki T, Tano Y. Ocular risk factors for choroidal neovascularization in pathologic myopia. Invest Ophthalmol Vis Sci. 2010; 51:3721–5.

25. Curtin BJ, Karlin DB. Axial length measurements and fundus changes of the myopic eye. Am J Ophthalmol. 1971; 71:42–53.

27. Jonas JB, Berenshtein E, Holbach L. Lamina cribrosa thickness and spatial relationships between intraocular space and cerebrospinal fluid space in highly myopic eyes. Invest Ophthalmol Vis Sci. 2004; 45:2660–5.

28. McDonnell JM. Ocular embryology and anatomy. Ogden TE, editor. Retina. 1. St Louis: CV Mosby;1989. p. 5–16.
29. Choi SW, Lee SJ. Thickness changes in the fovea and peripapillary retinal nerve fiber layer depend on the degree of myopia. Korean J Ophthalmol. 2006; 20:215–9.

30. Song WK, Lee SC, Lee ES, et al. Macular Thickness Variations with Sex, Age, and Axial Length in Healthy Subjects: a Spectral Domain-Optical Coherence Tomography Study. Invest Ophthalmol Vis Sci. 2010; 51:3913–8.

31. Li KY, Tiruveedhula P, Roorda A. Intersubject variability of foveal cone photoreceptor density in relation to eye length. Invest Ophthalmol Vis Sci. 2010; 51:6858–67.

32. Liang H, Crewther DP, Crewther SG, Barila AM. A role for photoreceptor outer segments in the induction of deprivation myopia. Vision Res. 1995; 35:1217–25.

33. Rostgaard J, Qvortrup K. A note about retinal structure and visual acuity. A light microscopic study of the cones in fovea centralis. Acta Ophthalmol Scand. 1999; 77:45–9.

34. Kawabata H, Adachi-Usami E. Multifocal electroretinogram in myopia. Invest Ophthalmol Vis Sci. 1997; 38:2844–51.
35. Wolsley CJ, Saunders KJ, Silvestri G, Anderson RS. Investigation of changes in the myopic retina using multifocal electroretinograms, optical coherence tomography and peripheral resolution acuity. Vision Res. 2008; 48:1554–61.

36. Abbott CJ, Grünert U, Pianta MJ, McBrien NA. Retinal thinning in tree shrews with induced high myopia: optical coherence tomography and histological assessment. Vision Res. 2011; 51:376–85.

37. Teakle EM, Wildsoet CF, Vaney DI. The spatial organization of tyrosine hydroxylase-immunoreactive amacrine cells in the chicken retina and the consequences of myopia. Vision Res. 1993; 33:2383–96.

38. Kanai K, Abe T, Murayama K, Yoneya S. Retinal thickness and changes with age. Nippon Ganka Gakkai Zasshi. 2002; 106:162–5.

39. Kang JH, Kim SA, Song UG, Yun HS. Macular thickness changes with age in normal subjects measured by optical coherence tomography. J Korean Ophthalmol Soc. 2004; 45:592–8.
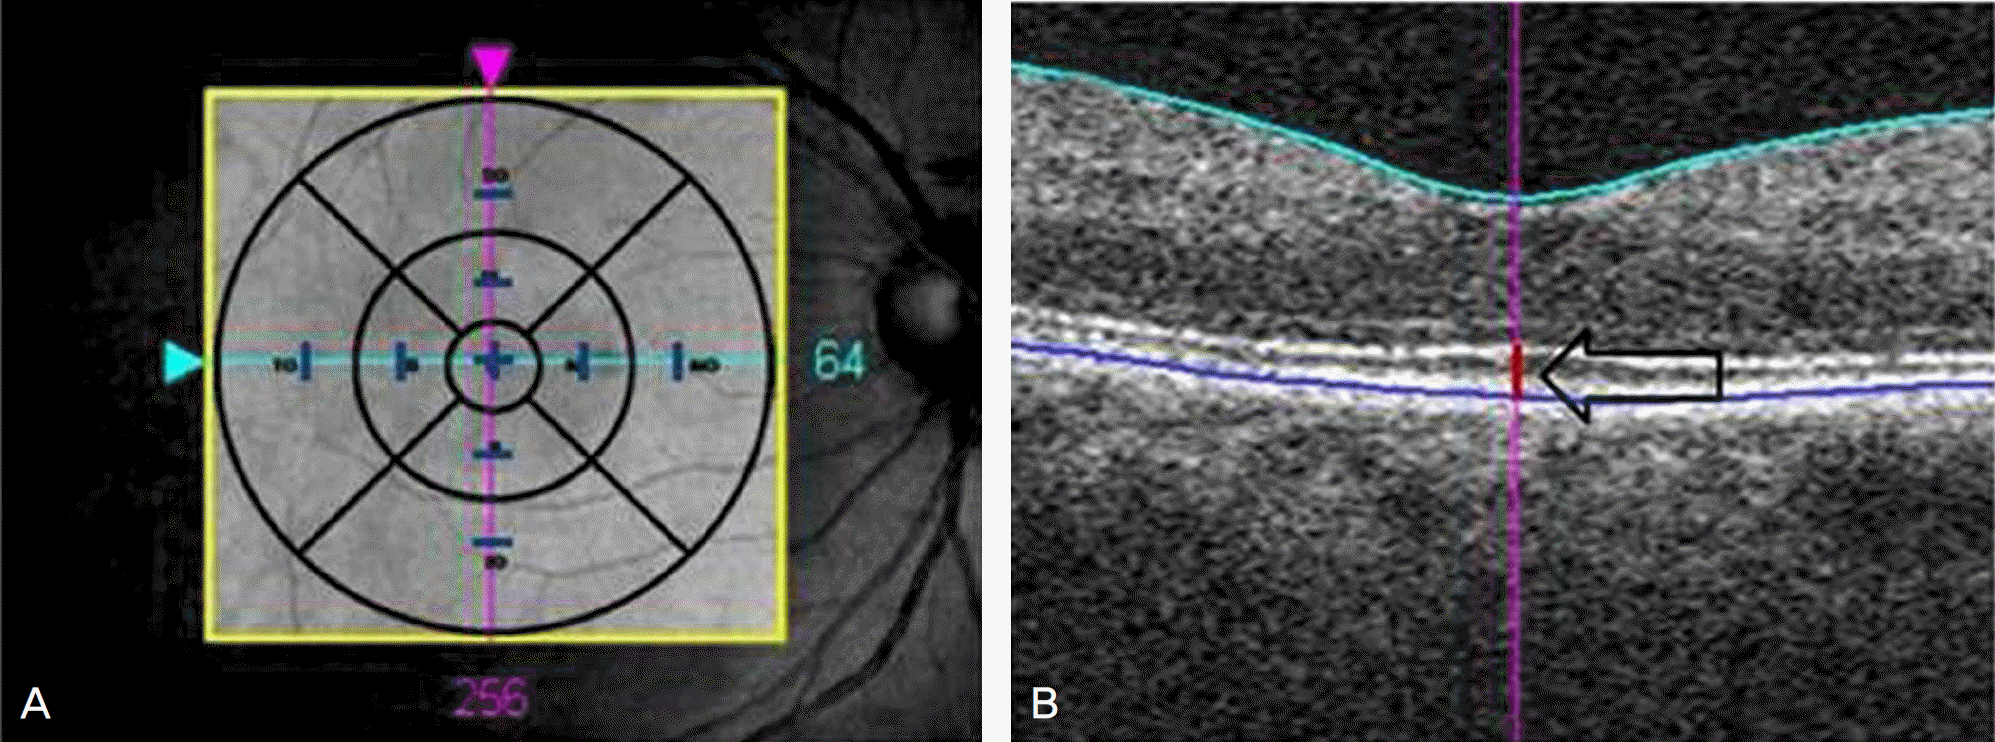
Figure 1.
Intraretinal measurements in Cirrus HD-OCT. Retinal thickness between RPE and IS/OS junction was measured at the fovea, 1.0 mm superiorly, 1.0 mm inferiorly, 1.0 mm nasally, 1.0 mm temporally, 2.0 mm superiorly, 2.0 mm inferiorly, 2.0 mm nasally and 2.0 mm temporally (Blue bar in figure 1A), by manually using the scale supplied with the software (Black arrow in figure 1B). Note that measurements in 1.0 mm superiorly, inferiorly, nasally and temporally represent inner circle and measurements in 2.0 mm superiorly, inferiorly, nasally and temporally represent outer circle, similarly.

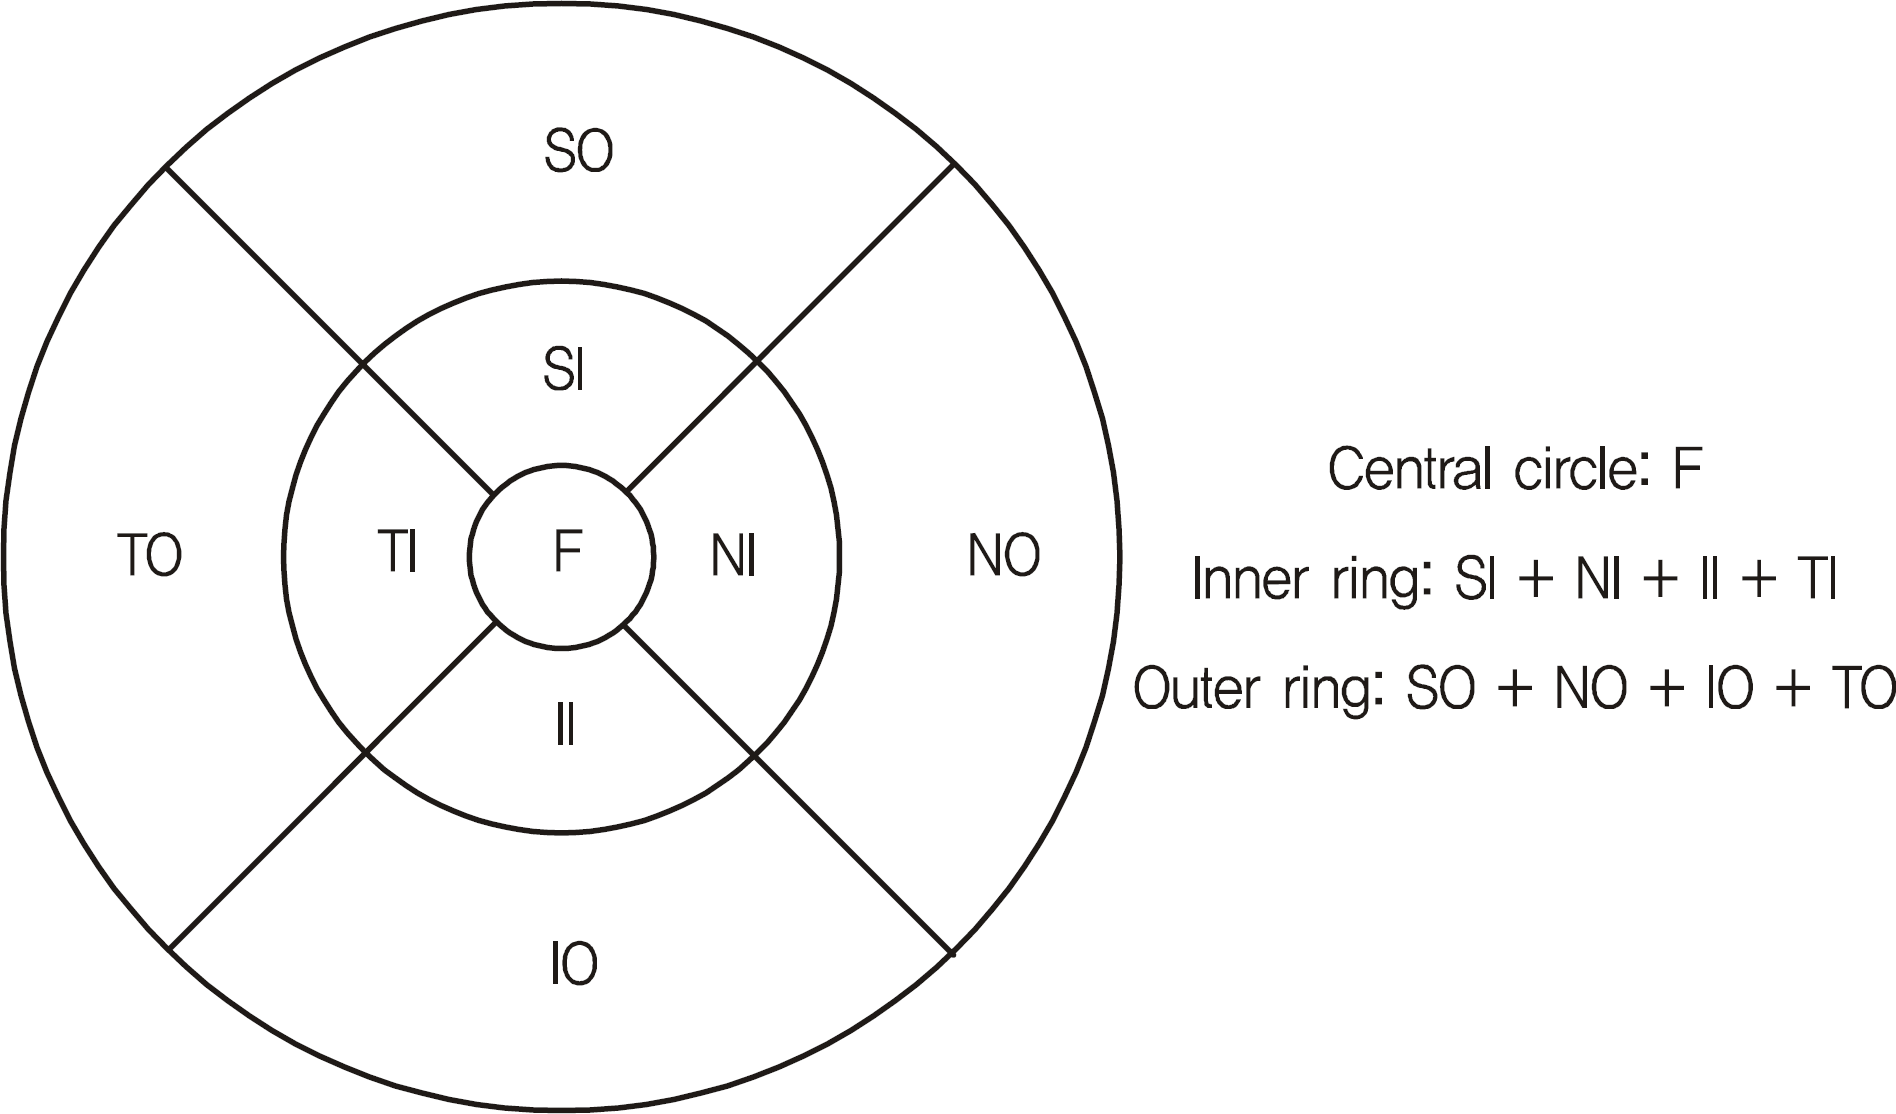
Figure 2.
ETDRS subfields within standard 1, 3 and 6 mm diameter concentric circles on the right used for reporting retinal thickness. F = fovea; SI = superior Inner; NI = nasal inner; II = inferior inner; TI = temporal inner; SO = superior outer; NO = nasal outer; IO = inferior outer; TO = temporal outer.

Figure 3.
Scatterplots show the relationship between spherical equivalent and macular measurements. As myopia became more severe, average foveal thickness (B) increased. In contrast, thickness between RPE-IS/OS junction (A), average outer thickness (C) and total macular volume (D) decreased as myopia became more severe.

Table 1.
Baseline data of the four groups
| | Group 1(Emmetropia) | Group 2(Low to moderate myopia) | Group 3(High myopia) | p |
|---|---|---|---|---|
| Subjects (eye) | 40 | 40 | 40 | |
| Sex (M/F) | 25/15 | 21/19 | 30/10 | |
| Age (yr) | 39.7 ± 8.1 | 40.0 ± 10.3 | 36.0 ± 12.3 | 0.14 |
| Spherical equivalent (D) | −0.05 ± 0.55 | −3.36 ± 1.51 | −8.19 ± 1.99 | 0.000* |
| BCVA† (log MAR) | 0.02 ± 0.05 | 0.03 ± 0.06 | 0.04 ± 0.05 | 0.3 |
Table 2.
Retinal thickness between RPE and IS/OS junction in photoreceptor layer (µm) in the 4 groups
| | Group 1(Emmetropia) | Group 2(Low to moderate) | Group 3(High myopia) | p* |
|---|---|---|---|---|
| Central fovea | 62.00 ± 3.21 (p = 0.001)† | 60.03 ± 3.51 (p = 0.03)‡ | 57.85 ± 4.45 | 0.001 |
| 1.0 mm superior§ | 40.92 ± 6.80 | 39.23 ± 8.93 | 38.79 ± 8.05 | 0.84 |
| 1.0 mm inferior§ | 41.42 ± 6.33 | 40.68 ± 6.8 | 39.24 ± 8.1 | 0.39 |
| 1.0 mm nasal§ | 42.17 ± 5.72 | 40.88 ± 8.02 | 40.17 ± 10.3 | 0.33 |
| 1.0 mm temporal§ | 42.10 ± 5.29 | 40.56 ± 8.13 | 38.57 ± 10.5 | 0.10 |
| 2.0 mm superior∏ | 39.80 ± 6.80 | 38.23 ± 8.55 | 38.44 ± 7.63 | 0.40 |
| 2.0 mm inferior∏ | 38.75 ± 7.96 | 39.05 ± 7.35 | 39.20 ± 7.19 | 0.87 |
| 2.0 mm nasal∏ | 38.57 ± 5.45 | 39.91 ± 7.46 | 38.91 ± 7.46 | 0.78 |
| 2.0 mm temporal∏ | 42.03 ± 7.09 | 41.24 ± 9.31 | 40.40 ± 10.65 | 0.29 |
† Statistically significant difference between group 1 and group 3 with Bonferroni post hoc test (p < 0.05)
‡ Statistically significant difference between group 2 and group 3 with Bonferroni post hoc test (p < 0.05)
Table 3.
Relationship between macular thickness (μ m) and myopia
| | Group 1 (Emmetropia) | Group 2 (Low to moderate) | Group 3 (High myopia) | p* |
|---|---|---|---|---|
| Average foveal (1.0 mm) | 251.1 ± 14.6 (p = 0.001)† | 252.4 ± 18.8 (p = 0.001)‡ | 269.1 ± 20.7 | 0.000 |
| Superior inner | 326.7 ± 12.8 | 324.9 ± 12.8 | 319.6 ± 16.2 | 0.07 |
| Inferior inner | 318.7 ± 11.1 | 320.8 ± 15.4 | 319.4 ± 17.5 | 0.82 |
| Nasal inner | 330.1 ± 12.6 | 325.1 ± 13.8 | 324.7 ± 17.3 | 0.19 |
| Temporal inner | 315.5 ± 12.5 | 314.7 ± 12.9 | 310.9 ± 16.3 | 0.30 |
| Average inner | 322.7 ± 10.8 | 321.4 ± 12.5 | 318.7 ± 15.6 | 0.37 |
| Superior outer | 282.8 ± 16.0 (p = 0.04)† | 281.6 ± 14.4 (p = 0.14) | 274.6 ± 16.3 | 0.04 |
| Inferior outer | 275.3 ± 16.3 (p = 0.02)† | 270.2 ± 13.6 (p = 0.57) | 265.7 ± 15.7 | 0.02 |
| Nasal outer | 303.6 ± 16.6 | 303.4 ± 23.3 | 296.8 ± 19.1 | 0.23 |
| Temporal outer | 269.9 ± 15.2 (p = 0.006)† | 266.3 ± 13.7 (p = 0.12) | 259.3 ± 16.0 | 0.01 |
| Average outer | 282.9 ± 14.3 (p = 0.02)† | 280.4 ± 14.5 (p = 0.17) | 274.1 ± 14.7 | 0.02 |
| Overall average macula | 284.3 ± 13.8 | 281.8 ± 13.9 | 279.15 ± 14.72 | 0.28 |
| TMV (mm3)§ | 10.3 ± 0.5 (p = 0.008)† | 10.2 ± 0.5 (p = 0.10) | 9.9 ± 0.5 | 0.01 |
Table 4.
Correlations between RPE-IS/OS junction thickness and refractive error
| | r | p | r* | p* |
|---|---|---|---|---|
| Central fovea | 0.40 | 0.001† | 0.42 | 0.001† |
| 1.0 mm superior‡ | 0.03 | 0.85 | 0.10 | 0.71 |
| 1.0 mm inferior‡ | 0.13 | 0.29 | 0.08 | 0.53 |
| 1.0 mm nasal‡ | 0.16 | 0.10 | 0.13 | 0.28 |
| 1.0 mm temporal‡ | 0.16 | 0.12 | 0.11 | 0.39 |
| 2.0 mm superior§ | 0.07 | 0.57 | 0.1 | 0.44 |
| 2.0 mm inferior§ | 0.15 | 0.34 | 0.08 | 0.53 |
| 2.0 mm nasal§ | 0.06 | 0.58 | 0.05 | 0.87 |
| 2.0 mm temporal§ | 0.12 | 0.25 | 0.09 | 0.49 |
Table 5.
Correlations between macular measurements and refractive error
| | r | p | r* | p* |
|---|---|---|---|---|
| Average foveal (1.0 mm) | −0.38 | 0.001† | −0.40 | 0.001† |
| Superior inner | 0.18 | 0.08 | 0.17 | 0.09 |
| Inferior inner | 0.03 | 0.72 | 0.03 | 0.77 |
| Nasal inner | 0.15 | 0.11 | 0.15 | 0.11 |
| Temporal inner | 0.16 | 0.09 | 0.13 | 0.18 |
| Average inner | 0.16 | 0.09 | 0.14 | 0.12 |
| Superior outer | 0.23 | 0.01† | 0.22 | 0.01† |
| Inferior outer | 0.25 | 0.01† | 0.25 | 0.01† |
| Nasal outer | 0.15 | 0.09 | 0.14 | 0.12 |
| Temporal outer | 0.28 | 0.01† | 0.26 | 0.01† |
| Average outer | 0.25 | 0.01† | 0.24 | 0.01† |
| Overall average macula | 0.13 | 0.17 | 0.11 | 0.25 |
| TMV (mm3)‡ | 0.34 | 0.001† | 0.33 | 0.001† |


 PDF
PDF ePub
ePub Citation
 Print
Print


 XML Download