Abstract
Purpose
To investigate the changes of electroretinogram (ERG) at baseline and during the first 3 injections of intravitreal bevacizumab in central retinal vein occlusion (CRVO) patients.
Methods
Thirteen eyes of 13 CRVO patients who received 3 injections of intravitreal bevacizumab at 6-week intervals and who could be examined for visual acuity, optical coherence tomography and ERG at 4 weeks after each injection were included in the present study. In addition, the ERG results of the unaffected fellow eyes group at 4 weeks after each injection were compared with the CRVO eyes group.
Results
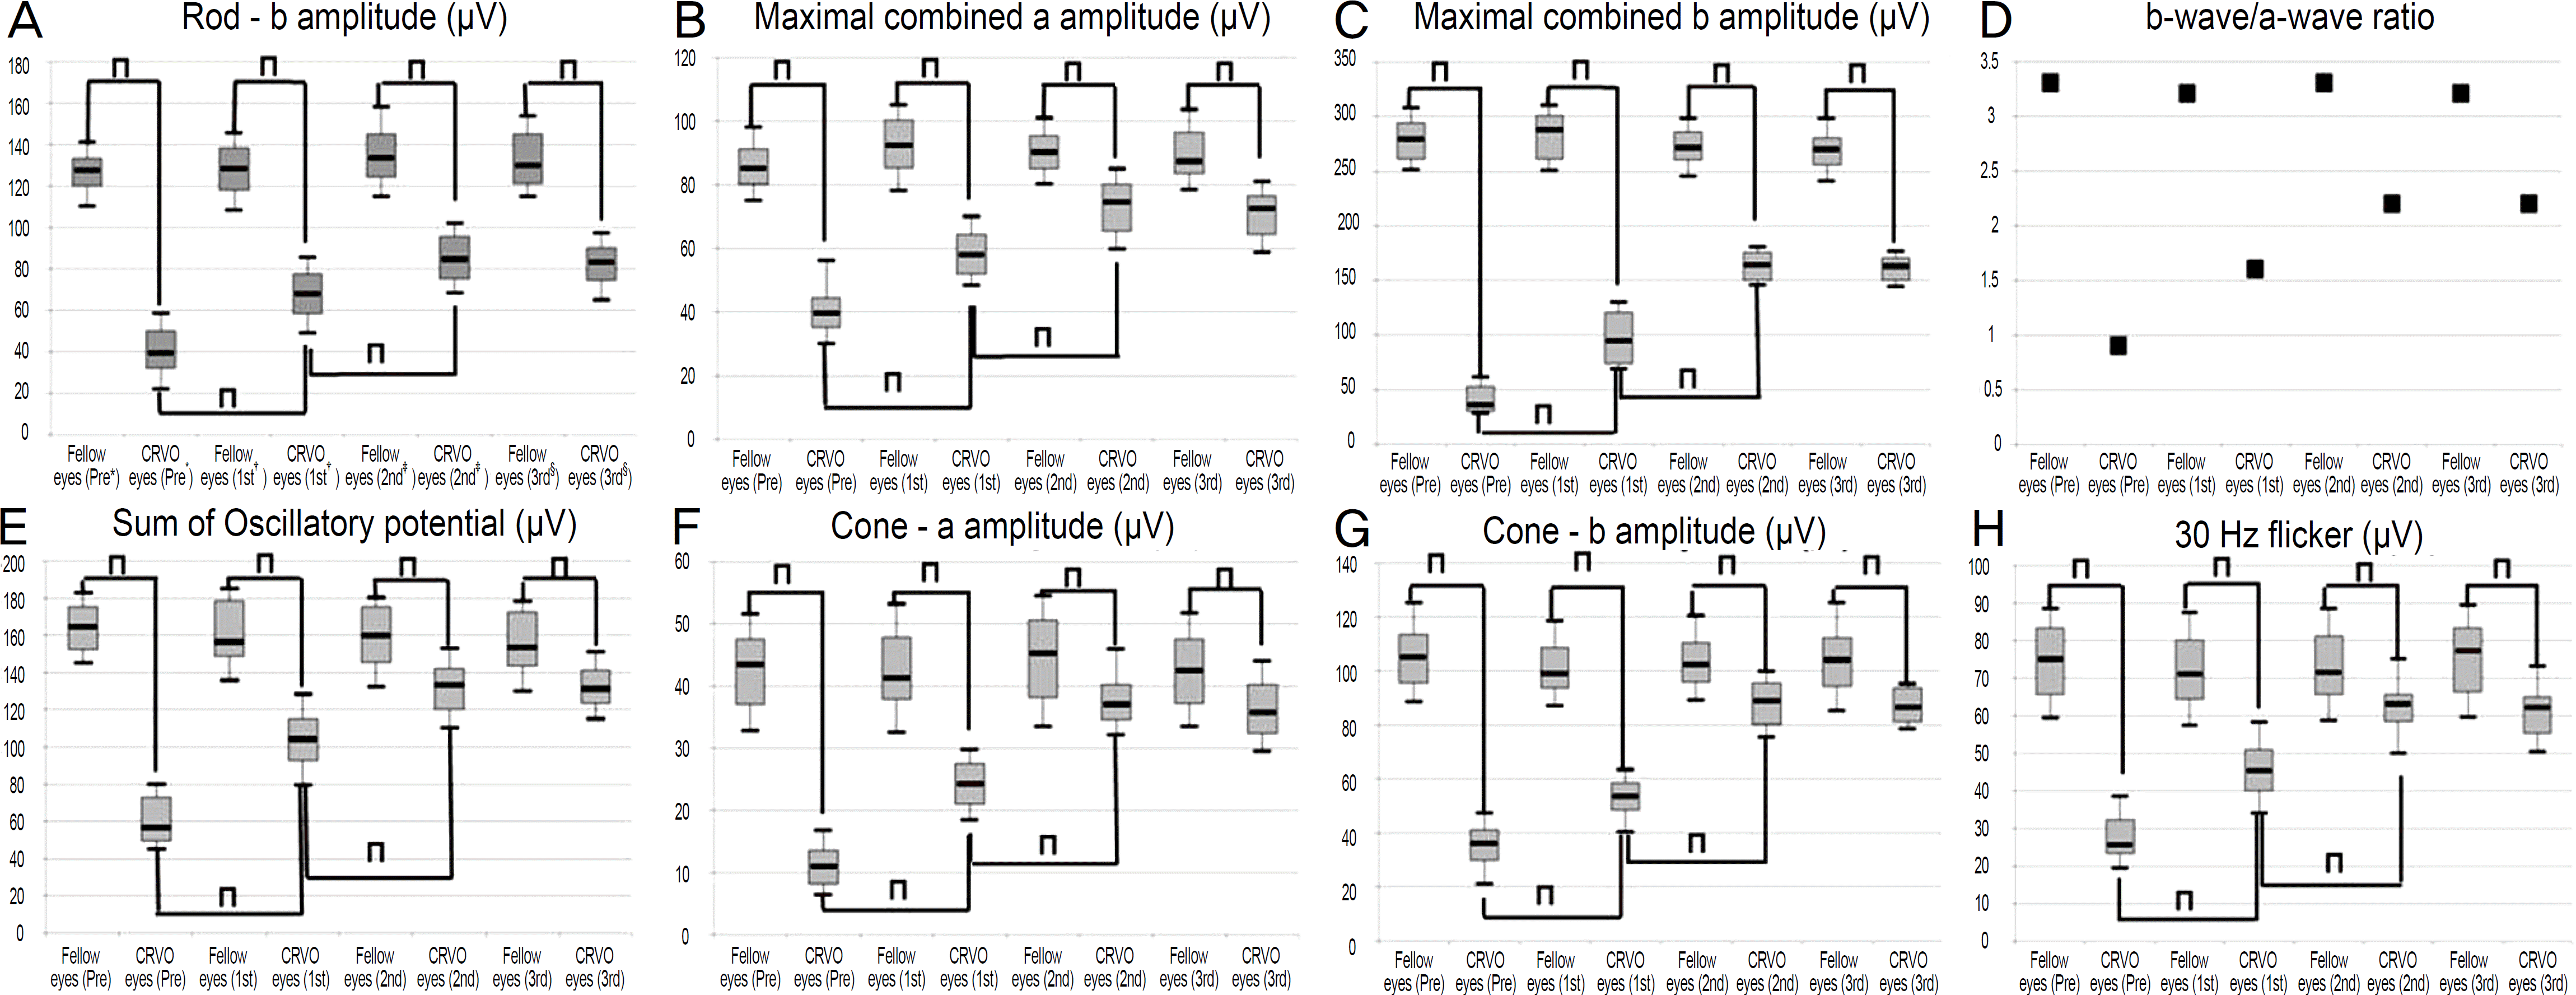
Amplitudes of rod b wave, a and b waves of maximal combined response and cone response, oscillatory potentials and 30-Hz flicker significantly decreased in the CRVO eyes group than the fellow eyes group at 4 weeks after each injection (p < 0.001). After injection, amplitudes of all the above-mentioned ERG parameters gradually increased during the 1st and the 2nd injection (p < 0.001). However, there was no significant difference at 4 weeks after the 2nd and 3rd injections (p > 0.05).
References
1. Klein R, Klein BE, Moss SE, Meuer SM. The epidemiology of retinal vein occlusion: the Beaver Dam Eye Study. Trans Am Ophthalmol Soc. 2000; 98:133–41. discussion. 141–3.
2. Mitchell P, Smith W, Chang A. Prevalence and associations of retinal vein occlusion in Australia. The Blue Mountains Eye Study. Arch Ophthalmol. 1996; 114:1243–7.
3. Noma H, Funatsu H, Mimura T, et al. Vitreous levels of inter-leukin-6 and vascular endothelial growth factor in macular edema with central retinal vein occlusion. Ophthalmology. 2009; 116:87–93.

4. Guthoff R, Meigen T, Hennemann K, Schrader W. Comparison of bevacizumab and triamcinolone for treatment of macular edema secondary to central retinal vein occlusion–a matched-pairs analysis. Ophthalmologica. 2010; 224:126–32.
5. Spandau UH, Ihloff AK, Jonas JB. Intravitreal bevacizumab treatment of macular oedema due to central retinal vein occlusion. Acta Ophthalmol Scand. 2006; 84:555–6.

6. Iturralde D, Spaide RF, Meyerle CB, et al. Intravitreal bevacizumab (Avastin) treatment of macular edema in central retinal vein occlusion: a short-term study. Retina. 2006; 25:279–84.
7. Choi SW, Kim HW, Yun IH. Intravitreal bevacizumab treatment of macular edema in central retinal vein occlusion. J Korean Ophthalmol Soc. 2010; 51:707–15.

8. Oh JW, Yun IH. The usefulness of standard electroretinogram in classification of central retinal vein occlusion. J Korean Ophthalmol Soc. 2003; 44:1789–96.
9. Karpe G, Germanis M. The prognostic value of the electroretinogram in thrombosis of the retinal veins. Acta Ophthalmol Suppl. 1962; 70:202–29.

10. Breton ME, Quinn GE, Keene SS, et al. Electroretinogram parameters at presentation as predictors of rubeosis in central retinal vein occlusion patients. Ophthalmology. 1989; 96:1343–52.

11. Green WR, Chan CC, Hutchins GM, Terry JM. Central retinal vein occlusion: a prospective histopathologic study of 29 eyes in 28 cases. Trans Am Ophthalmol Soc. 1981; 79:371–422.
12. Ota M, Tsujikawa A, Murakami T, et al. Association between integrity of foveal photoreceptor layer and visual acuity in branch retinal vein occlusion. Br J Ophthalmol. 2007; 91:1644–9.

13. Matsui Y, Katsumi O, Sakaue H, Hirose T. Electroretinogram b/a wave ratio improvement in central retinal vein obstruction. Br J Ophthalmol. 1994; 78:191–8.

14. Chen H, Wu D, Huang S, Yan H. The photopic negative response of the flash electroretinogram in retinal vein occlusion. Doc Ophthalmol. 2006; 113:53–9.

Figure 1.
Boxplots show serial changes in ERG parameters (A-C, E-H) and graph shows changing of b-wave/ a-wave ratio (D) in CRVO eye group and fellow eye group. * Pre = baseline; †1st = ERG was performed at 4 weeks after the 1st intravitreal bevacizumab injection; ‡2nd = ERG was performed at 4 weeks after the 2nd intravitreal bevacizumab injection; §3rd = ERG was performed at 4 weeks after the 3rd intravitreal bevacizumab injection; ∏ p < 0.001.

Figure 2.
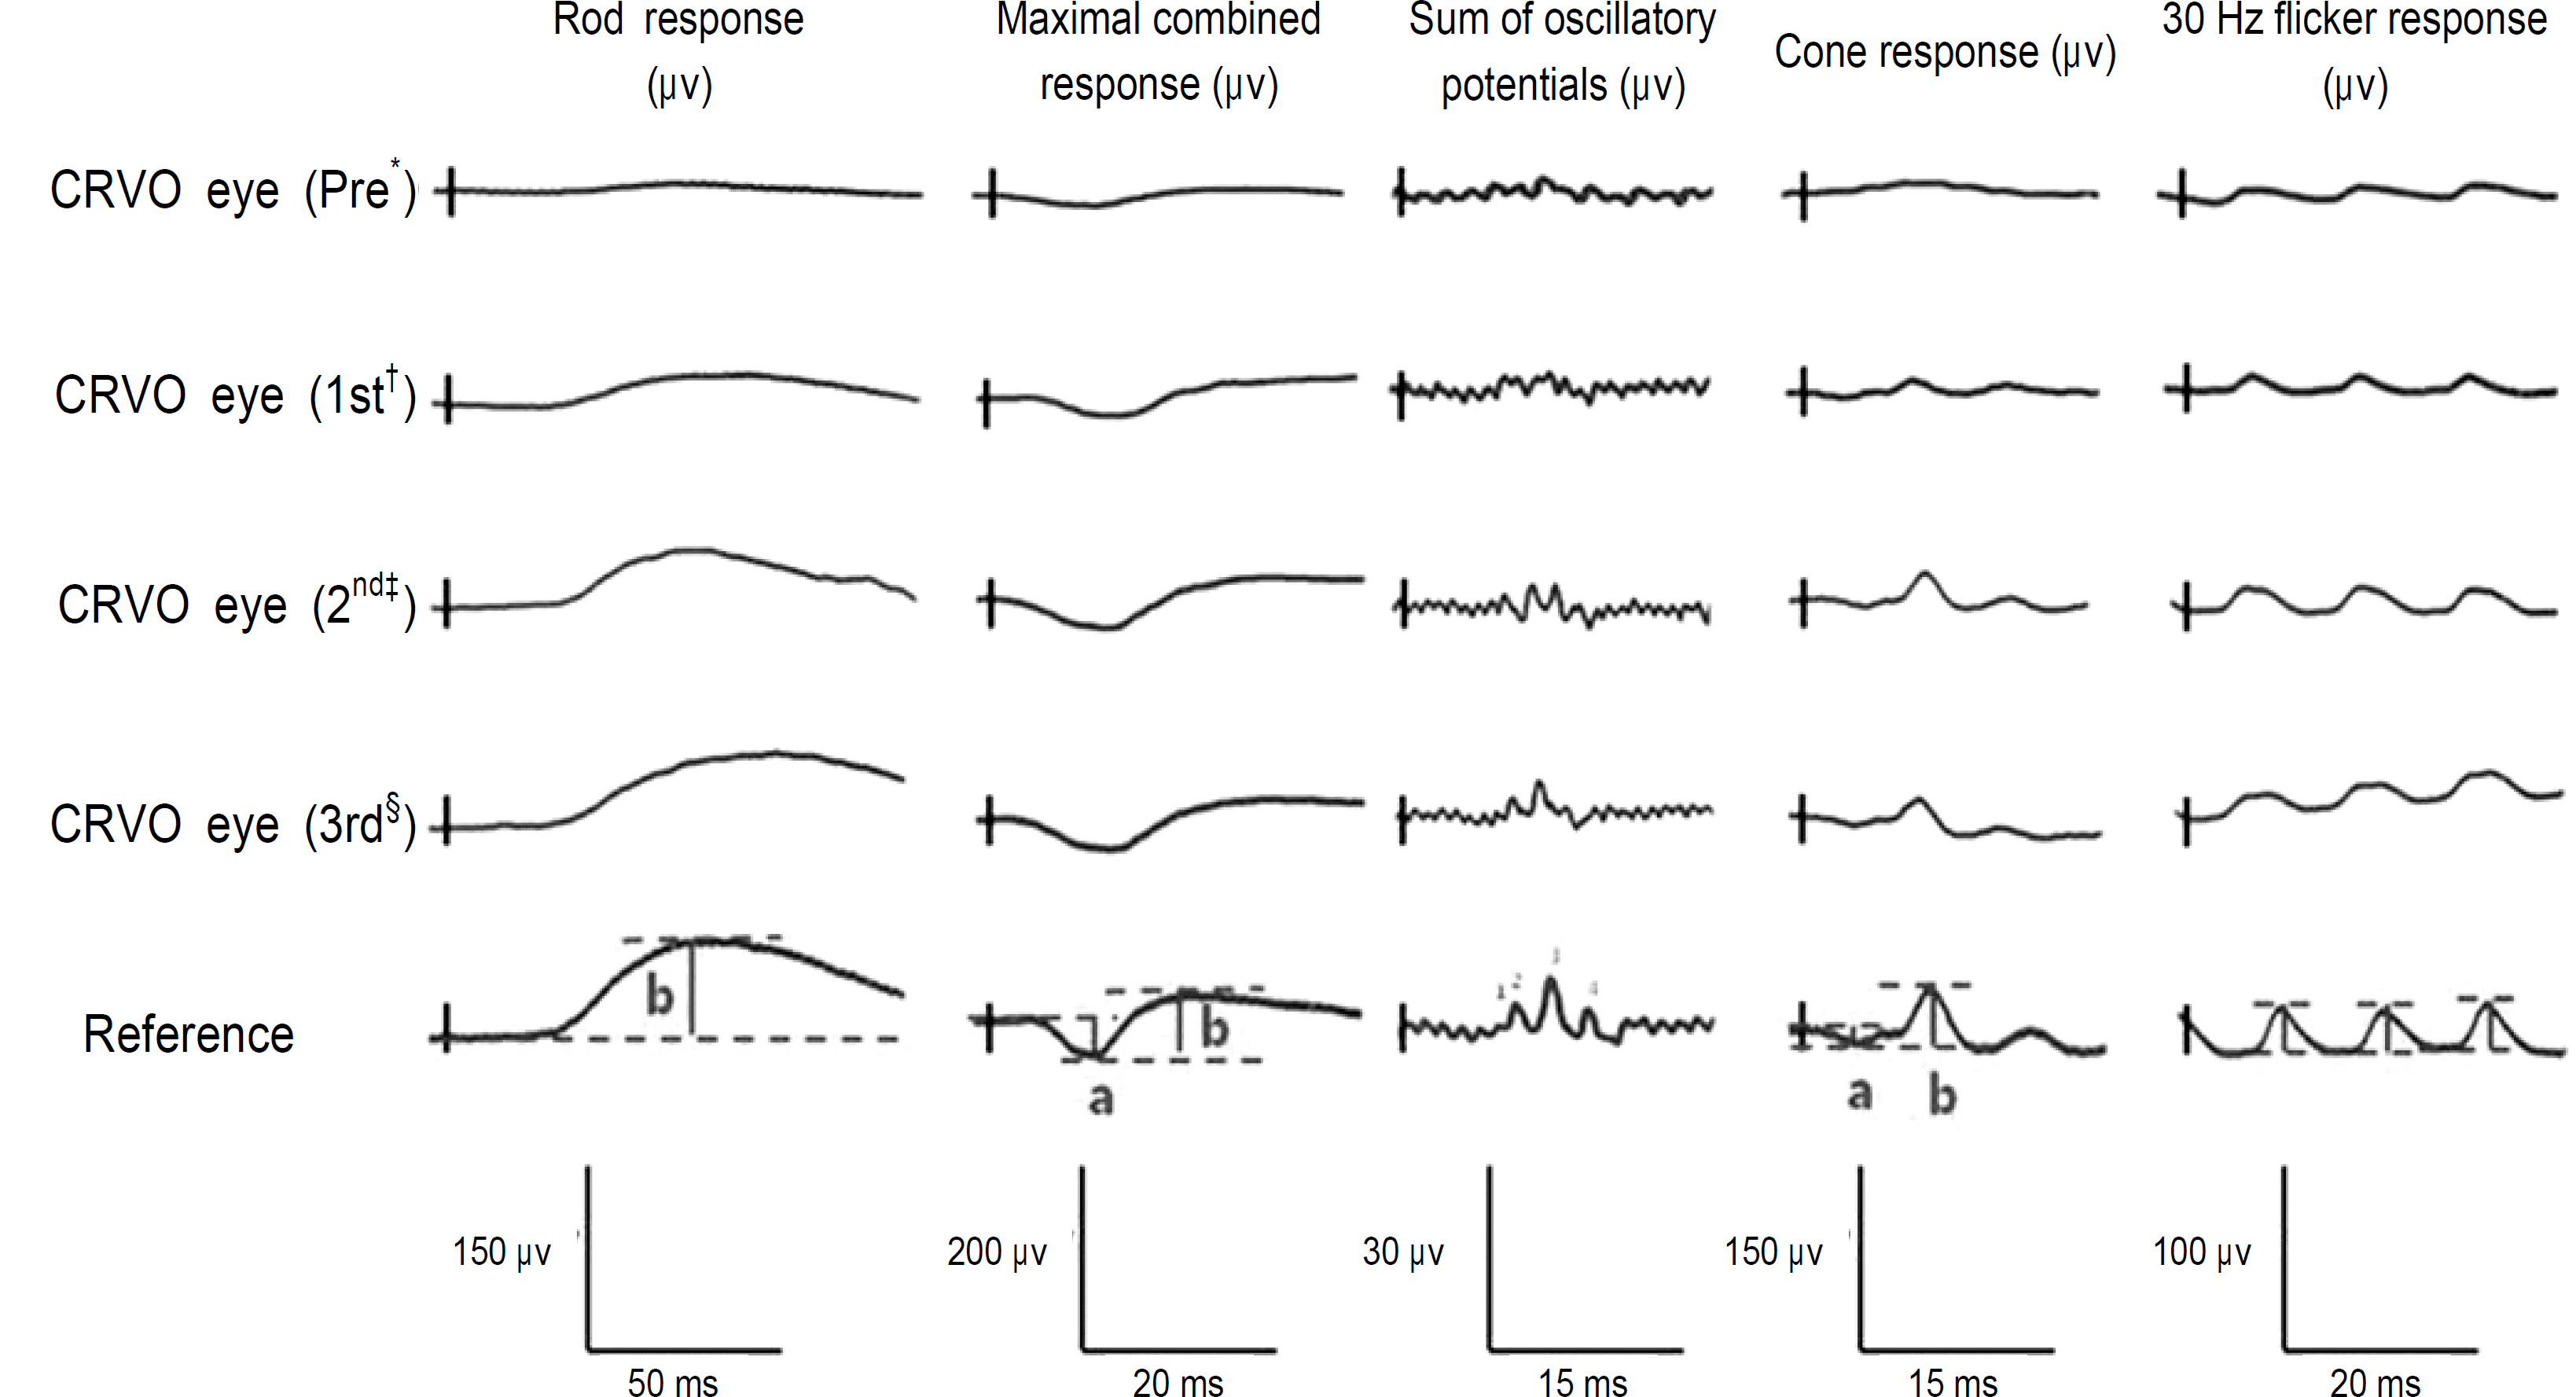
Representative standard ERG traces recorded from CRVO eye of one 58-year-old male after intravitreal bevacizumab injection. Reference ERG wave shows the measurement of ERG parameters. The amplitudes of rod-b wave were measured from the baseline to the peak of the wave. The amplitudes of maximal com-bined-a wave and cone-a wave were measured from the baseline to the through of the wave. The amplitudes of maximal combined-b and cone-b wave were measured from the through of the a wave to the peak of the b wave. The sum of oscillatory potential amplitude was automatically calculated by ERG program. The 30 Hz flicker responses were obtained from average of wave amplitudes during 10 seconds and were automatically calculated by ERG program as well. * Pre = baseline; †1st = ERG was performed at 4 weeks after the 1st intravitreal bevacizumab injection; ‡2nd = ERG was performed at 4 weeks after the 2nd intravitreal bevacizumab injection; §3rd = ERG was performed at 4 weeks after the 3rd intravitreal bevacizumab injection.

Table 1.
Background characteristics and changes in visual acuity (VA) and central foveal thickness (CFT) in thirteen patients with central retinal vein occlusion (CRVO)
| Patient | Sex | Age | Disease | CRVO eyes |
CRVO eyes (Pre*) |
CRVO eyes (1st†) |
CRVO eyes (2nd‡) |
CRVO eyes (3rd§) |
||||
|---|---|---|---|---|---|---|---|---|---|---|---|---|
| VA (logMAR)∏ | CFT (μ m)# | VA | CFT | VA | CFT | VA | CFT | |||||
| 1 | F | 81 | CRVO¶ | Left | 0.7 | 580 | 0.5 | 242 | 0.3 | 218 | 0.3 | 214 |
| 2 | F | 62 | CRVO | Right | 1.5 | 734 | 1.2 | 509 | 0.8 | 329 | 0.7 | 245 |
| 3 | M | 55 | CRVO | Right | 1.5 | 584 | 1.1 | 454 | 0.7 | 256 | 0.7 | 238 |
| 4 | F | 60 | CRVO | Left | 1.3 | 624 | 1 | 324 | 1 | 287 | 0.8 | 221 |
| 5 | M | 72 | CRVO | Left | 0.5 | 324 | 0.4 | 421 | 0.4 | 187 | 0.4 | 225 |
| 6 | M | 52 | CRVO | Right | 1.7 | 656 | 1.7 | 395 | 1.4 | 344 | 1 | 215 |
| 7 | F | 73 | CRVO | Left | 1.7 | 564 | 1.3 | 654 | 1 | 341 | 1 | 278 |
| 8 | F | 44 | CRVO | Right | 1.5 | 503 | 1.1 | 190 | 0.8 | 183 | 0.8 | 190 |
| 9 | F | 32 | CRVO | Right | 1.7 | 253 | 1.3 | 213 | 1 | 170 | 1 | 280 |
| 10 | M | 58 | CRVO | Right | 1.4 | 540 | 1.3 | 502 | 1.1 | 234 | 1 | 241 |
| 11 | M | 58 | CRVO | Left | 2 | 634 | 1.4 | 452 | 1 | 240 | 1 | 250 |
| 12 | M | 64 | CRVO | Right | 1.4 | 534 | 1 | 354 | 1 | 244 | 0.8 | 256 |
| 13 | F | 72 | CRVO | Left | 1.7 | 522 | 1.3 | 454 | 0.8 | 254 | 0.7 | 264 |
| Average (mean ± SD) | | 60.2 ±13.0 | | | 1.4 ±0.4 | 542.5 ±129.7 | 1.1 ±0.4 | 397.2 ±131.5 | 0.8 ±0.2 | 252.8±58.4 | 0.7 ±0.2 | 239.8 ±26.4 |
† 1st = Ocular examination and OCT was performed at 4 weeks after the 1st intravitreal bevacizumab injection
‡ 2nd = Ocular examination and OCT was performed at 4 weeks after the 2nd intravitreal bevacizumab injection
Table 2.
The changes in ERG parameters after intravitreal bevacizumab injection in CRVO eye group and fellow eye group
| ERG parameters |
Fellow eyes (Pre*) |
CRVO eyes (Pre) |
Fellow eyes (1st†) |
CRVO eyes (1st) |
Fellow eyes (2nd‡) |
CRVO eyes (2nd) |
Fellow eyes (3rd§) |
CRVO eyes (3rd) |
||||||||
|---|---|---|---|---|---|---|---|---|---|---|---|---|---|---|---|---|
| Amp∏ | Imp# | Amp | Imp | Amp | Imp | Amp | Imp | Amp | Imp | Amp | Imp | Amp | Imp | Amp | Imp | |
| Rod-b wave (mean ± SD) | 127.4±10.1 | 118.8±9.5 | 39.3±16.3 | 117.6±7.6 | 128.2±20.8 | 115.8±12.8 | 67.8±14.0¶ | 118.4±5.6 | 133.3±25.7 | 117.4±13.1 | 84.5±11.5¶ | 117.8±3.4 | 129.9±35.7 | 116.8±12.5 | 83.3±5.9 | 117.5±4.2 |
| Maximal combined response (mean±SD) | | | | | | | | | | | | | | | | |
| a-wave | 85.3±8.4 | 20.1±2.7 | 39.7±10.7 | 21.5±1.6 | 92.5±15.4 | 22.1±2.8 | 58.0±6.8¶ | 20.2±3.2 | 90.35±9.9 | 23.2±2.6 | 74.7±6.8¶ | 21.9±2.2 | 87.5±15.5 | 22.9±142 | 72.6±7.4 | 21.0±4.2 |
| b-wave | 279.0±22.5 | 62.1±3.7 | 35.3±13.6 | 62.5±5.2 | 287.5±35.4 | 63.24±3.4 | 94.3±22.6¶ | 62.1±3.3 | 271.4±39.5 | 60.3±5.8 | 163.7±20.1¶ | 62.4±8.2 | 269.9±35.8 | 58.4±6.2 | 162.6±17.5 | 63.1±2.2 |
| b/a ratio | 3.3 | | 0.9 | | 3.2 | | 1.6¶ | | 3.3 | | 2.2¶ | | 3.2 | | 2.2 | |
| Sum of oscillatory potentials (mean±SD) | 164.5±24.8 | | 56.7±12.5 | | 156.5±34.9 | | 104.2±11.4¶ | | 159.8±14.5 | | 133.2±5.6¶ | | 153.5±24.3 | | 2.2131.3±7.6 | |
| Cone response (mean±SD) | | | | | | | | | | | | | | | | |
| a-wave | 43.4±11.5 | 14.3±2.3 | 11.0±5.3 | 14.2±1.2 | 41.2±22.7 | 14.9±1.5 | 24.2±2.8¶ | 14.1±2.3 | 45.2±13.5 | 14.7±3.5 | 37.0±7.3¶ | 14.5±3.1 | 42.5±11.3 | 14.2±4.8 | 35.7±3.2 | 13.3±2.4 |
| b-wave | 105.0±19.4 | 36.2±10.8 | 36.4±5.4 | 36.4±3.7 | 98.9±21.6 | 35.8±2.9 | 53.6±11.8¶ | 36.8±1.3 | 102.4±29.5 | 35.5±5.2 | 89±10.5¶ | 37.1±2.3 | 104±12.1 | 37.5±4.1 | 86.4±8.8 | 36.4±2.1 |
| 30 Hz flicker | 75.1±11.4 | 27.8±3.3 | 25.7±6.1 | 28.6±4.9 | 71.1±13.9 | 28.7±2.4 | 45.4±8.8¶ | 28.4±2.9 | 71.6±21.9 | 29.4±10.9 | 63.2±7.5¶ | 28.9±3.2 | 77.3±19.8 | 29.2±2.7 | 62.3±8.8 | 27.9±2.2 |


 PDF
PDF ePub
ePub Citation
 Print
Print


 XML Download